Sample Category Title
The British Pound Tumbles Over Brexit Worst Case Scenario
The price of crude oil rose sharply after the US shot down an Iranian drone in the Strait of Hormuz. This came after the drone reportedly threatened an American warship. The incident took place a few weeks after Iran shot down an American drone that it claimed was in its waters. It also came a few hours after the Iranian Revolutionary Guard said it had seized a foreign vessel near the region. It detained the crew for allegedly smuggling oil. These events have made oil shipping in the region dangerous and many vessels are now being escorted by warships. Meanwhile, the Iranian foreign minister, Javad Zarif said that his country would not negotiate with the US unless sanctions were lifted.
Sterling rose sharply in the American and Asian sessions after the members of parliament passed a maneuver to avoid leaving the European Union without a deal. The chief EU negotiator, Michel Barnier also signaled that the EU was open to alternative arrangements at the Irish border. The maneuver passed by Parliament will stop Boris Johnson from suspending Parliament in order to force through a no deal Brexit. The impossible challenge for Johnson will be to pass any legislation in the divided Parliament. Yesterday, the UK announced impressive retail sales data.
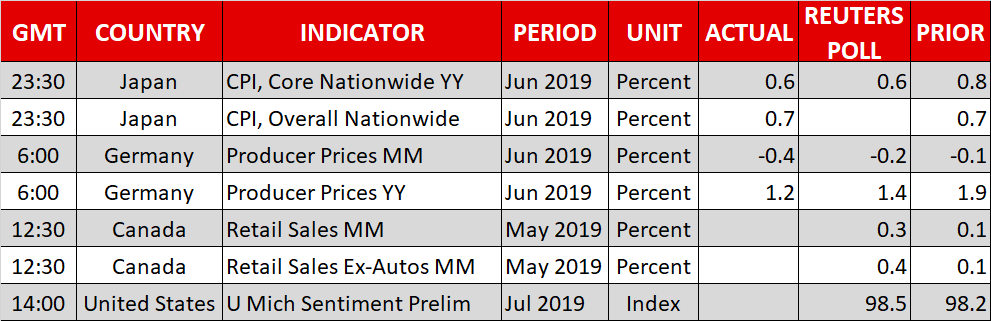
Earlier today, Iran released its national CPI data. The national core CPI declined from the previous 0.8% to 0.6% while the headline CPI remained unchanged at 0.7%. Today, Germany will release its PPI data, which is expected to show that the PPI declined from 1.9% to 1.4%. In Canada, Statistics Canada will release the retail sales numbers, which are expected to show a slight improvement. In the US, investors will receive the Michigan consumer expectation and consumer sentiment data.
EUR/USD
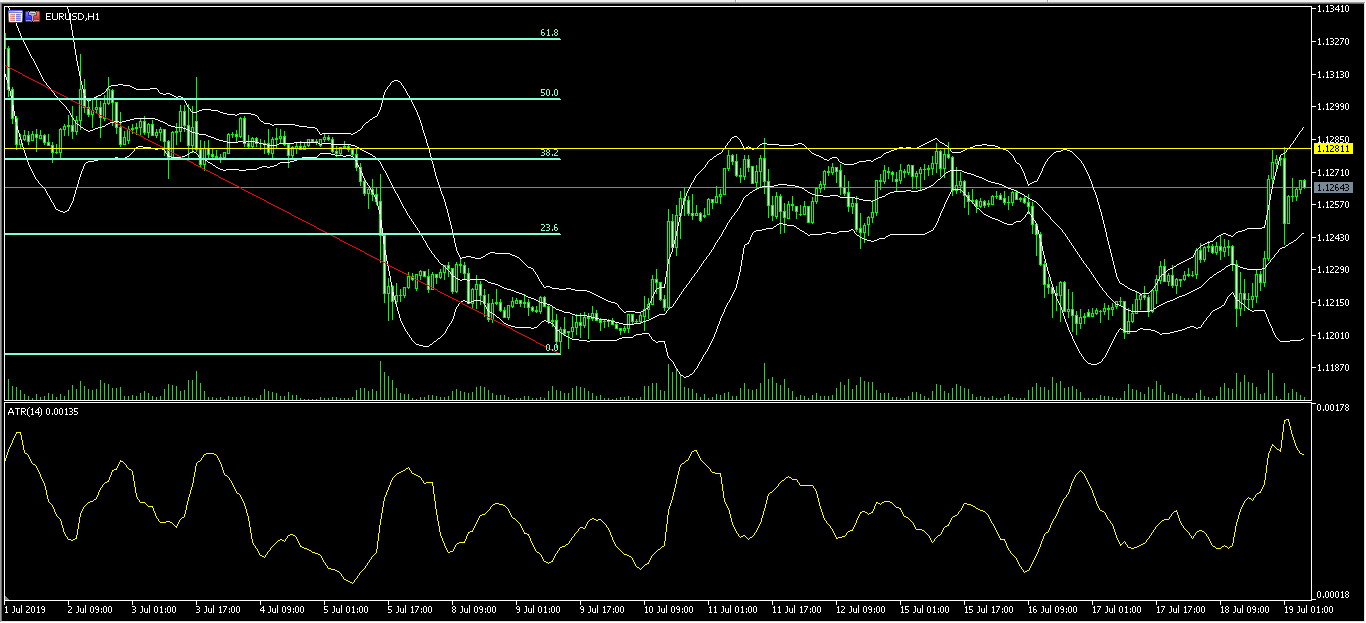
The EUR/USD was volatile in the American and Asian sessions. It first rose to a high of 1.1280, erased those gains and declined to a low of 1.1240 and then rose to the current level of 1.1265. On the hourly chart below, the Average True Range, which is used to measure volatility rose to the highest level this week. The current price is between the 23.6% and 38.2% Fibonacci Retracement level. The pair’s price is between the middle and the upper line of the Bollinger Bands. The pair will likely retest the previous resistance of 1.1280.
GBP/USD
The GBP/USD pair rose sharply as parliament tried a maneuver intended to avoid a no-deal Brexit. The pair is now trading at 1.2547, which is close to the highest level since July 15. The price is close to the 50% Fibonacci Retracement level. This price is above the 50-day and 25-day moving averages while the RSI remains at the overbought level of 70. The pair could continue to rally and test the 1.2600 in the next couple of days.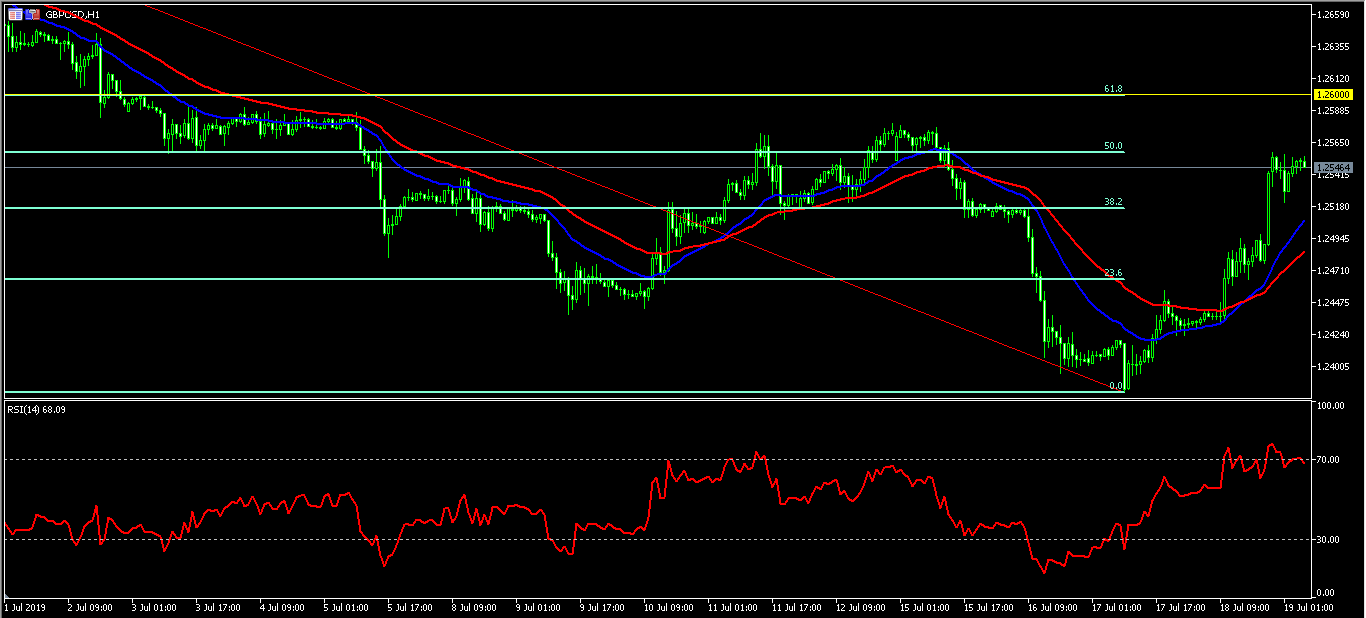
XBR/USD
The price of Brent crude oil rose sharply to a high of $62.80. On the hourly chart, the pair is above the 23.6% Fibonacci Retracement level. The price is along the 25-day exponential moving averages and slightly below the 50-day moving averages. The RSI has emerged from the oversold level to the current 48. The price is along the middle line of the Bollinger Bands. The pair will likely continue moving higher as gulf tensions rise.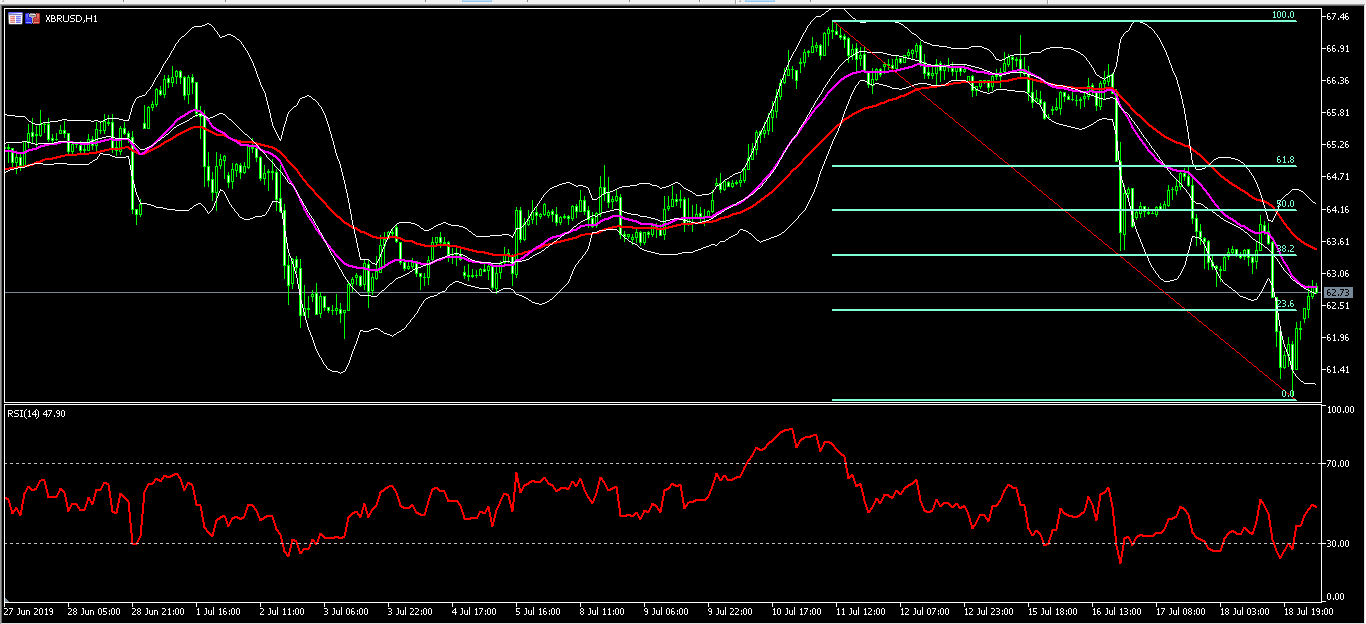
GBP/JPY Daily Outlook
Daily Pivots: (S1) 134.06; (P) 134.44; (R1) 135.04; More...
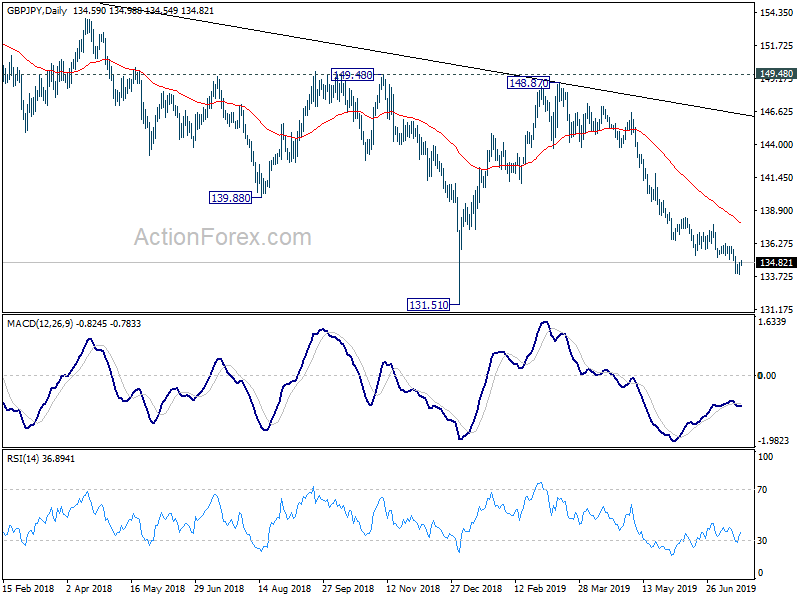
GBP/JPY is losing some downside momentum. But further decline is expected with 136.05 resistance intact. Current fall from 148.87 should target 131.51 low next. Though, break of 126.05 will indicate short term bottoming and bring stronger rebound to 137.78 resistance and above.
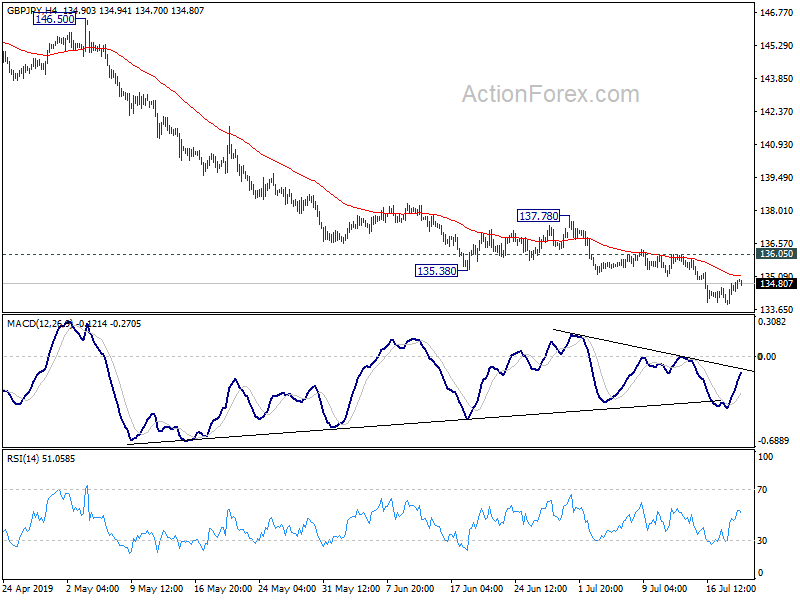
In the bigger picture, medium term fall from 156.59 (2018 high) is still in progress. Break of 131.51 will target 122.36 (2016 low). Structure of such decline is corrective looking so far, arguing that it's just the second leg of consolidation from 122.36. Thus, we'd expect strong support from 122.36 to contain downside to bring reversal.
EUR/JPY Daily Outlook
Daily Pivots: (S1) 120.77; (P) 121.01; (R1) 121.23; More....
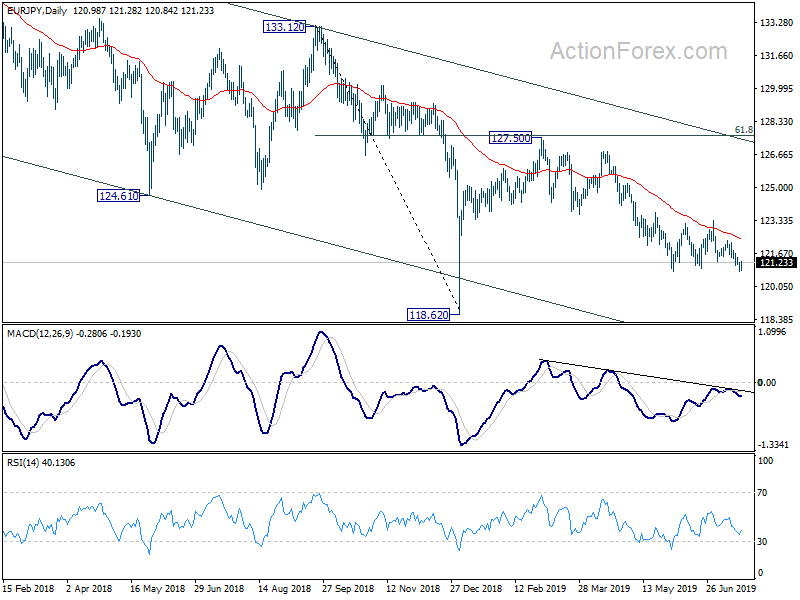
EUR/JPY lost downside momentum after hitting 120.78 and intraday bias is turned neutral first. on the downside, decisive break of 120.78 support resume fall from 127.50 to 118.62 low. In case of another rise as consolidation from 120.78 extends, upside should be limited by 123.73 resistance to bring fall resumption eventually.
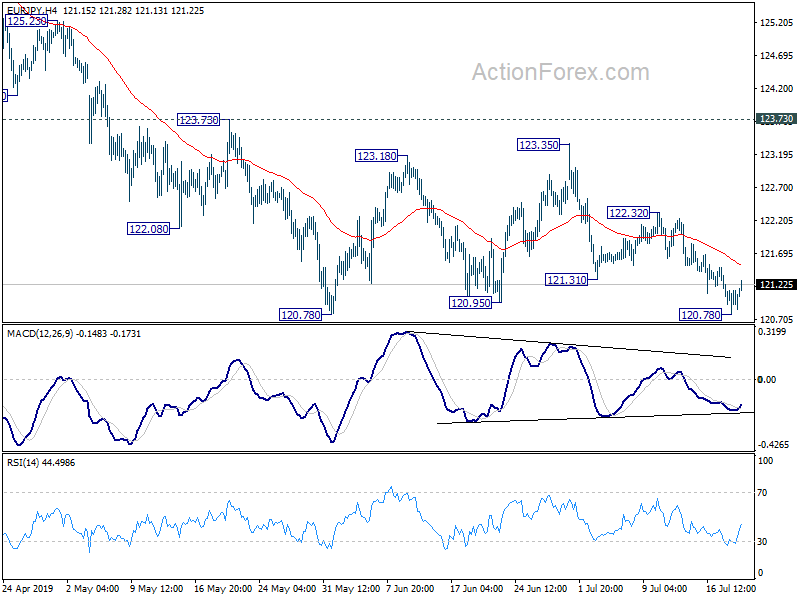
In the bigger picture, down trend from 137.49 is still in progress with the cross staying inside long term falling channel. Break of 118.62 will extend the fall to 109.48 (2016 low). On the upside, break of 127.50 resistance is needed to be the first sign of medium term reversal. Otherwise, outlook will remain bearish in case of strong rebound.
Cautious Fed Remarks Take The Wheels Off Dollar
- Dovish remarks by key Fed officials push greenback lower
- WTI crude oil at four-week low amid conflicting signals in US-Iran conflict
- Canadian retail sales and more Fed-speak dominate the agenda today
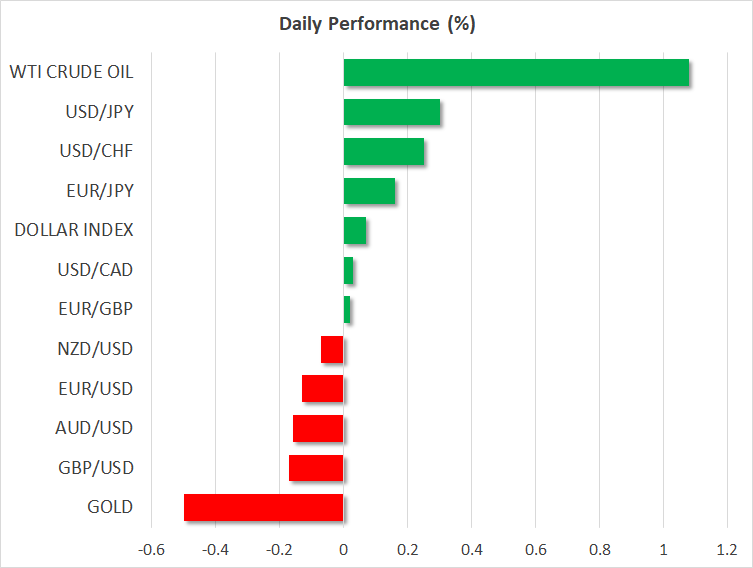
Fed’s Williams argues for preventive easing, sends dollar reeling
The greenback continues to attract all the attention, after two influential Fed officials fueled market expectations for an aggressive 50 basis points (bp) rate cut at the upcoming policy meeting. The move started after New York Fed President Williams said it’s better to cut rates preemptively rather than wait “for disaster to unfold”, a view that Vice Chairman Clarida echoed shortly thereafter.
Markets took this as a signal that the Fed will act with force in July and deliver easing that is over and above what is expected, sending the implied probability for a 50bp cut soaring. Accordingly, the dollar fell with US bond yields, as stocks and gold roared higher. Yet, in what seemed like an exercise in damage control, the New York Fed quickly came out to clarify that Williams’ speech was not a signal about July, but an “academic” view instead.
This is what lifted the dollar a little today – though it only retraced less than half of the drop and the probability for a ‘double’ 50bp cut in July now stands at ~43%, from ~35% yesterday. Overall, a 50bp move still seems excessive as the data aren’t weak enough for policymakers to spend so much of their limited rate ammunition so early, though this is admittedly becoming a more realistic prospect. For now, comments by the Fed’s Bullard (15:00 GMT) and Rosengren (20:30 GMT) today may be crucial in shaping this narrative.
Oil extends losses as Iran offers nuclear compromises
Crude prices fell on Thursday, albeit not massively, following news that Tehran offered a deal to accept enhanced inspections of its nuclear program if Washington lifts all sanctions. However, the optimism was soon tempered by news that the US Navy shot down an Iranian drone. Moreover, reports suggest that US officials are skeptical of Iran’s offer, and view it as a subtle effort to get sanctions relief without making real concessions.
While the situation remains tense and unpredictable, the fact that Iran is at least trying to explore the diplomatic route is encouraging in itself, and any more signs that tensions are easing could keep oil prices under pressure. Of course, the demand side – and specifically any developments in the US-China trade talks – will also be vital.
Canadian retail sales the only highlight today
Outside of the two Fed speakers, the only noteworthy event today will be the release of retail sales data out of Canada. The loonie has been contained in a narrow range lately, with lower oil prices pushing it down but a weaker US dollar providing counterbalance.
Likewise, while the market probability for a Bank of Canada (BoC) rate cut by December has jumped to ~53%, dollar/loonie continues to trade near its lowest levels this year, as Fed rate-cut expectations have soared by even more. Overall, as long as the Fed-BoC policy divergence narrative holds, the outlook for the loonie remains positive – though a lot will also depend on oil prices.
EUR/GBP Daily Outlook
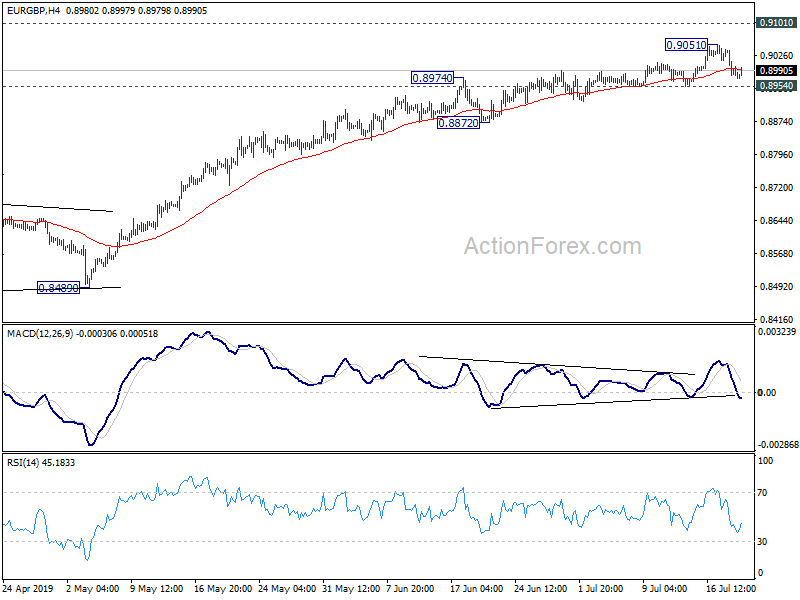
Daily Pivots: (S1) 0.8964; (P) 0.9002; (R1) 0.9024; More...
Intraday bias in EUR/GBP stays neutral for the moment. Further rise cannot be ruled out with 0.9854 support intact. But we'd be cautious on topping below 0.9101. On the downside, break of 0.8954 support will indicate short term topping. In this case, deeper pull back could be seen to 55 day EMA (now at 0.8875) first.
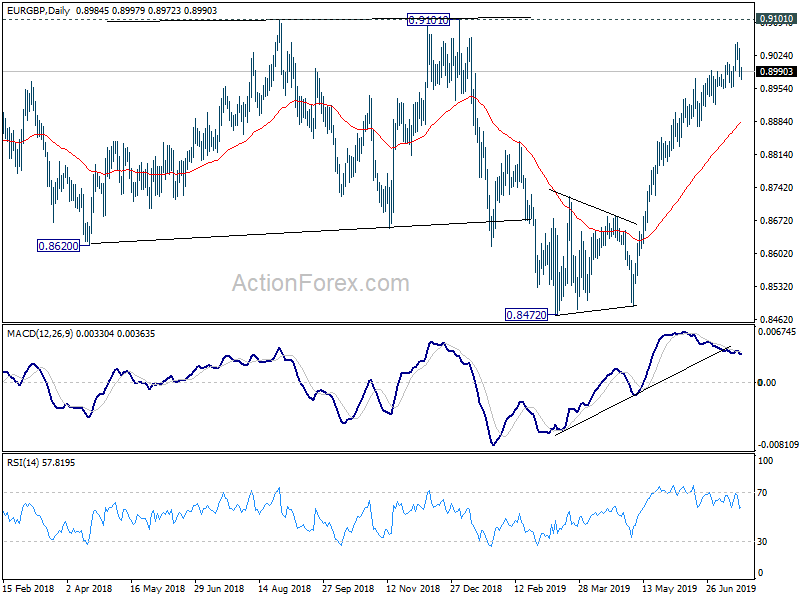
In the bigger picture, medium term decline from 0.9305 (2017 high) is seen as a corrective move. No change in this view. Current development argues that it might have completed with three waves down to 0.8472, just ahead of 38.2% retracement of 0.6935 (2015 low) to 0.9306 at 0.8400, after hitting 55 month EMA (now at 0.8545). Decisive break of 0.9101 resistance will confirm this bullish case. Nevertheless, as EUR/GBP is still staying inside long term falling channel, correction from 0.9305 could still extend to 0.8400 fibonacci level before completion, if upside is rejected by 0.9101.
GBPJPY Shows Signs Of Fading Descending Move, Indicators Increase
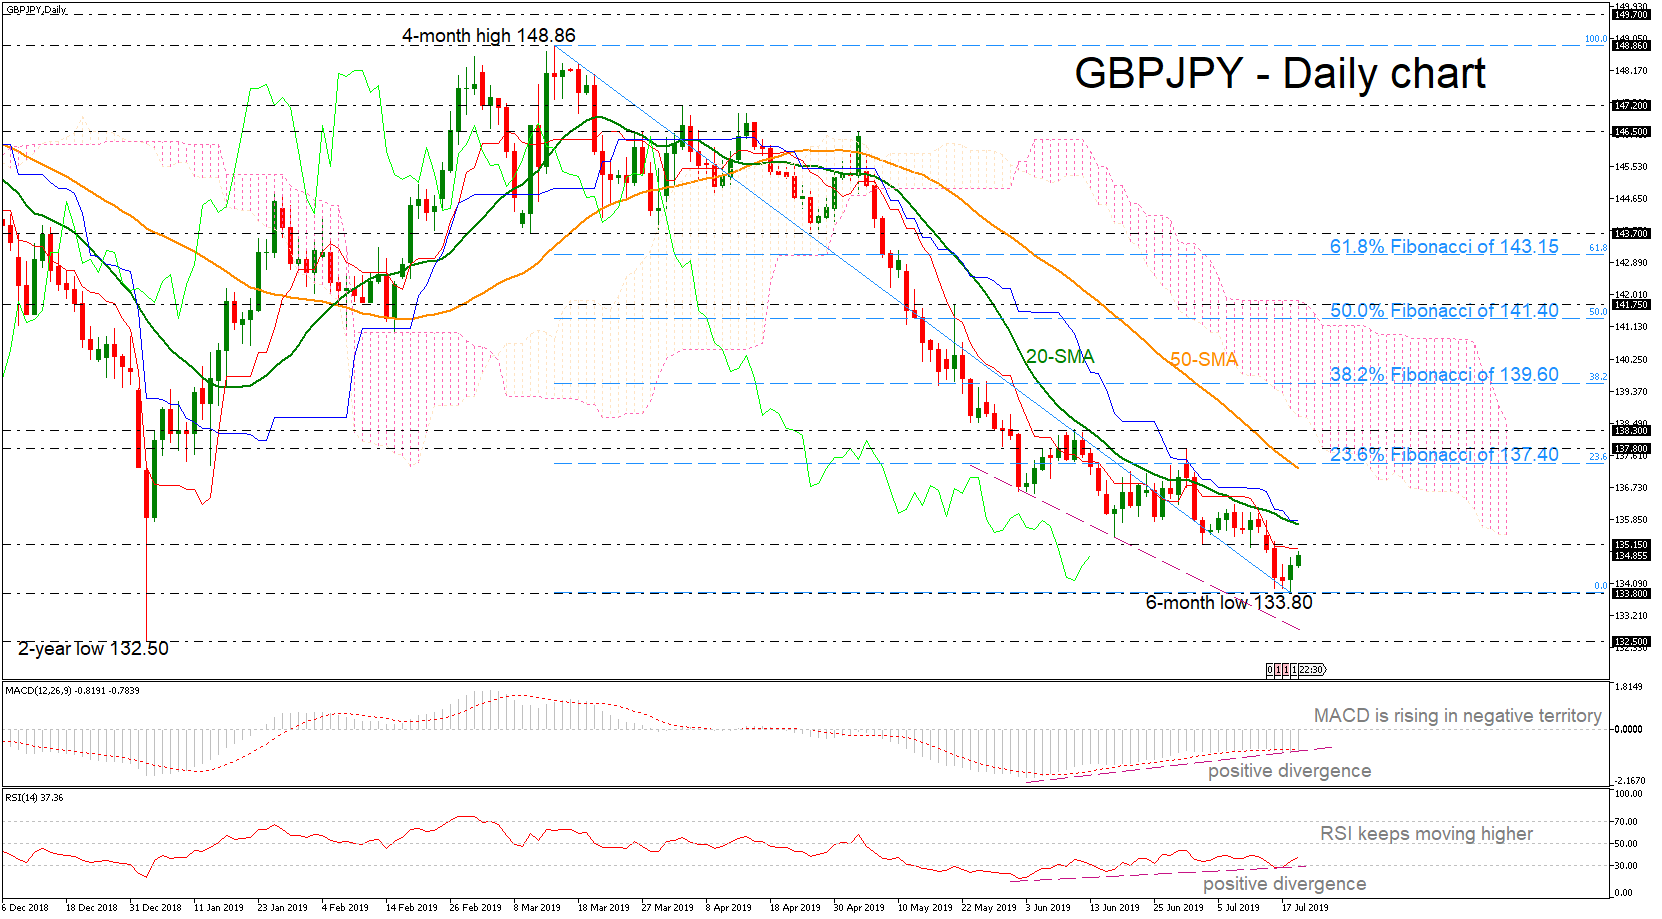
GBPJPY is still facing signs of a fading descending move as the RSI and the MACD keep moving higher, posting a positive divergence at a time when price seems to be edging lower in the daily timeframe. Currently, the pair is finding strong resistance at the red Tenkan-sen line of the Ichimoku cloud after it recorded a new six-month low of 133.80 on Thursday.
In case of an end of the bearish structure, the price needs to complete a strong upside rally until the 135.15 immediate resistance and the 20-day simple moving average (SMA) currently at 135.70. A run towards and above the 23.6% Fibonacci retracement level of the downward wave from 148.86 to 133.80 near 137.40, which coincides with the 50-SMA could open the door for a neutral bias around the 137.80 – 138.30 resistance zone. Positive momentum could come only if the price surpasses the Ichimoku cloud and the 61.8% Fibonacci of 143.15.
Should the market finish a day comfortably below the 133.80 region this could endorse the negative attitude again and prices could reach the two-year low of 132.50. A violation of this line would turn the spotlight to the 129.00 handle, taken from the inside swing top on November 2016.
Briefly, the technical indicators are suggesting the end of the downward move, though only a significant close above 143.15 could shift the negative status to positive.
USDCAD Death Cross Points To More Bearish Breakouts
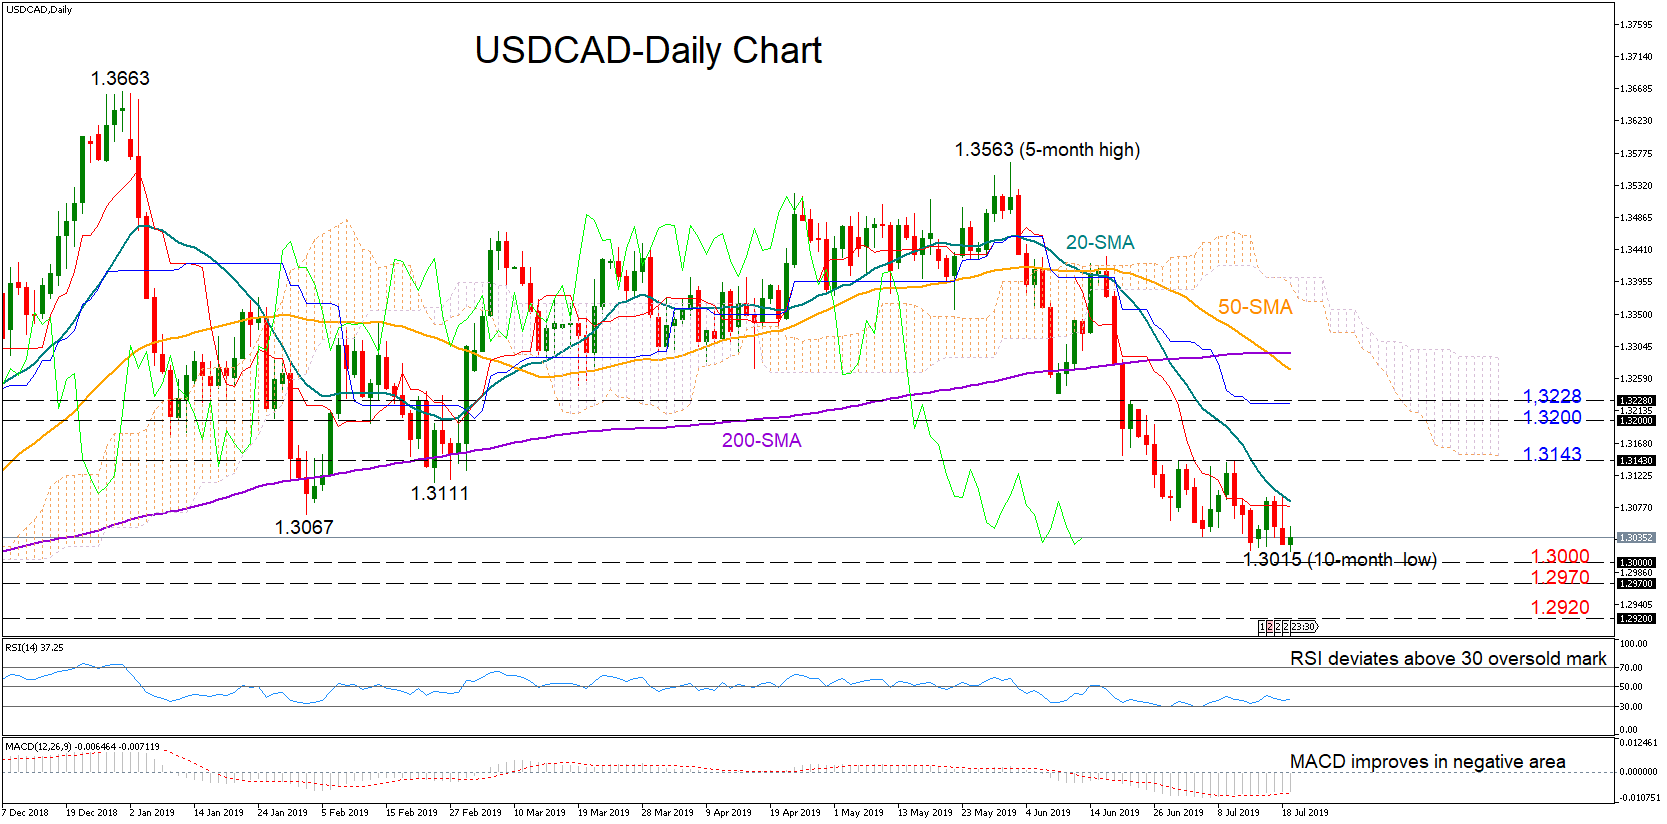
USDCAD experienced an uneventful week, moving sideways between the 20-day simple moving average (SMA) and its new ten-month low of 1.3015. In Ichimoku indicators, the red Tenkan-sen is flattening well below the blue Kijun-sen, while the RSI and the MACD keep gaining ground in the bearish territory, all signaling a neutral bias for the short-term.
The 20-day SMA at 1.3084 could act as immediate resistance if the price corrects to the upside. Breaking that line, the bullish action may likely continue until the previous highs around 1.3143, while higher the pair could begin a rally towards the 1.3200-1.3228 area.
In the negative scenario, where the price closes decisively below the 1.3000-1.2970 zone, negative momentum could accelerate towards the 1.2920-1.2900 former resistance region before the focus shifts to the 1.2800 psychological level.
Meanwhile in the medium-term picture, trend signals are flashing red as the death cross between the 50- and the 200-day SMAs – the first in two years – foresees the continuation of the downward pattern.
In brief, the short-term risk is currently viewed neutral, while in the medium-term, the sentiment seems to be turning even more bearish.
Dangerous Distortions In The Markets Due To Fed Softness
The President of the Federal Reserve Bank of New York (the most influential of the regional banks) noted on Thursday that policymakers should not wait for an economic disaster to hit before adding stimulus. Note that the comments of Fed members over the past two weeks have consistently strengthened confidence in mitigating the actions of the regulator.
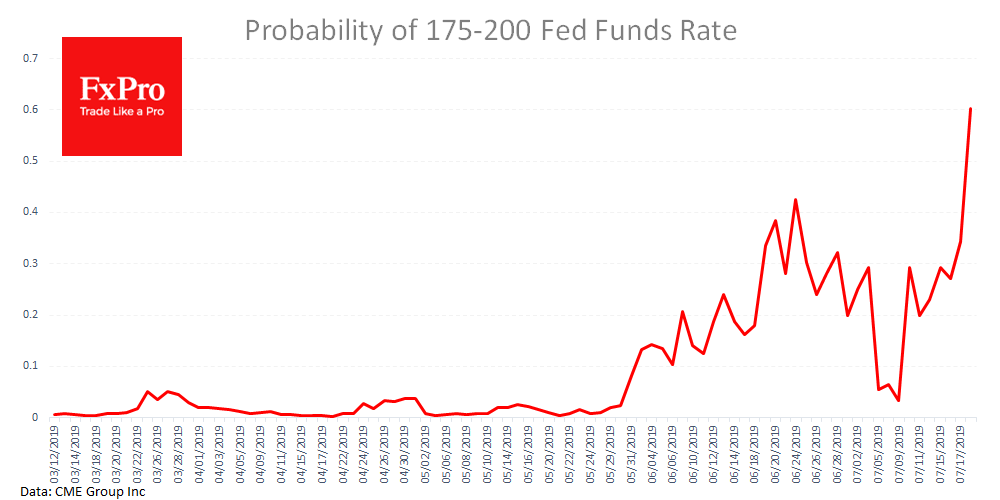
About a decade ago, the Fed was criticised for contributing to the formation of a real estate bubble, raising the rates “too little” and “too late.” The Reserve System, in its current composition, risks receiving a similar portion of criticism, choosing those indicators that cause concern. According to FedWatch, the markets quoted a 60% chance of reducing the rate by 50 points at once.
Prospects for lower rates caused the dollar sale, taking away 0.5% of its value overnight. The markets' mood for a quick resolution of this situation creates a new stage in the 'hunt for yield’ – supporting the demand for "junk" bonds. In addition, it hinders the sale on the stock markets. Low rates and speculation around a possible new QE round fuel the purchase of risky assets, while bond yields are suppressed by central bank policies.
Stocks
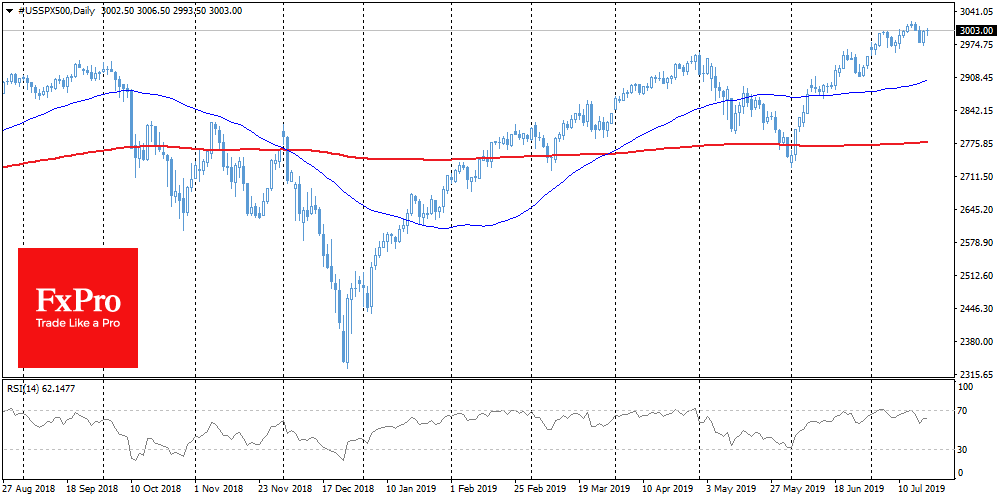
The SPX (futures on the S&P500) added 0.9% on Thursday and is above 3000 on Friday morning. The Nikkei225 adds 1.5% after four days of decline. Chinese stock indices rebounded from local lows.
EURUSD
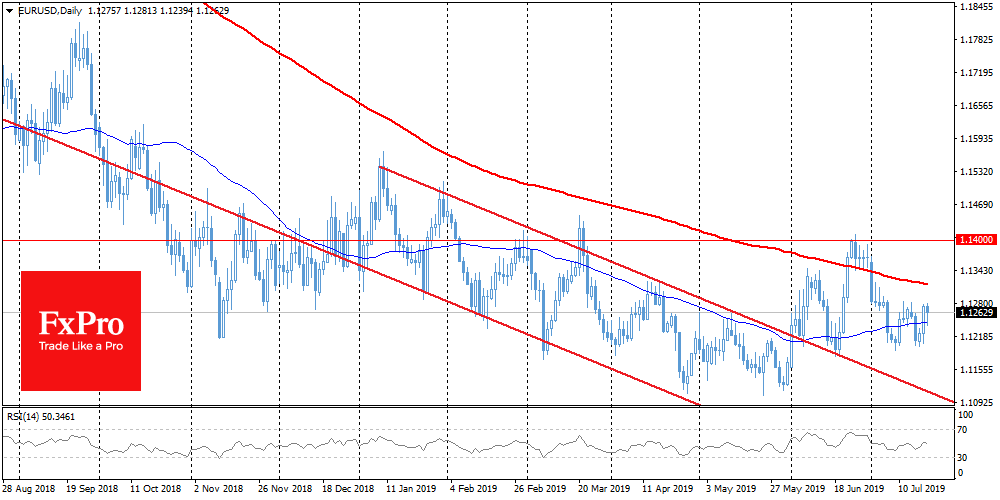
The single currency experienced a growth momentum, returning to levels above 1.1250. However, it is worth being careful with the euro purchases in the coming days. The Fed gives clear signals of easing, just a week before the ECB meeting. This is a period of silence, when the central banks' representatives do not make speeches that could affect the monetary policy course. Yet, the European Central Bank is unlikely to hesitate with its portion of "dovish" comments. Most analysts expect to hear a clear hint of rate cuts already in September and some loosening at the end of July. However, without clear signals from the ECB, the euro receives virtual market support.
Gold
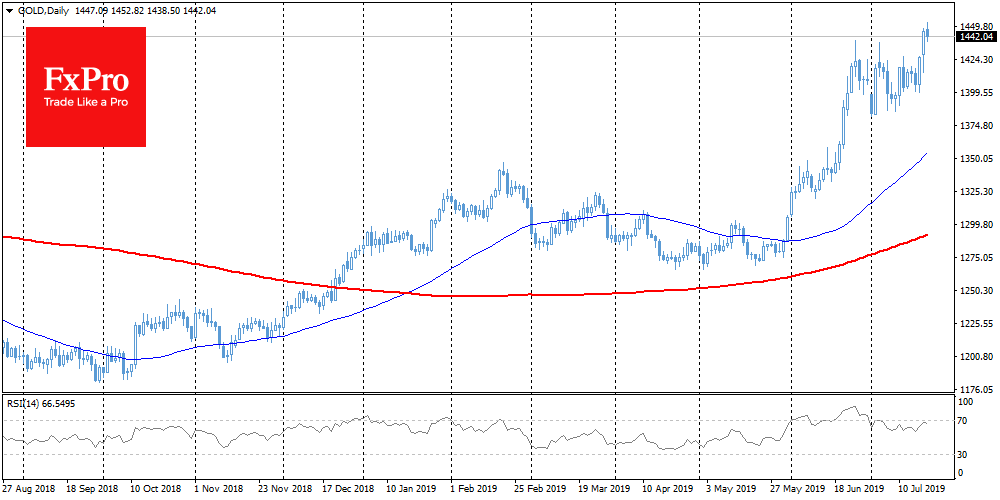
Gold completed a three-week consolidation by breaking through the upper limit of the trading range. As a result, quotes rose to 1.450, updating 6-year highs. The FxPro Analyst Team mention that gold may receive strong support through a softer monetary policy, if the economy maintains the growth.
EUR/AUD Daily Outlook
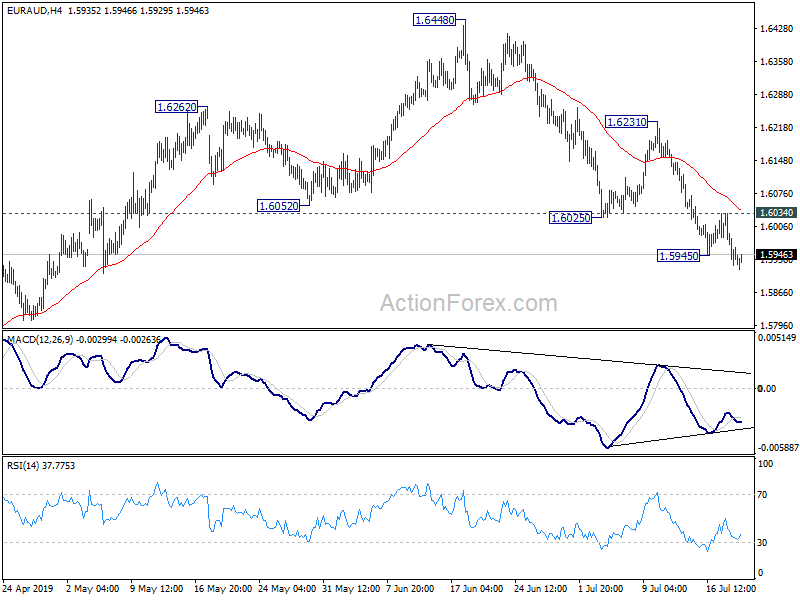
Daily Pivots: (S1) 1.5896; (P) 1.5966; (R1) 1.6008; More...
EUR/AUD's fall resumed after brief consolidation and intraday bias is back on the downside. Current decline from 1.6448 is seen as the third leg of the consolidation pattern from 1.6765 high. Deeper fall should be seen to 1.5683 support and below. On the upside, above 1.6034 minor resistance will turn intraday bias neutral again first.
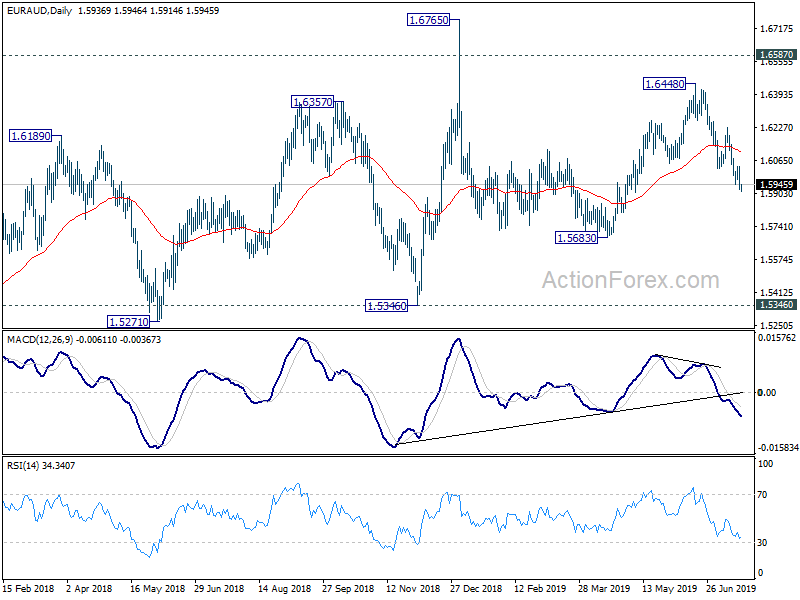
In the bigger picture, as long as 1.5346 support holds, outlook will still remain bullish. Up trend from 1.1602 (2012 low) is expected to resume sooner or later. Break of 1.6765 will target 61.8% retracement of 2.1127 (2008 high) to 1.1602 at 1.7488 next. However, firm break of 1.5346 key support will indicate trend reversal and turn outlook bearish.
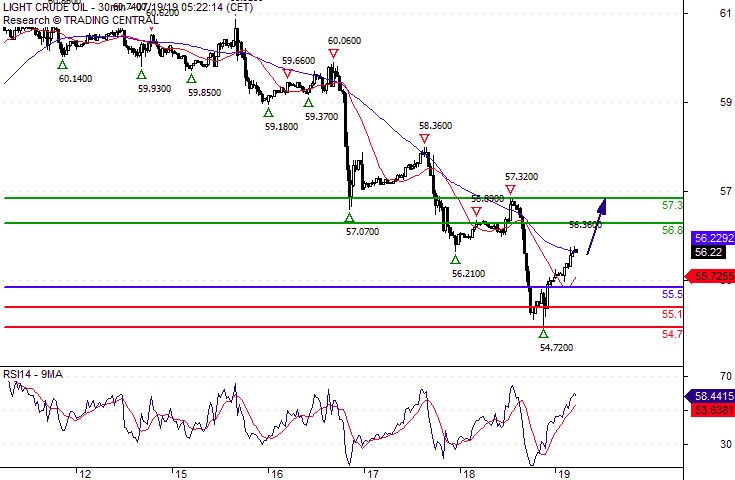
Crude Oil Turning Up
Pivot (invalidation): 55.50
Our preference Long positions above 55.50 with targets at 56.80 & 57.30 in extension.
Alternative scenario Below 55.50 look for further downside with 55.10 & 54.70 as targets.
Comment The RSI is bullish and calls for further advance.