

Sample Category Title
Aussie Extends Its Gains In The Asian Session
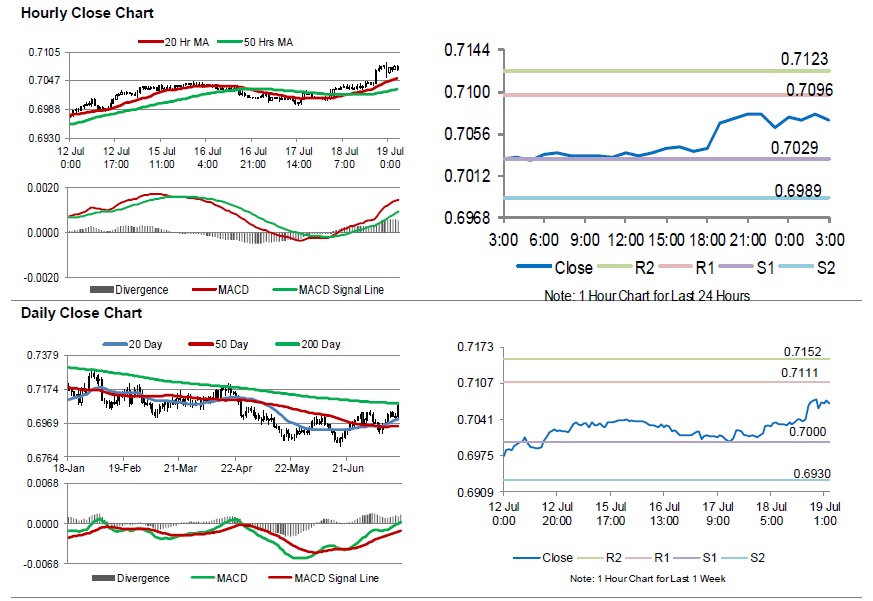
For the 24 hours to 23:00 GMT, the AUD rose 0.74% against the USD and closed at 0.7062.
LME Copper prices rose 0.4% or $26.0/MT to $5948.0/MT. Aluminium prices rose 0.5% or $8.5/MT to $1827.5/MT.
In the Asian session, at GMT0300, the pair is trading at 0.7070, with the AUD trading 0.11% higher against the USD from yesterday’s close.
The pair is expected to find support at 0.7029, and a fall through could take it to the next support level of 0.6989. The pair is expected to find its first resistance at 0.7096, and a rise through could take it to the next resistance level of 0.7123.
Looking ahead, traders would await Australia’s CBA manufacturing and services PMI’s set to release next week.
The currency pair is trading above its 20 Hr and 50 Hr moving averages.
Gold: Yellow Metal Reverses Its Gains In The Asian Session
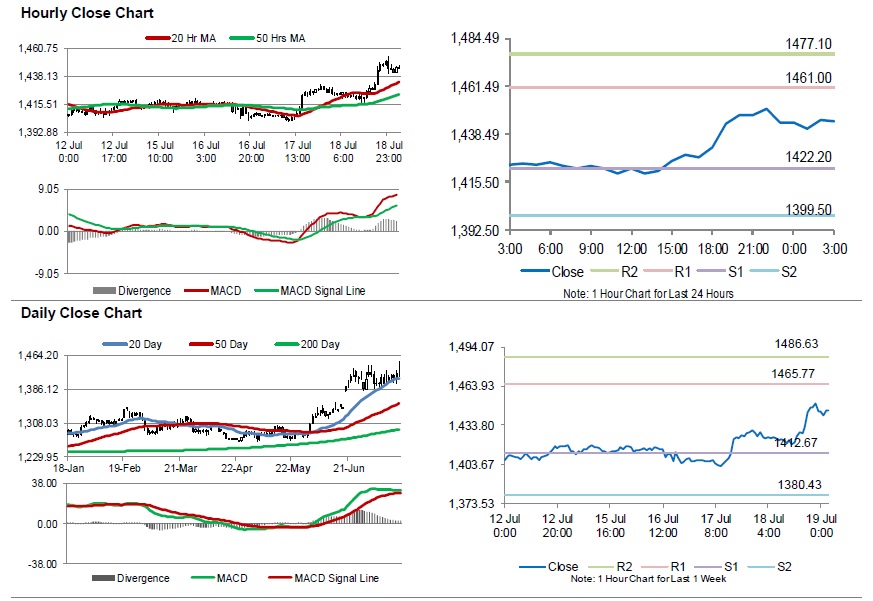
For the 24 hours to 23:00 GMT, Gold rose 1.62% against the USD and closed at USD1450.60 per ounce, amid broad weakness in the US dollar.
In the Asian session, at GMT0300, the pair is trading at 1444.90, with gold trading 0.39% lower against the USD from yesterday’s close.
The pair is expected to find support at 1422.20, and a fall through could take it to the next support level of 1399.50. The pair is expected to find its first resistance at 1461.00, and a rise through could take it to the next resistance level of 1477.10.
The yellow metal is trading above its 20 Hr and 50 Hr moving averages.
Silver: White Metal Trading On A Stronger Footing This Morning
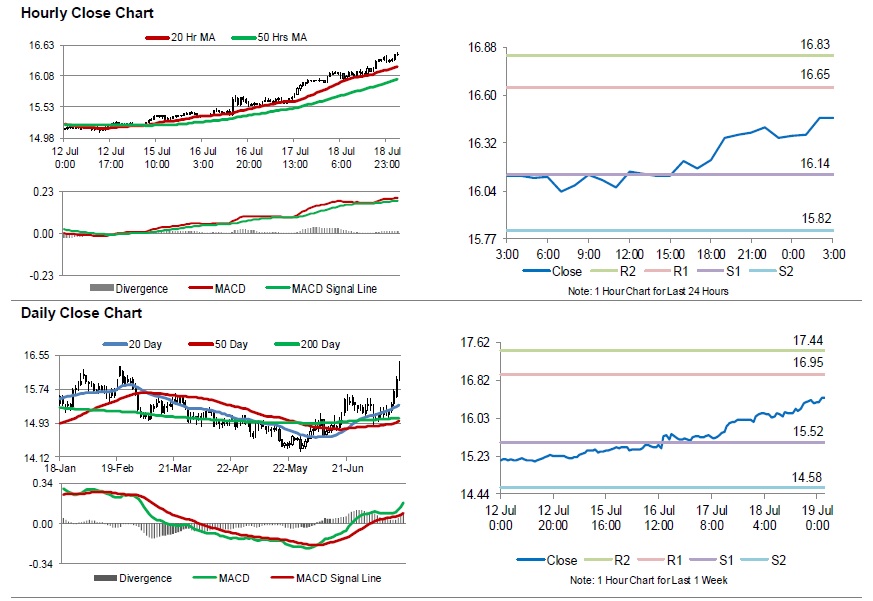
For the 24 hours to 23:00 GMT, Silver rose 2.16% against the USD and closed at USD16.35 per ounce, supported by gains in gold prices.
In the Asian session, at GMT0300, the pair is trading at 16.47, with silver trading 0.70% higher against the USD from yesterday’s close.
The pair is expected to find support at 16.14, and a fall through could take it to the next support level of 15.82. The pair is expected to find its first resistance at 16.65, and a rise through could take it to the next resistance level of 16.83.
The white metal is trading above its 20 Hr and 50 Hr moving averages.
Crude Oil: Oil Trading Higher, Ahead Of Baker Hughes Weekly Rig Count Data
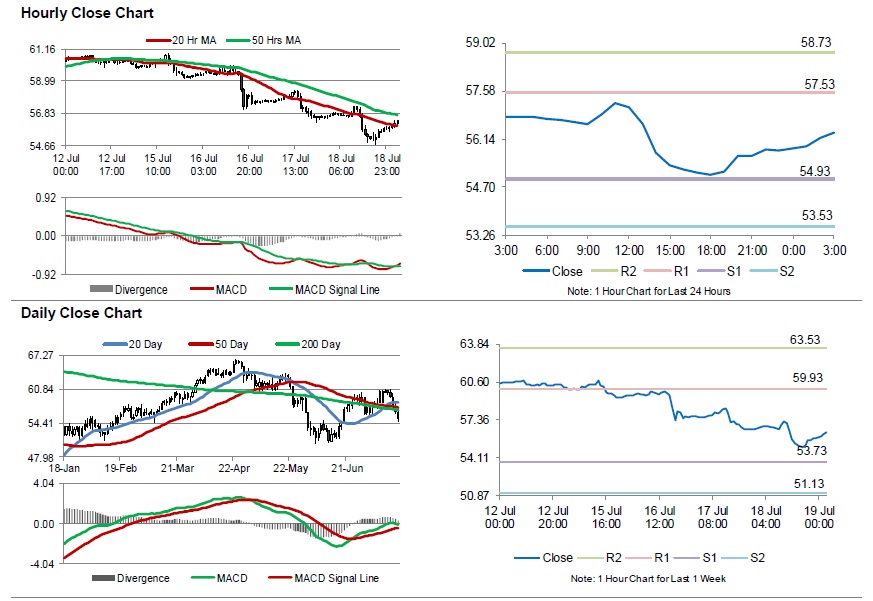
For the 24 hours to 23:00 GMT, Crude Oil declined 1.40% against the USD and closed at USD55.80 per barrel, amid expectations of rise in crude oil production from the US Gulf of Mexico region.
In the Asian session, at GMT0300, the pair is trading at 56.34, with oil trading 0.97% higher against the USD from yesterday’s close, amid renewed tensions in the Middle East, after the US Navy destroyed an Iranian drone in the Strait of Hormuz.
The pair is expected to find support at 54.93, and a fall through could take it to the next support level of 53.53. The pair is expected to find its first resistance at 57.53, and a rise through could take it to the next resistance level of 58.73.
Crude oil is trading between its 20 Hr and 50 Hr moving averages.
Gold Hits 6-Year High On Heightened Middle East Tensions
Safe havens and a weaker dollar
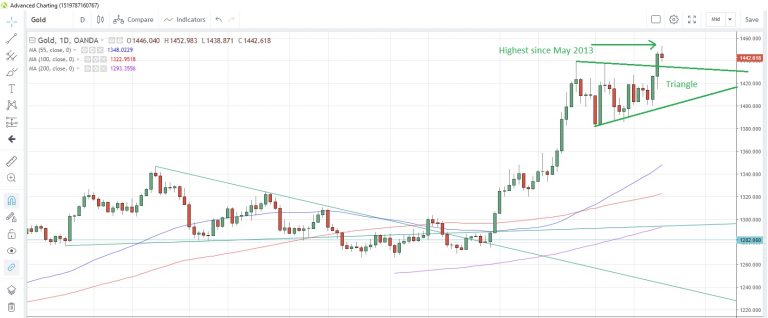
Gold extended its recent rally to a third day in Asia, advancing to the highest since May 2013 in early trading. An escalation in tensions in the Middle East yesterday fuelled gold’s breakout from a triangle pattern that had been forming since June 25.
In addition, the uber-dovish comments from Fed’s Williams yesterday increased speculation of a deeper 50bps rate cut at this month’s meeting, which put pressure on the US dollar to the benefit of the precious metal.
Gold Daily Chart
Williams clarifies comments
Yesterday's comments, which raised the probability of a 50 bps rate cut to 40% from 35% the previous day, were clarified by a spokesperson earlier this morning, who said that the comments were not about potential policy action, but more an academic speech on 20 years of research.
As a result, gold reversed its early advance to trade in the red as the dollar regained some ground.
Equities continue higher
Equity indices all traded higher this morning, seemingly immune to the escalation in tensions in the Gulf and the clarification of Williams's comments. US indices rose between 0.11% and 0.23% while China shares climbed 0.95%. Hong Kong shares out-performed with gains of 1.26%.
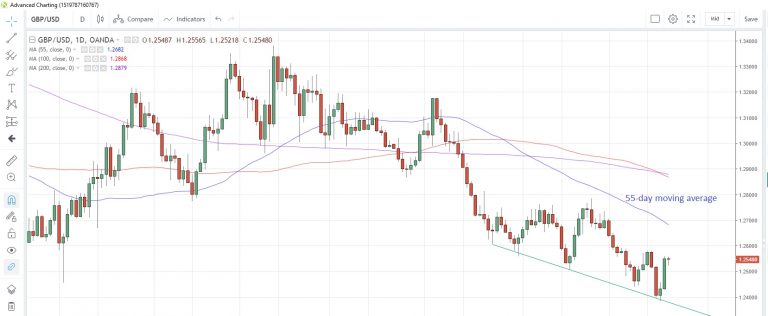
Currencies traded a bit more conservatively, with AUD/USD falling a modest 0.12% to 0.7066, USD/JPY rising 0.21% to 107.53 while EUR/USD slid 0.13% to 1.1262. GBP/USD consolidated yesterday's big gains, the most since May 3, but still faces losses on the week.
GBP/USD Daily Chart
A quiet end to the week
The data calendar winds down quite rapidly into the weekend, with June German producer prices and the Euro-zone current account balance for May the main events on the European slate. Producer prices are expected to fall 0.2% m/m and gain 1.4% y/y, both of which are lower than the previous month.
The North American session features Canada's retail sales data for May, with a mild increase from +0.1% m/m to +0.3% m/m seen. July's US Michigan consumer sentiment index for July probably improved to 98.5 from 98.2, the latest survey shows, but yesterday's massive beat by the Philadelphia Fed index could imply an even better number. A speech from Fed's Bullard rounds off the week.
Japan CPI core slowed to 0.6%, lowest since July 2017
Japan CPI core (ex-fresh food) slowed to 0.6% yoy in June, down from 0.8% yoy and matched expectations. All items CPI was unchanged at 0.7% yoy, while CPI core-core (ex-fresh food and energy) was also unchanged at 0.5% yoy.
CPI core was the lowest reading since July 2017. No turnaround is expected in the near term. Instead, CPI core could be further dragged down by policy related factors, including mobile phone charges and education costs.
The dim inflation outlook highlights the pressure for BoJ to ramp up monetary stimulus. In particular, both Fed and ECB are expected to loosen up policy again later this week.
Fed Clarida: Don’t wait until data turns decisively before cutting rates
Fed Vice Chair Richard Clarida also reinforced New York Fed President John Williams' dovish comments. Clarida told Fox Business Network that "you don't need to wait until things get so bad to have a dramatic series of rate cuts." And, "you don't want to wait until data turns decisively if you can afford to."
Clarida reiterated that the US economy is "in a good place". But "we've had mixed data" and "disinflationary pressures, if anything, are more intense than I thought six weeks ago." He added, "we need to make a decision based on where we think the economy may be heading and, importantly, where the risks to the economy are lined up."
Bet on 50bps Fed cut surged after New York Fed Williams’ comments
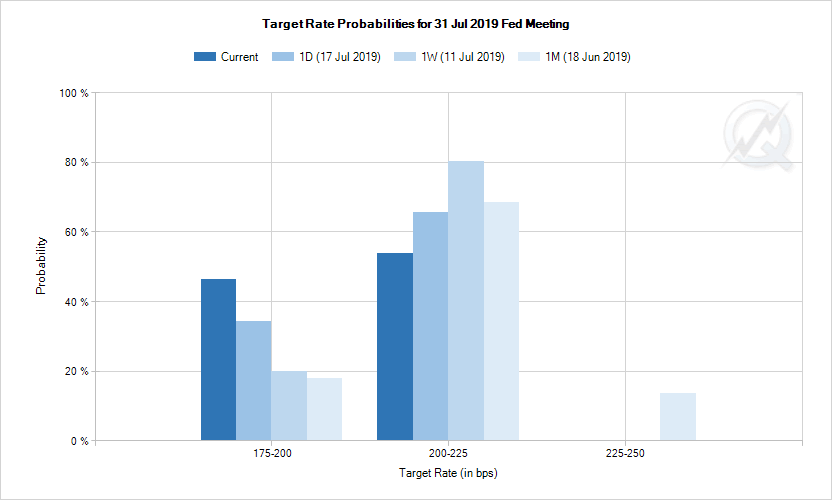
Dollar tumbled broadly as markets took New York Fed President John William's speech as indication of aggressive rate cut in the upcoming FOMC meeting on July 31. Fed fund futures now indicate 46.2% chance of -50bps cut, comparing to 34.3% a day ago and 19.9% a week ago. Overall, markets are still pricing 100% chance of easing then.
Williams said in a speech "Living Life Near the ZLB" (Zero Lower Bound), that when interest rates are in the vicinity of the ZLB, policymakers shouldn't "keep your powder dry". That is, they should "move more quickly to add monetary stimulus" to "vaccinate against further ills".
Also, he said "it's better to take preventative measures than to wait for disaster to unfold". And, "when you only have so much stimulus at your disposal, it pays to act quickly to lower rates at the first sign of economic distress."
Later, in an unusual step, a New York Fed spokesperson "clarified" Williams' comments. She said, "this was an academic speech on 20 years of research. It was not about potential policy actions at the upcoming FOMC meeting."
GOLD Price Rising While Crude Oil Price Struggling To Recover
Gold price remained in a positive zone and traded above the $1,420 and $1,430 resistance levels. Crude oil price declined recently and tested the key $55.00 support area.
Important Takeaways for Gold and Oil
- Gold price remained well supported above the $1,400 level and recently climbed higher against the US Dollar.
- There is a major bullish trend line forming with support near $1,430 on the hourly chart of gold.
- Crude oil price started a significant drop below the $58.00 and $57.00 support levels.
- There is a key bearish trend line forming with resistance near $57.20 on the hourly chart of XTI/USD.
Gold Price Technical Analysis
Gold price formed a strong support above the $1,400 level and consolidated for a few sessions against the US Dollar. Finally, the price started a fresh increase and broke the $1,410 and $1,420 resistance levels.
The upward move was strong as the price even broke the key $1,430 resistance area and settled above the 50 hourly simple moving average. Finally, there was break above the $1,445 and $1,450 resistance levels.
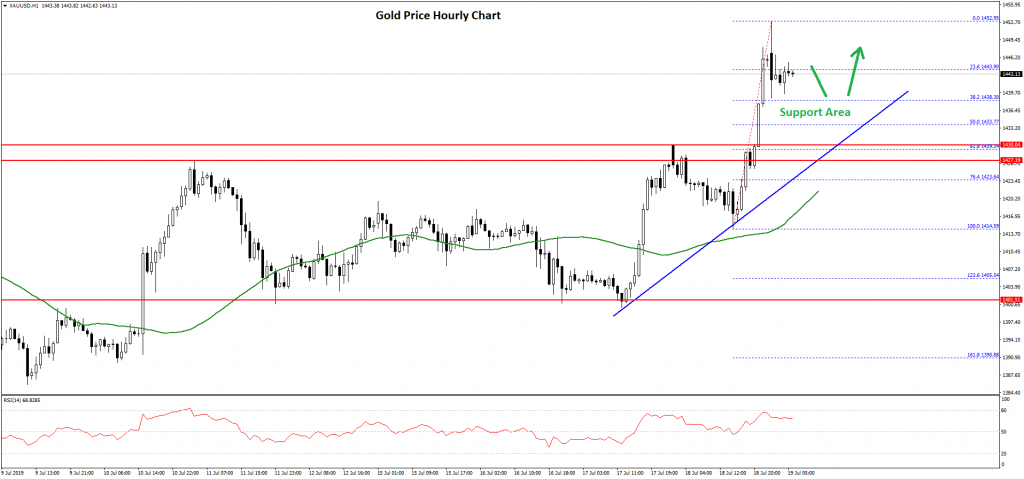
A swing high was formed near $1,452 on FXOpen and the price recently started a downside correction. It broke the $1,450 and $1,445 support levels. Moreover, there was a break below the 23.6% Fib retracement level of the recent wave from the $1,414 low to $1,452 high.
However, there are many supports on the downside near the $1,435 and $1,430 levels. Moreover, there is a major bullish trend line forming with support near $1,430 on the hourly chart of gold.
The trend line support is close to the 50% Fib retracement level of the recent wave from the $1,414 low to $1,452 high. Therefore, gold price is likely to find a strong buying interest above the $1,430 level in the near term.
On the upside, an initial resistance is near the $1,450 level. If there is an upside break above $1,450, the price could continue to rise above the $1,455 level in the near term.
Oil Price Technical Analysis
After struggling above the $60.50 level, crude oil price formed a top near the $61.00 level against the US Dollar. The price started a nasty decline and broke many supports near the $58.00 and $57.00 levels.
The decline was such that the price settled below the $58.00 support and 50 hourly simple moving average. It even broke the $56.00 support level and spiked below the $55.00 level.
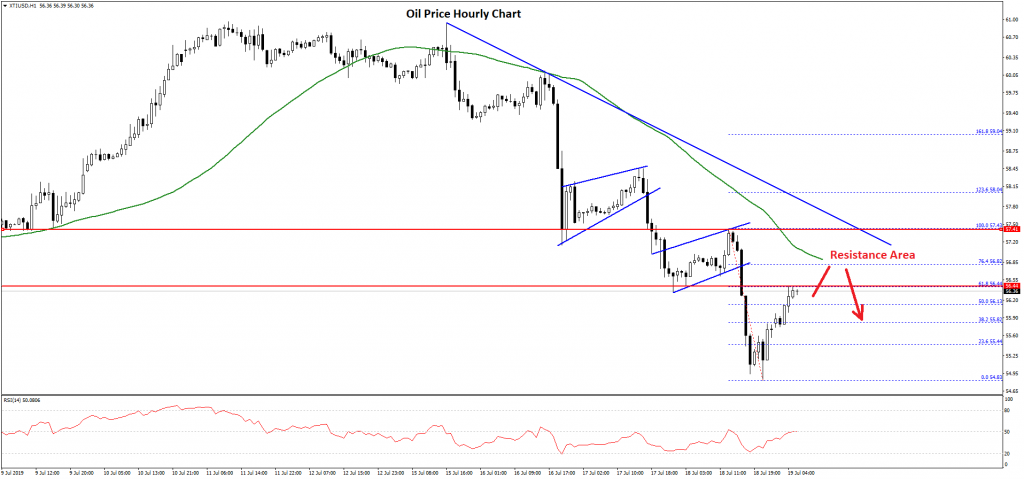
A swing low was formed near $54.80 and the price is currently correcting higher. The price broke the $55.50 resistance plus the 50% Fib retracement level of the recent decline from the $57.43 high to $54.83 low.
However, the price is facing a strong resistance near the $56.45 level. The 61.8% Fib retracement level of the recent decline from the $57.43 high to $54.83 low is also acting as a resistance.
Moreover, there is a key bearish trend line forming with resistance near $57.20 on the hourly chart of XTI/USD. Therefore, the price seems to be facing a lot of hurdles near the $56.80 and $57.00 levels.
On the downside, an immediate support is near the $55.80 level. If there are more losses, the price may move back towards the $55.00 support level in the near term.
USD/JPY Could Retest 107.00 Before Fresh Increase
Key Highlights
- The US Dollar struggled near 109.00 and declined below 108.00 against the Japanese Yen.
- USD/JPY traded below a major bullish trend line with support at 108.05 on the 4-hours.
- The US Initial Jobless Claims for the week ending July 13, 2019 increased from 208K to 216K.
- The Michigan Consumer Sentiment Index in July 2019 (Prelim) might increase from 98.2 to 98.5.
USDJPY Technical Analysis
The US Dollar failed to surpass the 109.00 resistance level against the Japanese Yen. As a result, the USD/JPY pair started a bearish wave and broke the 108.00 and 107.80 support levels.
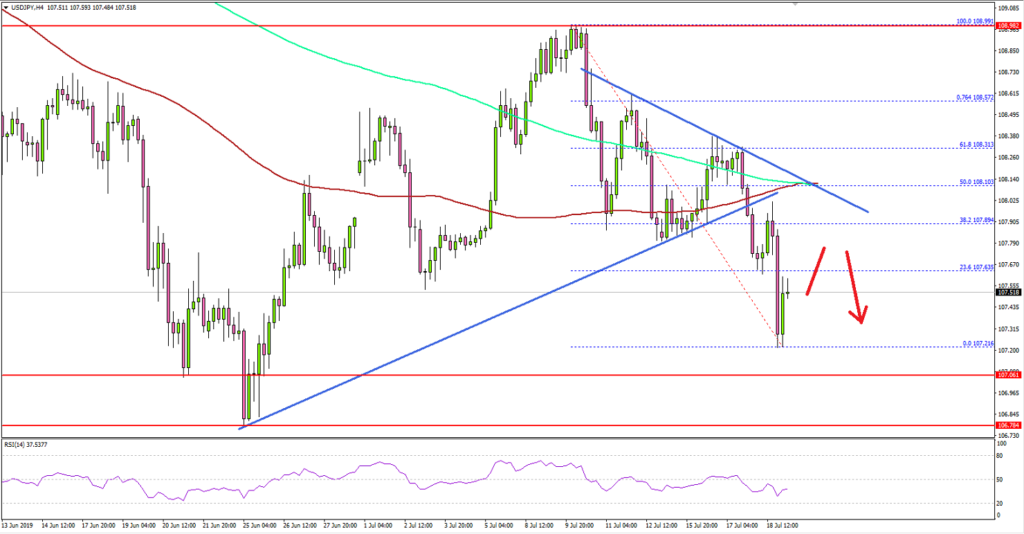
Looking at the 4-hours chart, the pair formed a top just below the 109.00 and recently started a significant downward move. The pair broke the 108.10 pivot level and settled below the 100 simple moving average (red, 4-hours).
Moreover, the pair traded below a major bullish trend line with support at 108.05. It opened the doors for more losses below 107.80 and 107.50.
A swing low was formed near 107.21 and the pair is currently correcting higher. An initial resistance is near the 107.60 level plus the 23.6% Fib retracement level of the downward move from the 108.99 high to 107.1 low.
However, the main resistance is near the 108.00 and 108.10 levels. Moreover, the 100 simple moving average (red, 4-hours) is also positioned near the 108.10 level to act as a strong resistance.
Therefore, upsides in USD/JPY could be capped near the 108.00 area and the pair might resume its decline below the 107.20 level in the near term. The next key supports are near 107.00 and 106.80.
Fundamentally, the US Initial Jobless Claims report for the week ending July 13, 2019 was released by the US Department of Labor. The market was looking for an increase in claims from 209K to 216K.
The actual result was similar to the forecast as the US Initial Jobless Claims increased to 216K. Besides, the last reading was revised from 209K to 208K.
The report added:
The previous week’s level was revised down by 1,000 from 209,000 to 208,000. The 4-week moving average was 218,750, a decrease of 250 from the previous week’s revised average. The previous week’s average was revised down by 250 from 219,250 to 219,000.
Overall, the US Dollar is correcting lower, resulting in a decent recovery in EUR/USD and GBP/USD.
Economic Releases to Watch Today
- Canadian Retail Sales May 2019 (MoM) – Forecast +0.3%, versus +0.1% previous.
- Canadian Retail Sales ex Autos May 2019 (MoM) – Forecast +0.4%, versus +0.1% previous.
- Michigan Consumer Sentiment Index July 2019 – Forecast 98.5, versus 98.2 previous.