Sample Category Title
AUD/USD Makes Brief Retracement
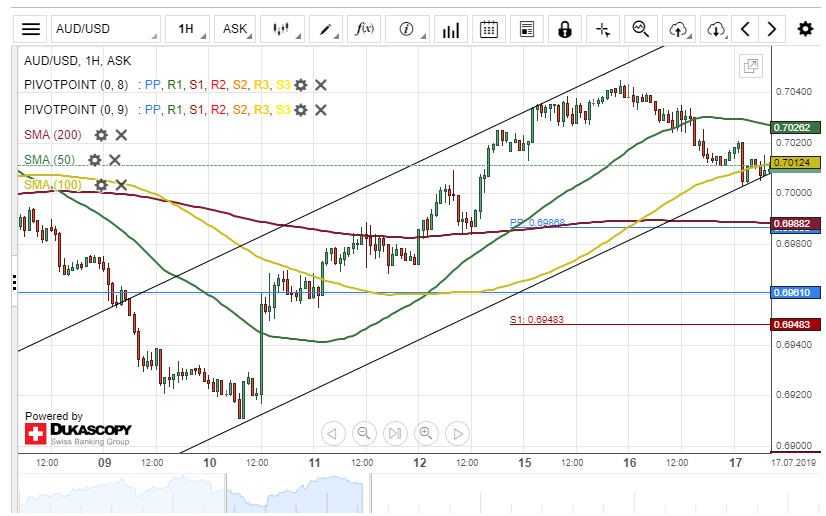
The Australian Dollar depreciated about 35 base points against the US Dollar on Tuesday. The decline could be considered to be a brief retracement from the upper boundary of an ascending channel pattern.
The exchange rate is currently testing a support level formed by the bottom border of the channel pattern and the 100-hour simple moving average near 0.7010.
If this support line holds, the currency exchange rate will continue its upside movement today.
However, if the AUD/USD pair breaks the ascending channel pattern, bearish traders could aim for the 0.6961 are within this session.
Eurozone CPI finalized at 1.3%, revised up, core CPI at 1.1%
Eurozone CPI was finalized at 1.3% yoy in June, revised up from 1.2%, up from May's 1.2% yoy. Core CPI was finalized at 1.1% yoy, unrevised, up from May's 0.8% yoy. EU 28 CPI was finalized at 1.6% yoy, stable compared to May.
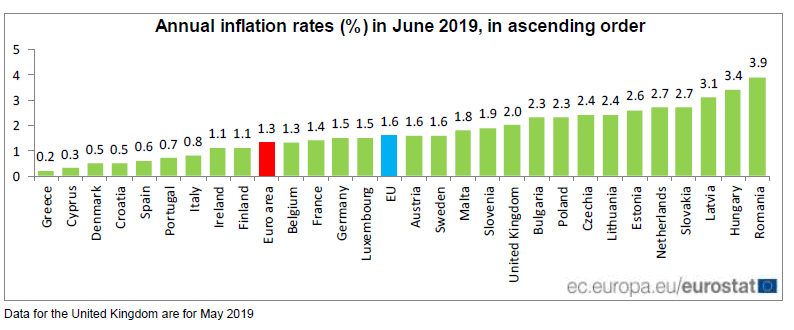
The lowest annual rates were registered in Greece (0.2%), Cyprus (0.3%), Denmark and Croatia (both 0.5%). The highest annual rates were recorded in Romania (3.9%), Hungary (3.4%) and Latvia (3.1%). Compared with May, annual inflation fell in seventeen Member States, remained stable in one and rose in nine.
In June, the highest contribution to the annual euro area inflation rate came from services (0.73%), followed by food, alcohol & tobacco (0.30%), energy (0.17%) and non-energy industrial goods (0.07%).
UK CPI unchanged at 2.0%, core CPI rose to 1.8%
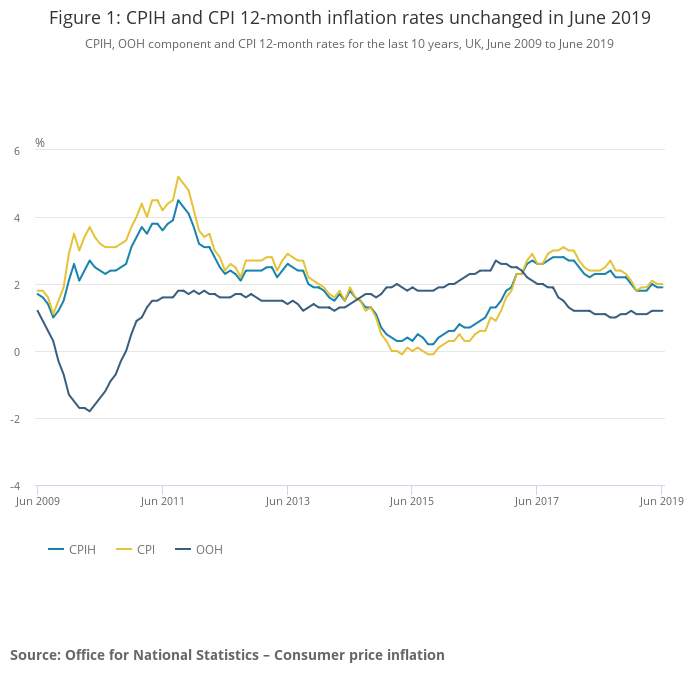
In June, UK headline CPI was unchanged at 2.0% yoy, matched expectations. Core CPI accelerated to 1.8% yoy, up from 1.7% yoy, matched expectations. RPI slowed to 2.9% yoy, down from 3.0% yoy, matched expectations. PPI input was at -1.4% mom, -0.3% yoy, versus expectation of -0.5% mom, 0.3% yoy. PPI output was at -0.1% mom, 1.6% yoy, versus expectation of 0.1% mom, 1.7% yoy. PPI output core was at 0.1% mom, 1.7% yoy, matched expectations.
In May, house price index rose 1.2% yoy, slowed from 1.5% yoy, versus expectation of 1.3% yoy.
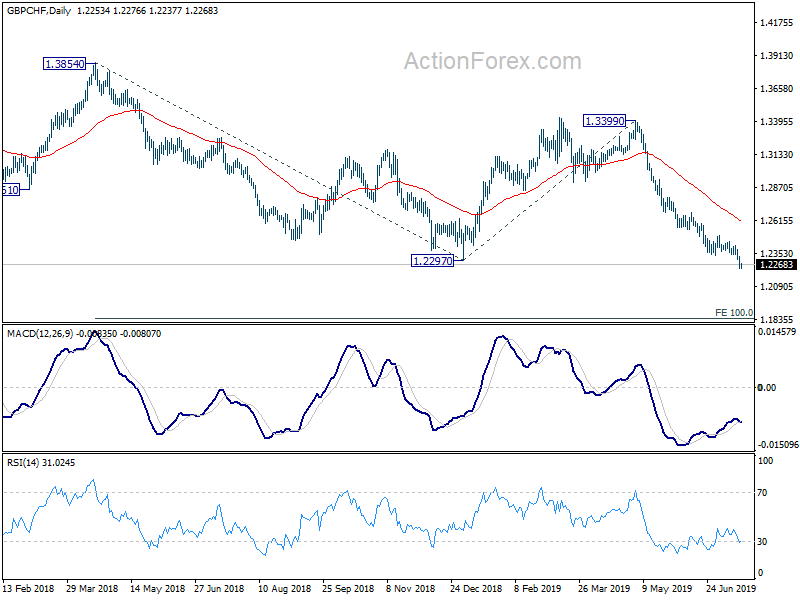
GBP/CHF's broke 1.2297 support yesterday and resumed down trend from1.3854. Further fall should be seen to 100% projection of 1.3854 to 1.2297 from 1.3399 at 1.1842 in medium term.
US Dollar Index Surpasses 50-Day SMA, Suggesting More Gains
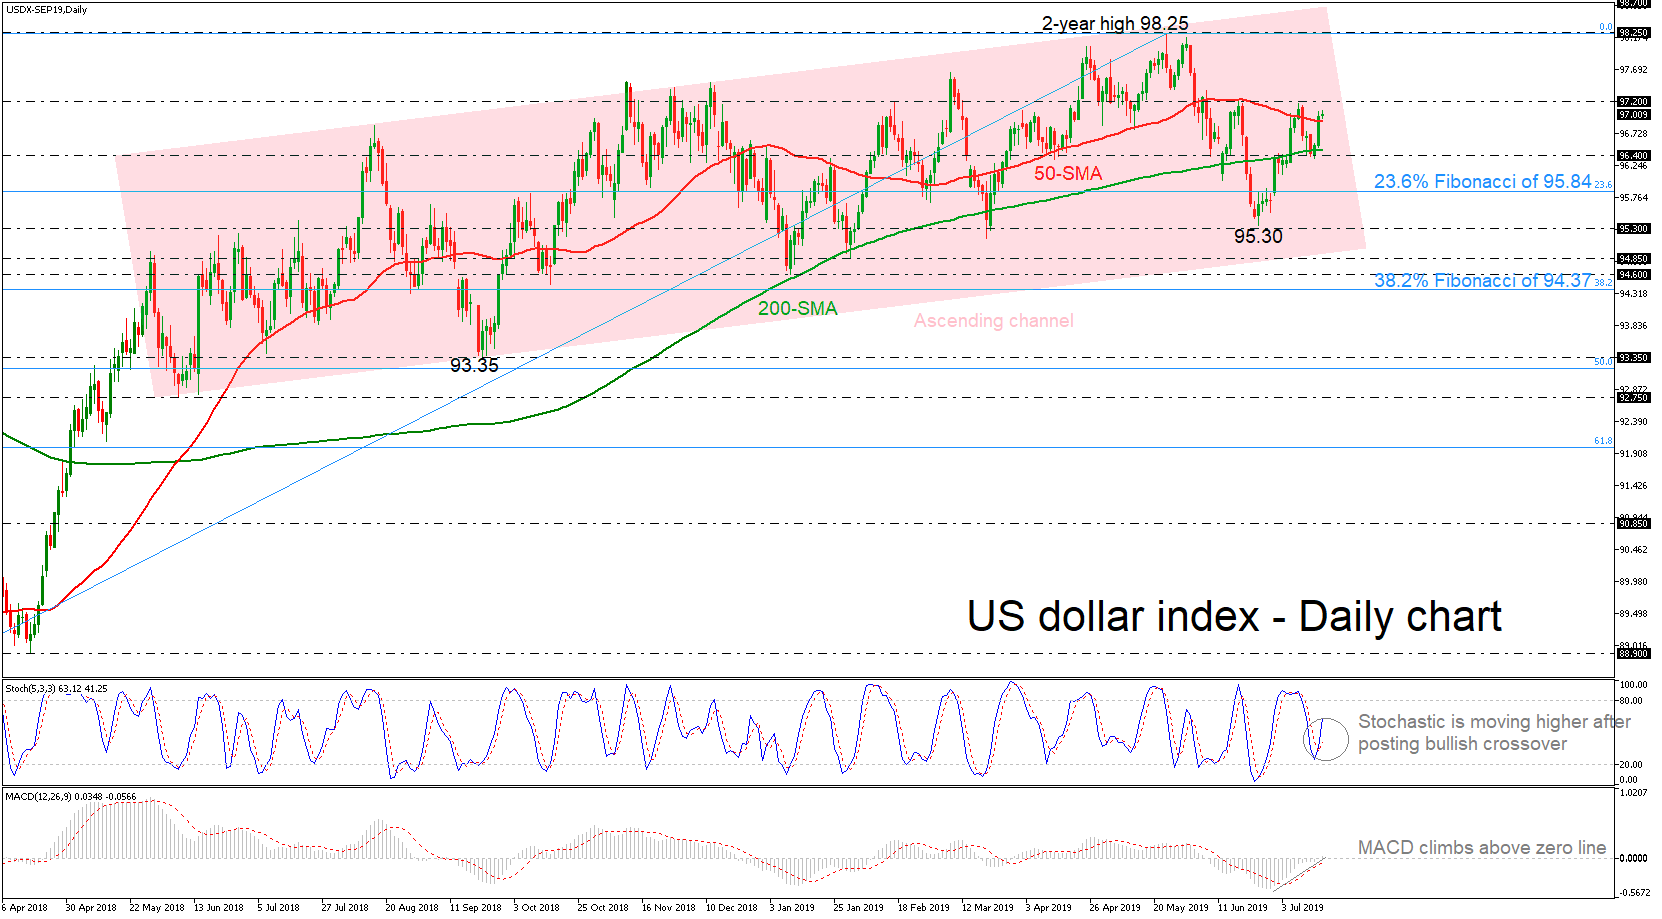
The US dollar index had a successful daily close above the 50-simple moving average (SMA) suggesting remarkable gains, during yesterday’s trading session. The stochastic oscillator is moving higher after it completed a bullish crossover within the %K and %D lines, while the MACD is trying to strengthen its bullish momentum above zero line.
Should the price stretch north and clear the 97.20 resistance, the two-year high of 98.25 could come in focus near 98.25. If the buying interest extends, attention could then turn to the 98.70 resistance barrier, taken from the minor low on March 2017.
On the flipside, in case of a failed attempt to clear the 50-SMA, prices would test the 96.40 support level, which stands near the 200-SMA. If traders continue to sell the index, the price could decline until the 23.6% Fibonacci retracement level of the upward movement from 88.10 to 98.25 near 95.84.
Summarizing, in the long-term, the market retains the bullish structure as it has been trading within an ascending sloping channel since June 2016 but in the short-term, traders need to wait for a jump above the 97.20 hurdle for positive orders again.
USD Firms On Favourable Data
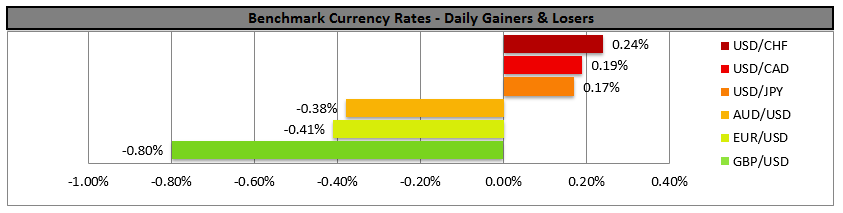
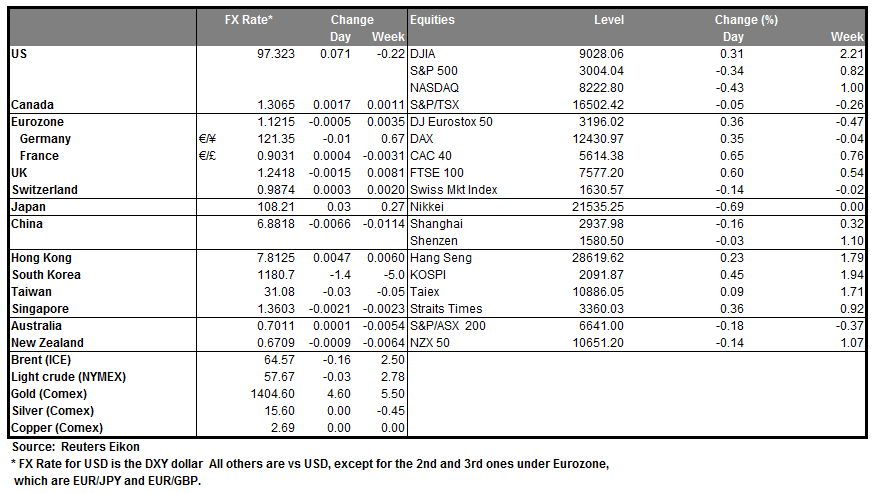
The greenback strengthened yesterday against a number of its counterparts as better than expected data was released from the US. The markets reacted favourably as the retail sales growth rates outperformed expectations last month and ignored the slowdown of the industrial output growth rate. The favourable data according to analysts, tamed concerns of the market for an aggressive monetary policy easing by the Fed. It should be noted that the USD may also have gained ground due to the current weakness of other currencies, such as the EUR and GBP. Characteristically the pound failed to strengthen, even as the employment data for May released yesterday, showed a tight UK labour market, while the EUR was also weakened due to increased pessimism of German investors. Please note that Fed Chairman Powell reiterated yesterday that the Fed will act as appropriate amid increased uncertainties. We expect that the Dollar may remain Fed driven in the coming days, albeit data may play also a significant role in its direction. EUR/USD dropped yesterday, breaking the 1.1220 (R1) support line, now turned to resistance. Our main scenario is for the pair to retain a rather sideways movement for today, however bearish tendencies could be again present for the pair. Should the pair come under the selling interest of the market once again, we could see the pair breaking the 1.1180 (S1) support line and aim for lower grounds. Should the pair’s long positions be favored by the market, we could see it breaking the 1.1220 (R1) resistance line and aim for the 1.1260 (R2) resistance level.
Oil prices drop heavily on Iran talks prospect
Oil prices dropped yesterday as news broke out that the US is about to start negotiations with Iran. A number of media reports cited U.S. Secretary of State Mike Pompeo as saying "for the first time" Iranian officials "are ready to negotiate on their missile program”. In addition, media also mentioned that Trump stated at a cabinet meeting, that the US had made progress with Tehran and did not wish war or regime change there, although he did "want them out of Yemen.“ On other news, the API weekly crude oil inventories show a substantially narrowed drawdown yesterday reaching -1.4 million barrels, albeit had little effect on oil prices. We expect the market to be closely watching today’s EIA release in order to indirectly confirm also the much-discussed increased US production levels. WTI prices dropped heavily yesterday, breaking consecutively the 59.50 (R1) and the 57.70 (S1) support line, albeit corrected higher than the latter later on. We could see the commodity’s prices drop lower today, especially should the prospect of the US-Persian talks be increased. Should the bears dictate WTI’s price direction, once again, we could see it breaking the 57.70 (S1) support line and aim for the 56.00 (S2) support level. On the other hand, should the bulls take over, we could see the commodity’s prices, aiming if not breaking the 59.50 (R1) resistance line aiming for higher grounds.
Other economic highlights, today and early tomorrow
Today, during the European session, we get UK’s main inflation measures for June and from the Eurozone the final CPI rate for June. In the American session, we get from the US the number of house starts as well as the EIA crude oil inventories figure for the past week, while form Canada we get the CPI rates for June. During tomorrow’s Asian session, we get Japan’s trade data for June and Australia’s employment data also for June. Please bear in mind that the G7 meeting is to begin tomorrow in Paris, France and on the agenda there is the issue of cryptocurrencies and cybersecurity. Given the recent concerns, expressed by various national authorities (including France, Japan and the US), we could see some delegates calling for stricter regulation of the cryptomarket, which could create some volatility.
EUR/USD H4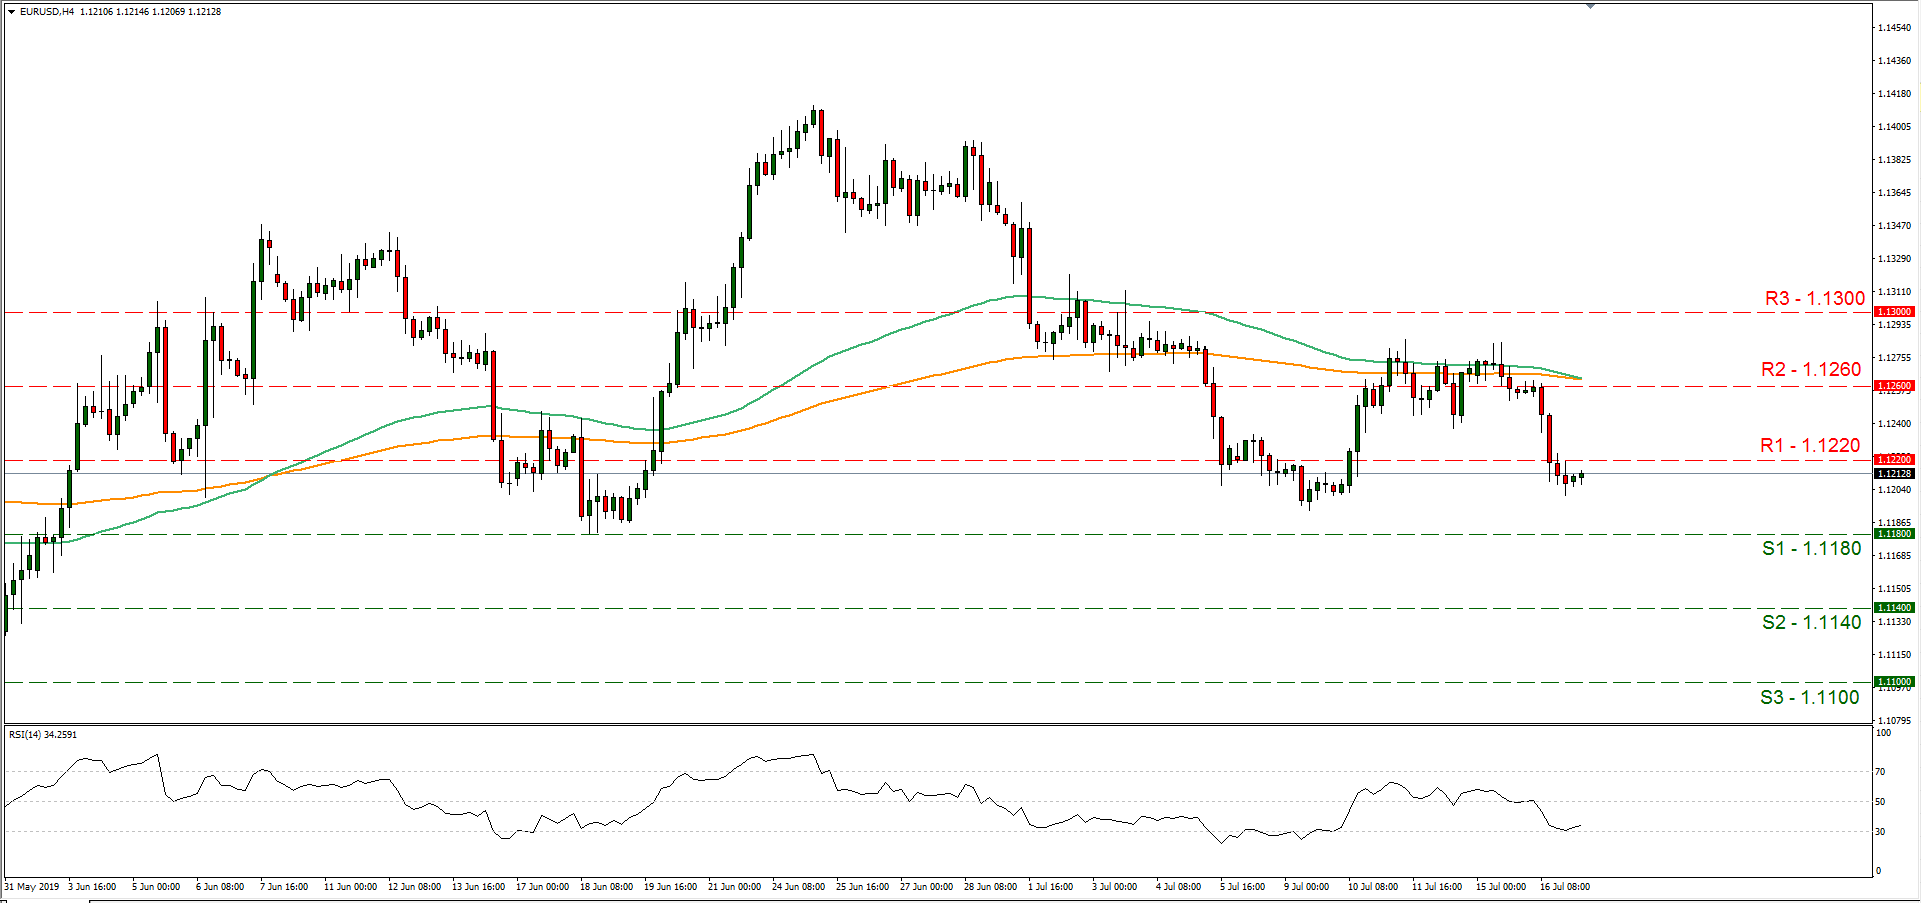
Support: 1.1180 (S1), 1.1140 (S2), 1.1100 (S3)
Resistance: 1.1220 (R1), 1.1260 (R2), 1.1300 (R3)
WTI H4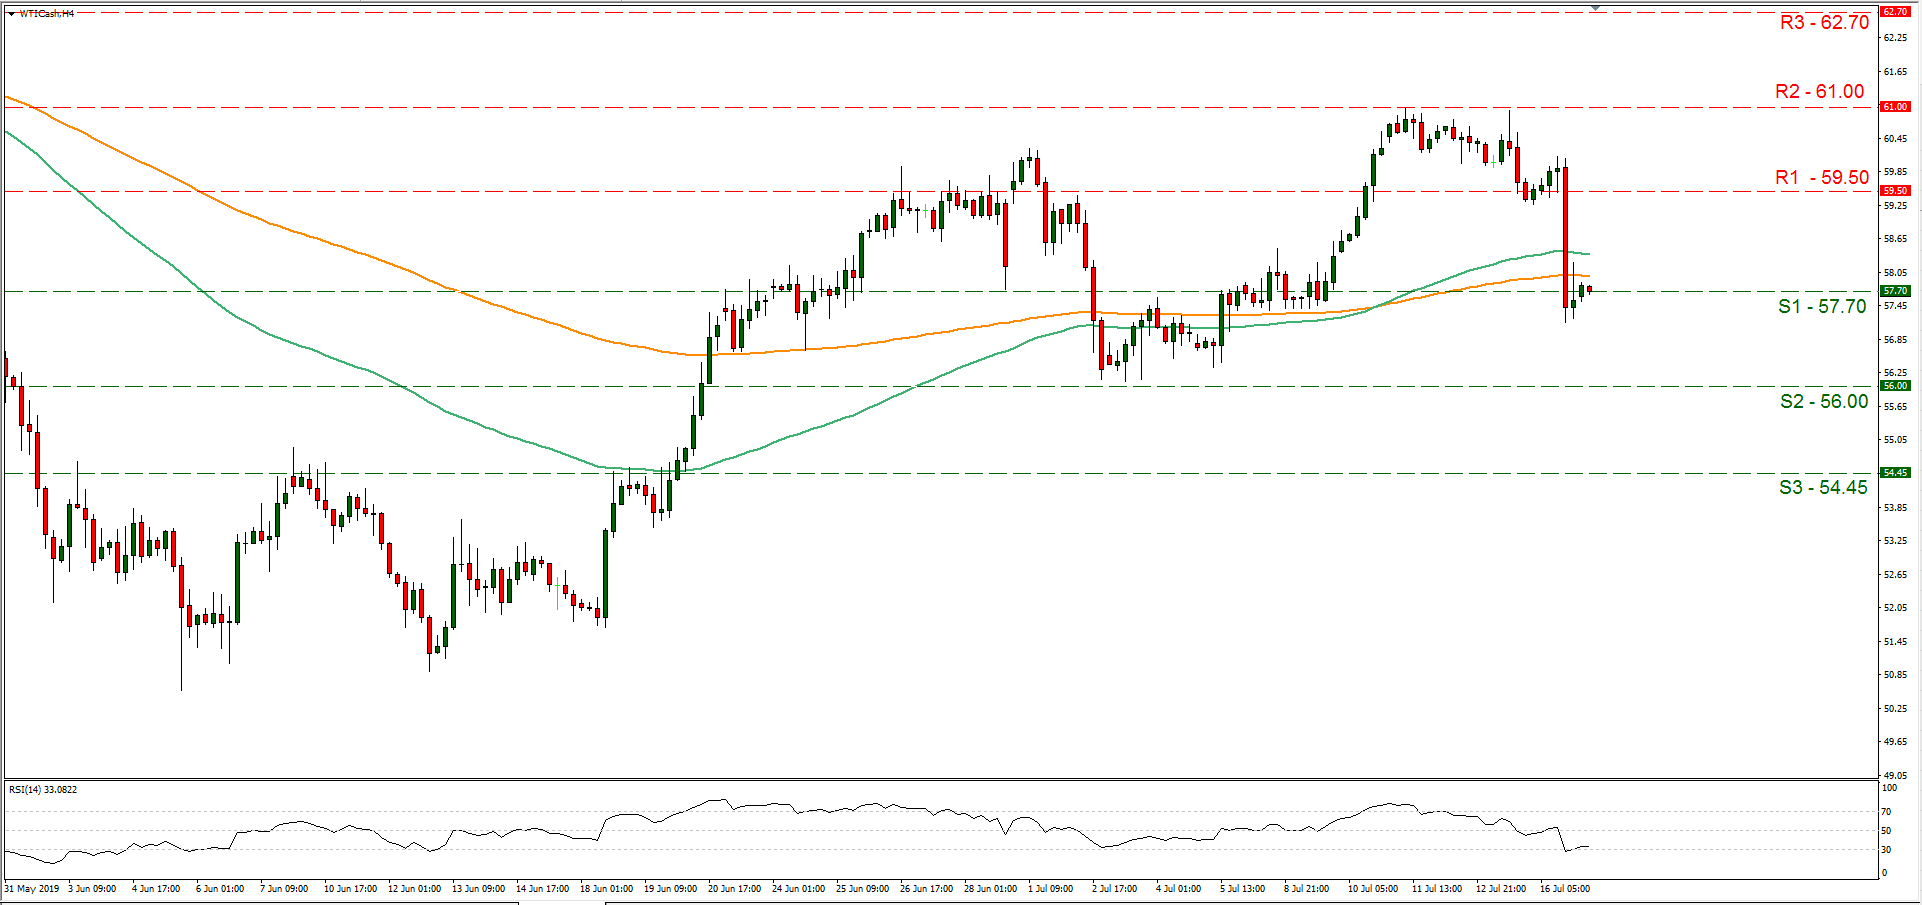
Support: 57.70 (S1), 56.00 (S2), 54.45 (S3)
Resistance: 59.50 (R1), 61.00 (R2), 62.70 (R3)
EURJPY Descends Into A Symmetrical Triangle, Nears Lower Boundary
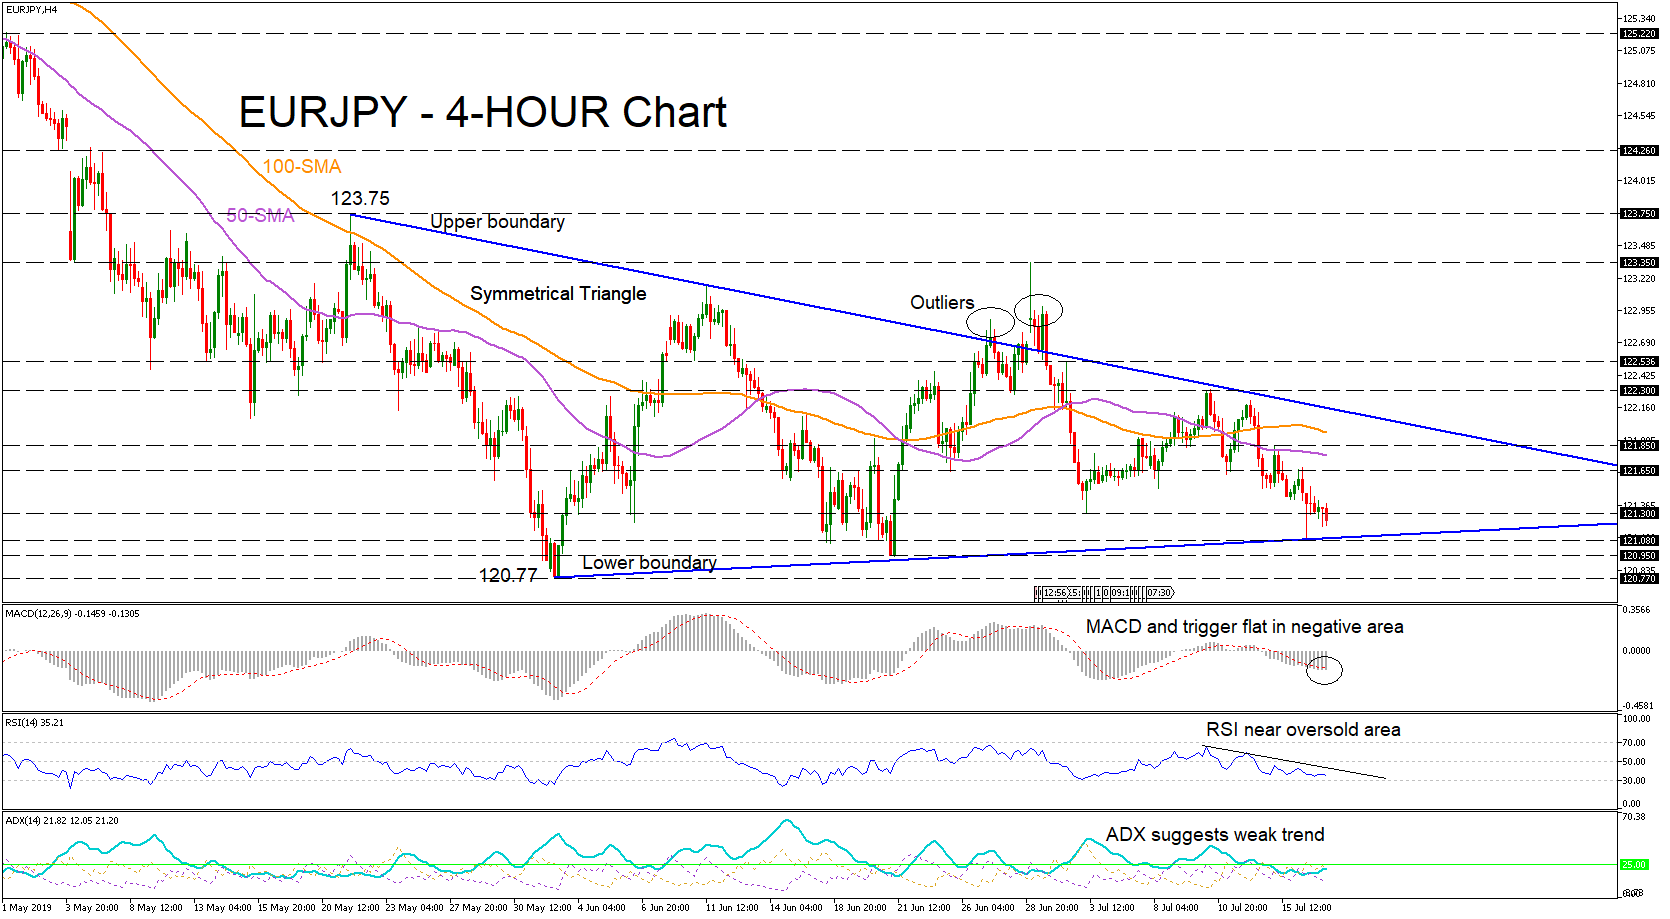
EURJPY slid down in the last week to near the lower boundary of a symmetrical triangle, that began almost two months ago on May 21, where the seller’s momentum evaporated. Today sellers are pushing down again heading for a retest.
Following the price decline from the upper boundary to the lower boundary, the MACD moved to the negative area where both the MACD and trigger line flattened out. The RSI trended down and is currently flat but pointing slightly south near 30 level. The ADX suggests the absence of a trend.
For further stretch downwards, sellers would need to push through the lower boundary of the symmetrical triangle coupled with the initial support of 121.08 before testing the previous ascending lows of the triangle formation. Those being firstly 120.95 and secondly 120.77.
Although the long-term simple moving averages (SMAs) of the 50- and 100-days suggest further losses, for shifts back up, the enforced lower boundary would need to hold, with immediate resistance of 121.30 being initially tested. The next obstacle that would need to be fractured for the upper boundary highs to come into play would be 121.65 and 121.85.
Ultimately a breach of the upper boundary and high of 122.30 would turn the outlook bullish in the short-term. Whereas in the medium-term, the price seems to need a break of the triangle boundaries to set a definitive direction.
EUR/USD Outlook: Bears Face Headwinds From Strong 1.12 Support Zone But Outlook Remains Negative
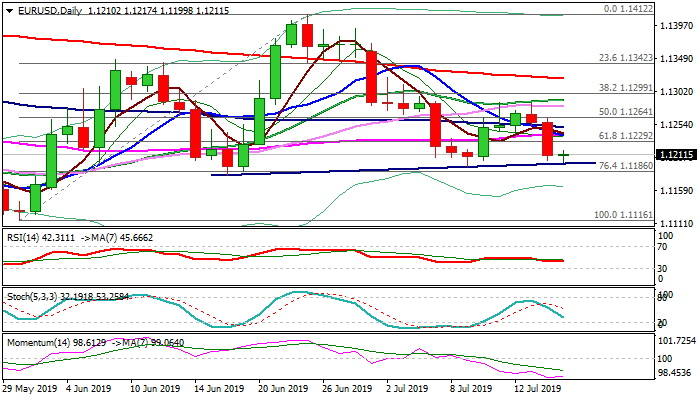
The Euro is consolidating above new one-week low at 1.1199, following 0.42% fall on Tuesday, when the single currency was dragged by weaker pound.
Fresh bears cracked important s 1.12 support zone, but faced strong headwinds and holding for now above pivotal supports at 1.1200/1.1181 zone (H&S neckline / lows of 9 July and 18 June).
Daily studies remain in negative setup but strong bearish momentum is losing traction, which suggests bears may stay on hold before renewed attack at 1.1200/1.1181 pivots.
Firm break here would open way for test of key supports at 1.11 zone.
Upticks are expected to ideally hold below barriers at 1.1227/37 (base of thin daily cloud / converged 10/55DMA’s) to keep bears intact, while break here and 100DMA (1.1250) would sideline bears for stronger correction towards key n/t barriers at 1.1280/90 zone (double-top / converged 20/30 DMA’s).
EU inflation data are due in a while, with forecasts remaining unchanged from the previous month.
Res: 1.1219, 1.1227, 1.1237, 1.1250
Sup: 1.1200, 1.1193, 1.1181, 1.1160
GBP/JPY Daily Outlook
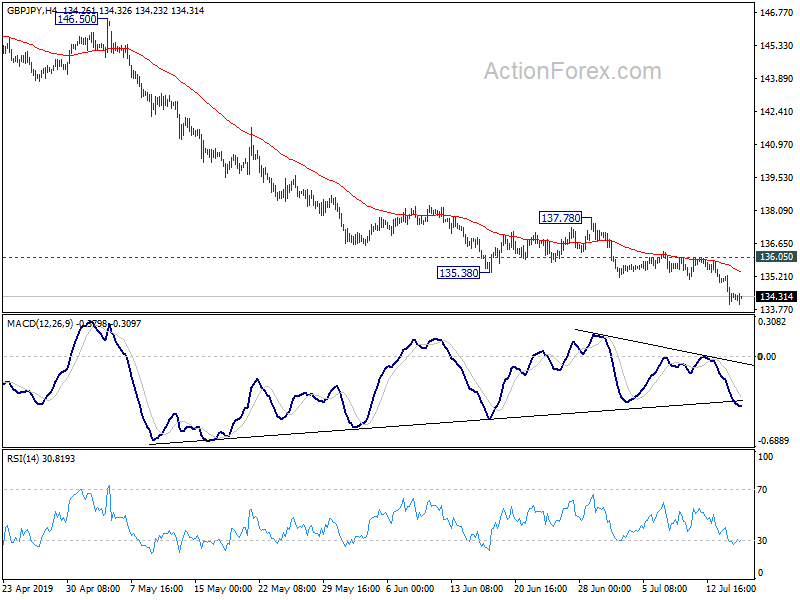
Daily Pivots: (S1) 134.73; (P) 135.29; (R1) 135.63; More...
Intraday bias in GBP/JPY remains on the downside for the moment. Current fall from 148.87 should target 131.51 low next. On the upside, break of 136.50 resistance is needed to indicate short term bottoming. Otherwise, outlook will remain bearish in case of recovery.
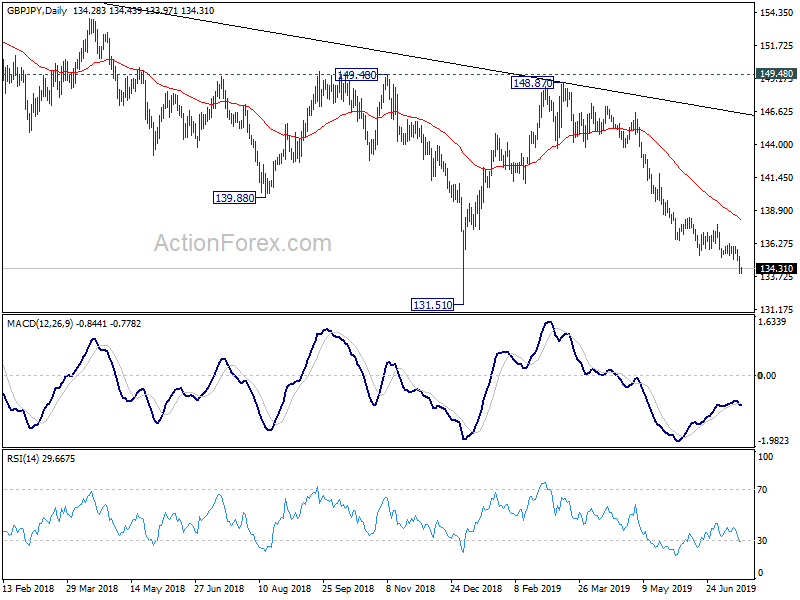
In the bigger picture, medium term fall from 156.59 (2018 high) is still in progress. Break of 131.51 will target 122.36 (2016 low). Structure of such decline is corrective looking so far, arguing that it's just the second leg of consolidation from 122.36. Thus, we'd expect strong support from 122.36 to contain downside to bring reversal.
EUR/JPY Daily Outlook
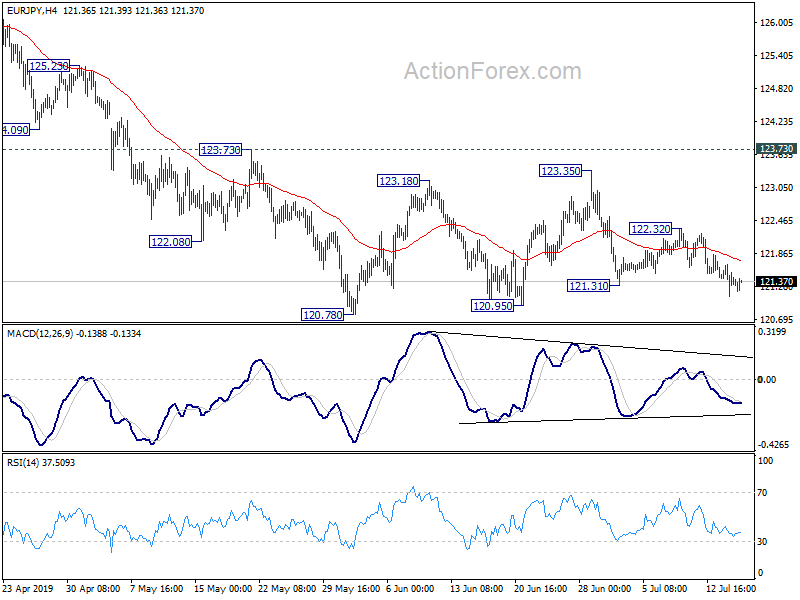
Daily Pivots: (S1) 121.06; (P) 121.37; (R1) 121.64; More....
Intraday bias in EUR/JPY remains on the downside for 120.78 support. Break will resume fall from 127.50 to 118.62 low. In case of another rise as consolidation from 120.78 extends, upside should be limited by 123.73 resistance to bring fall resumption eventually.
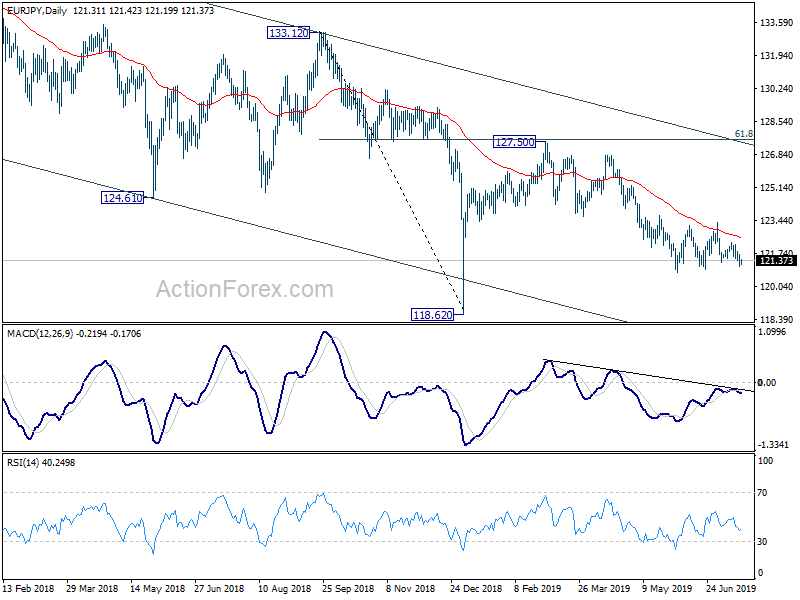
In the bigger picture, down trend from 137.49 is still in progress with the cross staying inside long term falling channel. Break of 118.62 will extend the fall to 109.48 (2016 low). On the upside, break of 127.50 resistance is needed to be the first sign of medium term reversal. Otherwise, outlook will remain bearish in case of strong rebound.
EUR/GBP Daily Outlook
Daily Pivots: (S1) 0.8969; (P) 0.8985; (R1) 0.9011; More...
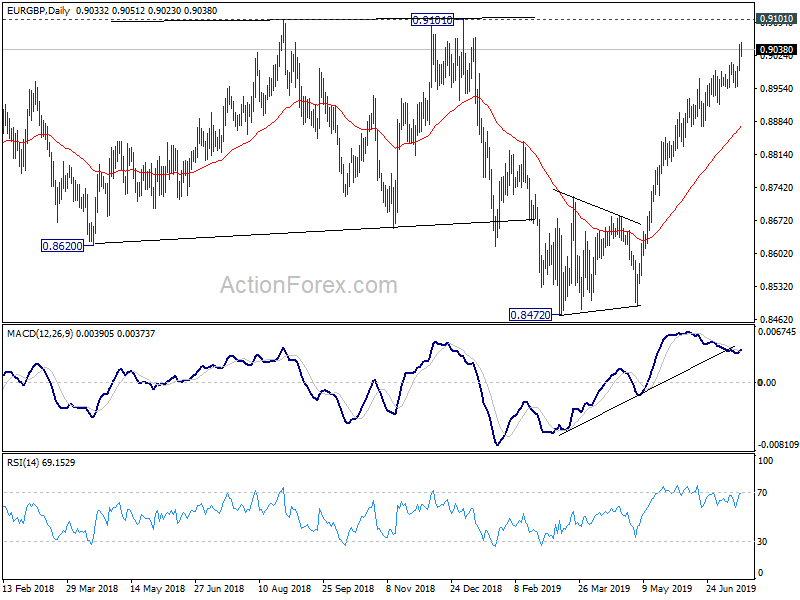
Intraday bias in EUR/GBP remains on the upside. Current rise from 0.8472 would target 0.9101 resistance. We'd be cautious on topping below 0.9101. On the downside, break of 0.8954 support will indicate short term topping. In this case, deeper pull back could be seen to 55 day EMA (now at 0.8875) first.
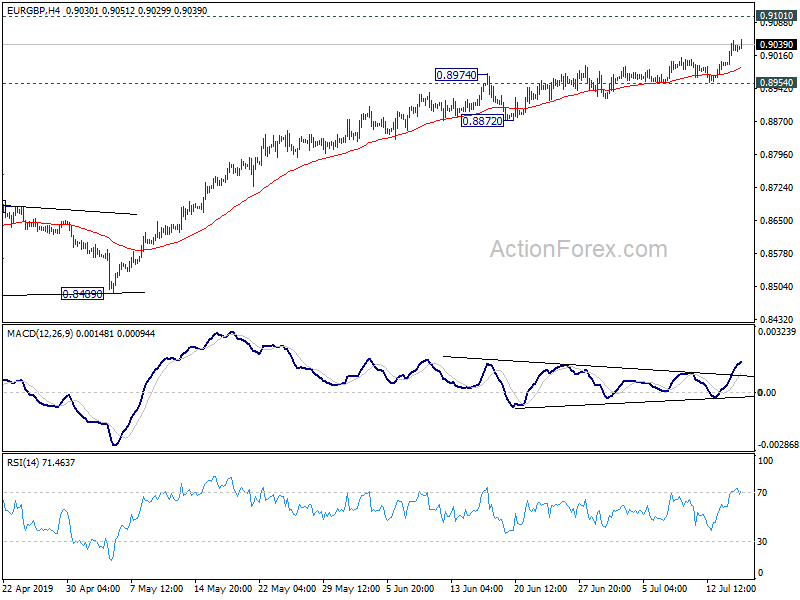
In the bigger picture, medium term decline from 0.9305 (2017 high) is seen as a corrective move. No change in this view. Current development argues that it might have completed with three waves down to 0.8472, just ahead of 38.2% retracement of 0.6935 (2015 low) to 0.9306 at 0.8400, after hitting 55 month EMA (now at 0.8545). Decisive break of 0.9101 resistance will confirm this bullish case. Nevertheless, as EUR/GBP is still staying inside long term falling channel, correction from 0.9305 could still extend to 0.8400 fibonacci level before completion, if upside is rejected by 0.9101.