Sample Category Title
EUR/AUD Daily Outlook
Daily Pivots: (S1) 1.5952; (P) 1.5981; (R1) 1.6018; More...
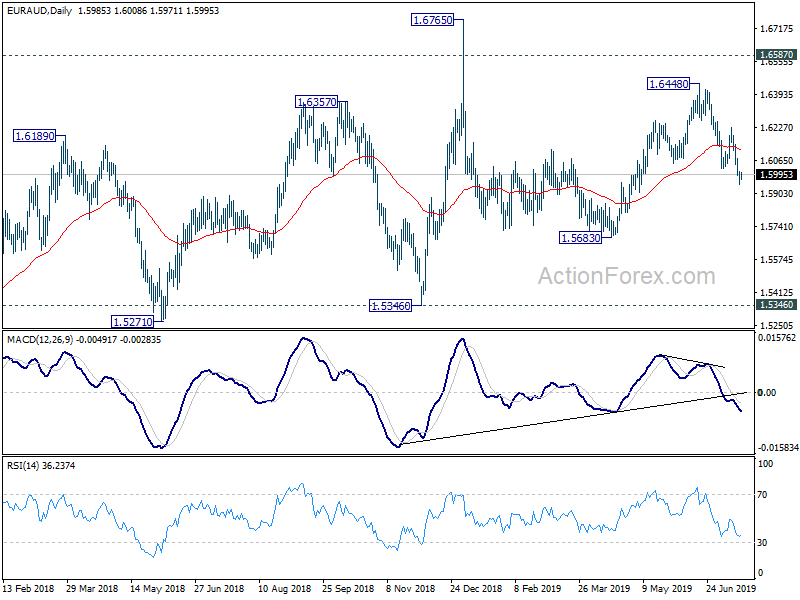
With 1.6073 minor resistance intact, intraday bias in EUR/AUD stays on the downside. Current fall from 1.6448 is seen as the third leg of the consolidation pattern from 1.6765 high. Next target will be 1.5683 support and below. On the upside, above 1.6073 minor resistance will turn bias neutral and bring consolidations. But upside of recovery should be limited below 1.6231 support to bring another fall.
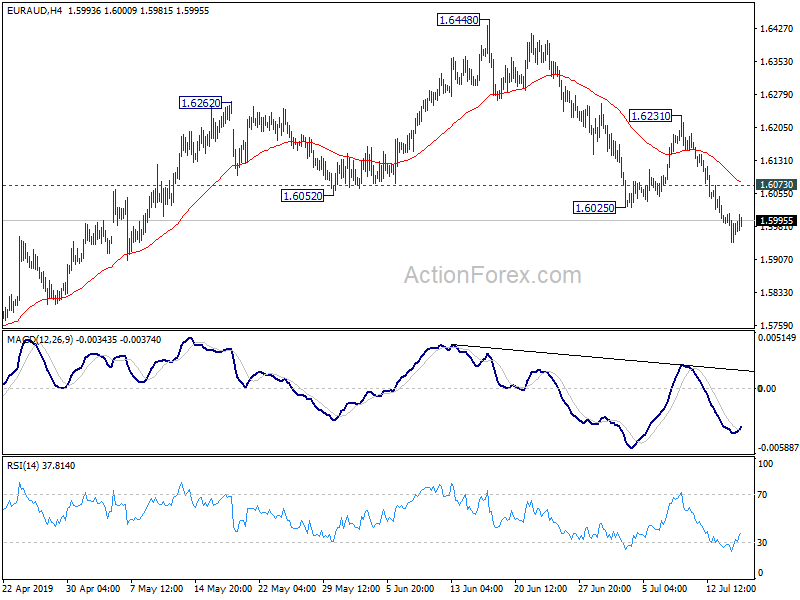
In the bigger picture, as long as 1.5346 support holds, outlook will still remain bullish. Up trend from 1.1602 (2012 low) is expected to resume sooner or later. Break of 1.6765 will target 61.8% retracement of 2.1127 (2008 high) to 1.1602 at 1.7488 next. However, firm break of 1.5346 key support will indicate trend reversal and turn outlook bearish.
Caution Makes A Comeback As Trump Reminds Global Investors Of Tariff Risks
Asian stocks continue to decline after the S&P 500 ended five straight days of gains to ease off its record high, as US President Donald Trump reiterated his tariff threat over $325 billion worth of Chinese imports.
Investors who are hopeful of a US-China trade deal in the near-term have once again been reminded of the tremendous gulf that persists between the world’s two largest economies. The path towards correcting US-China trade imbalances is still unclear, while the risk of more tariffs being placed on global trade remains on the table. Even though negotiations are set to resume in the near future, the ill-effects from the existing tariffs are already being felt in the global economy, as further evidenced by the dismal data out of key Asian economies in recent days. As long as the US-China trade tensions remain at current levels, markets will have scant reasons to push the risk dial significantly higher.
Should President Trump indeed impose more tariffs, it is expected to derail global growth while shattering the still-fragile market sentiment, sending investors scurrying back to safe haven assets.
Dollar climbs as US retail sales & factory output speak to economic resilience
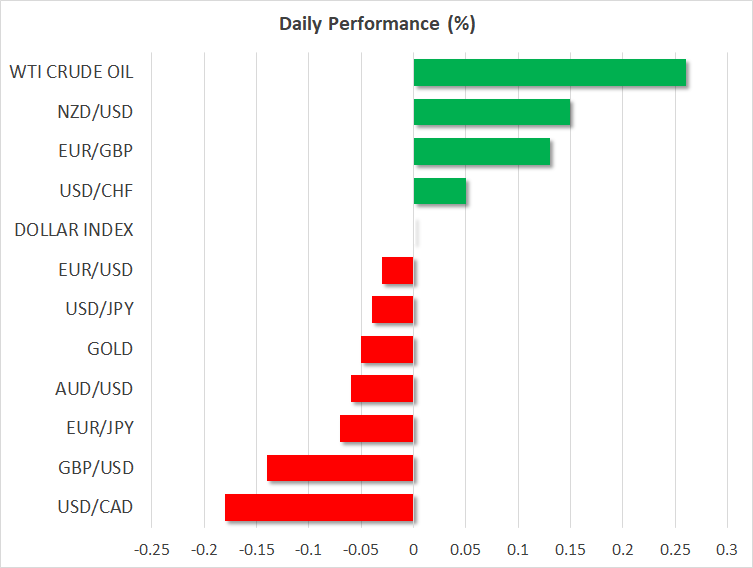
The US economic momentum appears steadfast in the face of waning global uncertainties, as June’s retail sales and factory output data came in better-than-expected. This prompted the Dollar Index (DXY) to climb towards the 97.4 mark at the time of writing, with most G10 and Asian currencies paring recent gains against the Greenback.
While the Fed remains on course for an interest rate cut later this month, the latest economic indicators imply that policymakers may be able to ease up on its dovish stance, which is allowing the Greenback to climb higher. The question now is whether the Fed will lower its benchmark policy rates by 50-basis points this month only to stand pat for the remainder of 2019, or trigger multiple cuts over the course of the year. Should external risks lean further towards the downside while US inflation remains muted, the Fed will likely then cling on to its easing bias, which in turn could cap Dollar gains.
Traders ignore positive UK employment data to send Pound to lowest since 2017
The Pound has hit a two-year low against the US Dollar, hovering just above the 1.24 level at the time of writing, as fears over a no-deal Brexit continue to climb. Despite the positive UK employment data, markets still remain very much focused on deciphering Brexit’s eventual fate.
With a new UK Prime Minister set to be announced by next week, Sterling traders have been disheartened by the remaining two candidates who both rejected the Irish backstop. Such rhetoric potentially raises the bar on striking a Brexit deal with the European Union, while increasing the likelihood of a no-deal Brexit. GBPUSD may continue exploring its downside, potentially testing 1.20, should the market-perceived likelihood of a no-deal Brexit ramp up ahead of the October 31 Brexit deadline.
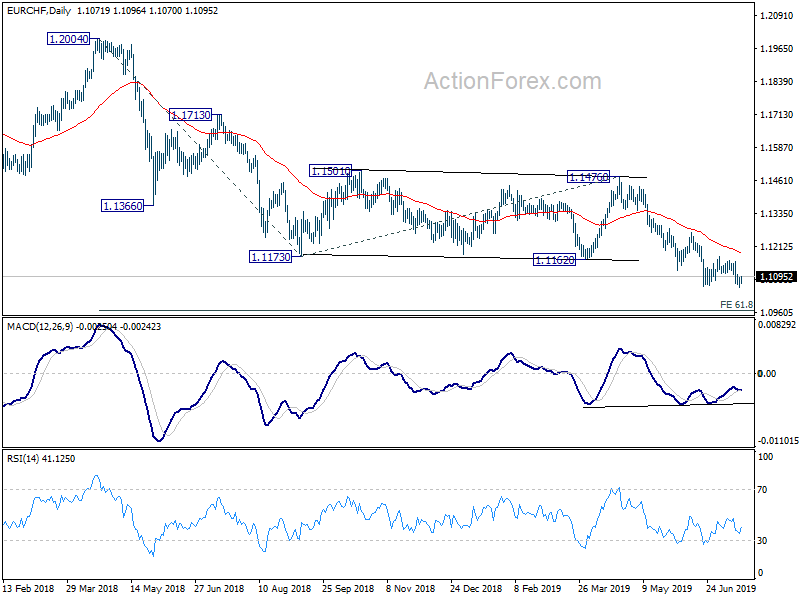
EUR/CHF Daily Outlook
Daily Pivots: (S1) 1.1056; (P) 1.1075; (R1) 1.1093; More...
EUR/CHF recovered ahead of 1.1056 support and intraday bias remains neutral. More consolidation could be seen. In case of another recovery, upside should be limited below 1.1264 resistance to bring fall resumption. On the downside, break of 1.1056 will extend the larger down trend for 61.8% projection of 1.2004 to 1.1173 from 1.1476 at 1.0962 next.
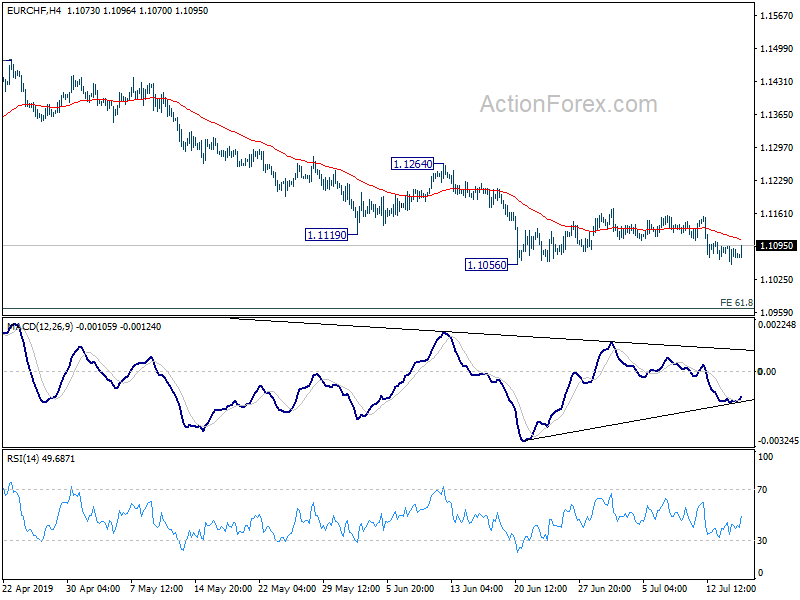
In the bigger picture, current development firstly suggests that down trend from 1.2004 is still in progress. More importantly, it's likely a long term down trend itself, rather than a correction. Outlook will remain bearish as long as 1.1476 resistance holds. EUR/CHF could target 1.0629 support and below.
Strong Data Does Not Interfere With The Dovish CB Policy
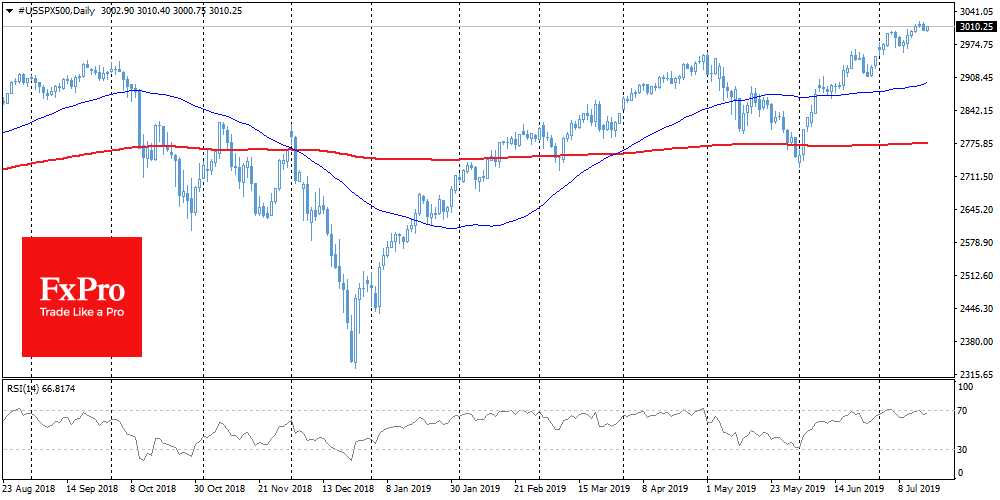
Markets continue to receive conflicting signals, but a wary mood prevails. Charles Evans from the Fed pointed to the possibility of reducing the rate immediately by 50 points in July, citing the risks of a global slowdown. External causes seem to be used by central bankers as a rationale for the soft policy position, despite the relatively good internal data of the countries. Time after time, indicators from the US, China, and UK surpassed expectations, but this did not change the markets' mood: investors are still preparing for the worst.
Stocks
Key indices continue to follow the tactic "the worse the better." The strong US retail sales data put pressure on quotes, rather than encouraging growth. Despite the fact that Evans' speech softened investor expectations, market participants seemed to prefer to take profits from the previous rally.
EURUSD
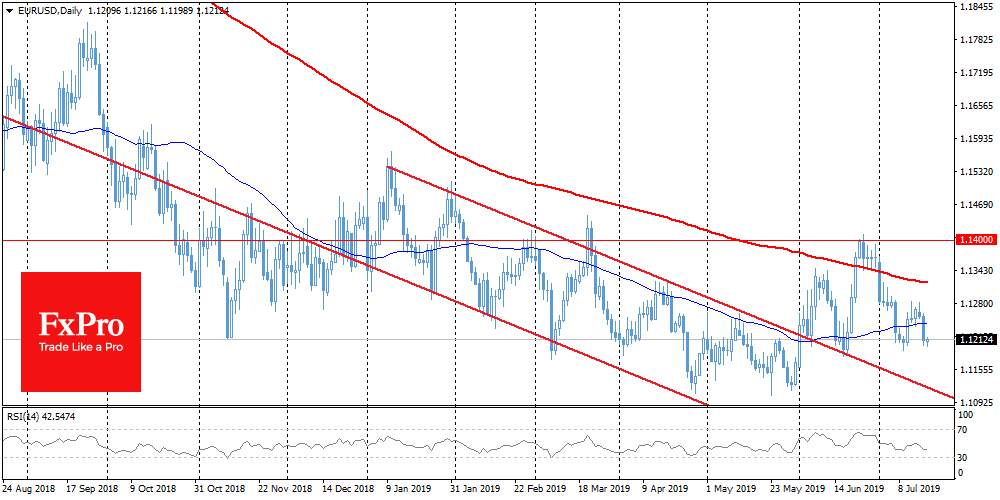
The single currency came under pressure following the sale on the pound. EURUSD returned to July lows around 1.1200. In addition, the dollar received support after strong retail sales figures. In contrast, business sentiment in Germany continued to deteriorate due to fears around global risks. Bears' attention could switch now to the area of 1.11, from which the pair rebounded in June 2018 and April-May 2019.
Brent
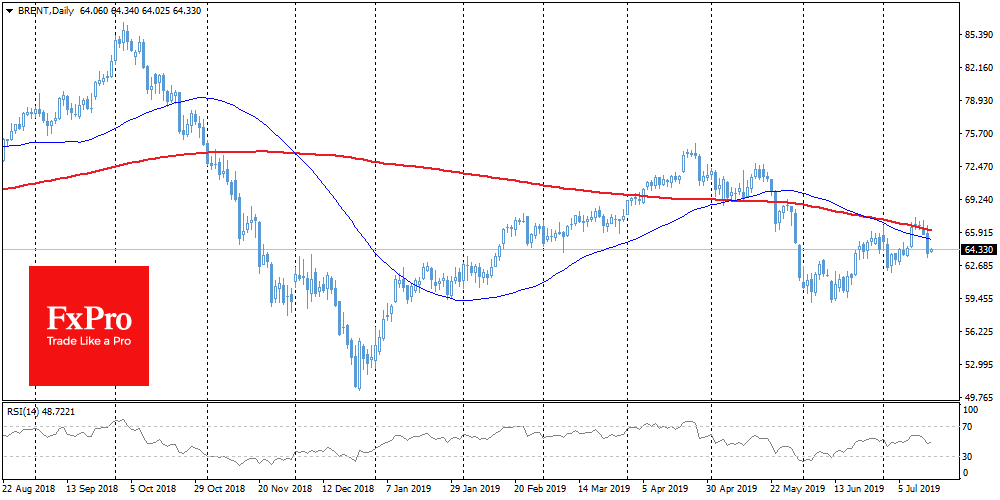
Oil fell sharply by the end of Tuesday, losing 4.8% intraday to $63.5 per barrel. The sale was provoked by rumours of a decrease in the degree of tension between Iran and the United States. In addition, data from an independent company, API, noted a not so sharp decline in inventories as expected, returning to the market's concerns about an overabundance of commodities. From the technical analysis side, the bearish signal is the fact that Brent has undergone a sale from the 200-day moving average, and this often acts as a significant level.
GBP/USD Outlook: Sterling Hits 27-Month Low In Extension Of Brexit-Fears Driven Fall
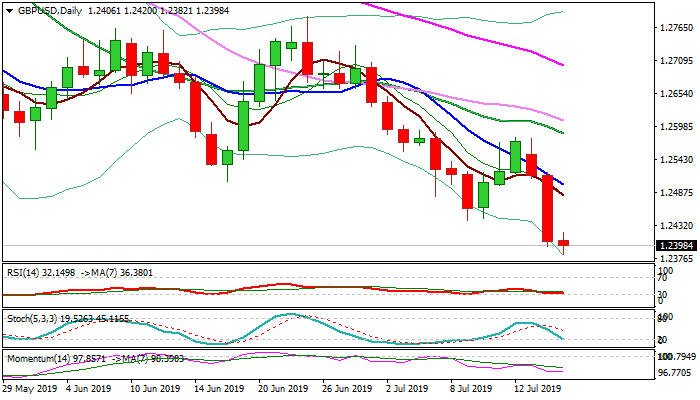
Cable broke through 1.24 handle and 2019 low at 1.2397 in early European trading on Wednesday and hit new 27-month low in extension of strong fall on Tuesday, when the pair was down almost 0.9%, in the biggest one-day fall since 28 Mar.
Persisting fears about no-deal Brexit remain main driver of the British pound, as the European Union under new leadership will not allow any changes to existing divorce deal terms that maintains strong pressure on sterling, with stronger dollar across the board, adding to negative outlook.
Today’s fresh bearish extension completed 2019 1.2397/1.3381 cycle and opened way for further weakness and possible retest of lows in 1.20 zone, hit on strong post-Brexit vote fall in 2016.
Daily MA’S remain in strong bearish configuration and negative momentum continues to rise, supporting scenario, but bears may take a breather as stochastic is entering oversold territory and RSI turned sideways on the border of oversold zone.
Markets are awaiting release of UK inflation data today for possible fresh signals, although forecasts for June CPI show unchanged values from the previous month (m/m 0.3% f/c vs 0.3% prev / y/y 2.0% f/c vs 2.0% prev).
Upticks are expected to provide better selling opportunities on overall bearish picture, with former low at 1.2505 (also falling 10DMA / base of thick 4-hr cloud) expected to cap.
Res: 1.2420, 1.2484, 1.2505, 1.2520
Sup: 1.2382, 1.2354, 1.2332, 1.2300
Libra’s Scrutiny Pushed Bitcoin Price Lower, How Low Will It Go?
Another milestone was done by Facebook yesterday, it moved a step closer to launch its WatsApp payment services in India. The company has been working on this since 2018 for its million plus users but the government regulation has been a major hurdle. It was required by the company to involve third party auditors in order to show them that the customer data is stored only on the servers based in India. The country’s digital money market is expected to grow to $1 trillion by 2023 which is nearly 5 times more than the current volume.
The timing of this initiative was really important because Facebook’s crypto currency called Libra faced its biggest challenge to date at Senate Banking Committee hearing yesterday. The law makers weren’t that friendly towards its new fintech initiative given that the company’s reputation has been tarnished due to the privacy issues. This has become the biggest roadblock for the firm.
Libra is an ambitious project which has a great potential because it offers an alternative banking system at a much lower cost, but in order to change this dream into reality, Facebook must convince Washington. The lawmakers called the project “dangerous” and this is because Facebook has failed its users to gain their trust fully. David Marcus, the project leader, faced some tough questions for nearly 2 hours but he maintained his conciliatory tone by saying that Facebook is determined to apply best practices to fight fraud, earn the trust back.
The pain isn't over yet for Libra as the firm's officials will have to answer more questions in a House Financial Services Committee Hearing today. Facebook has made one thing clear for the lawmakers that this innovation is coming and it is up to the United States if it wants to spearhead this technology otherwise it is only a matter of time when companies like Alipay can take over this space.
The scrutiny of Facebook's crypto currency has hit bitcoins price. All of this started with a tweet on Friday by the president of the United States, Donald Trump, who criticised Libra and crypto currencies. As I said before, Libra is a project wish is going to continue to provide both head and tail wind for the crypto king, Bitcoin. Mr. Marcus did provide assurance that the company is committed to “get this right” before it goes live.
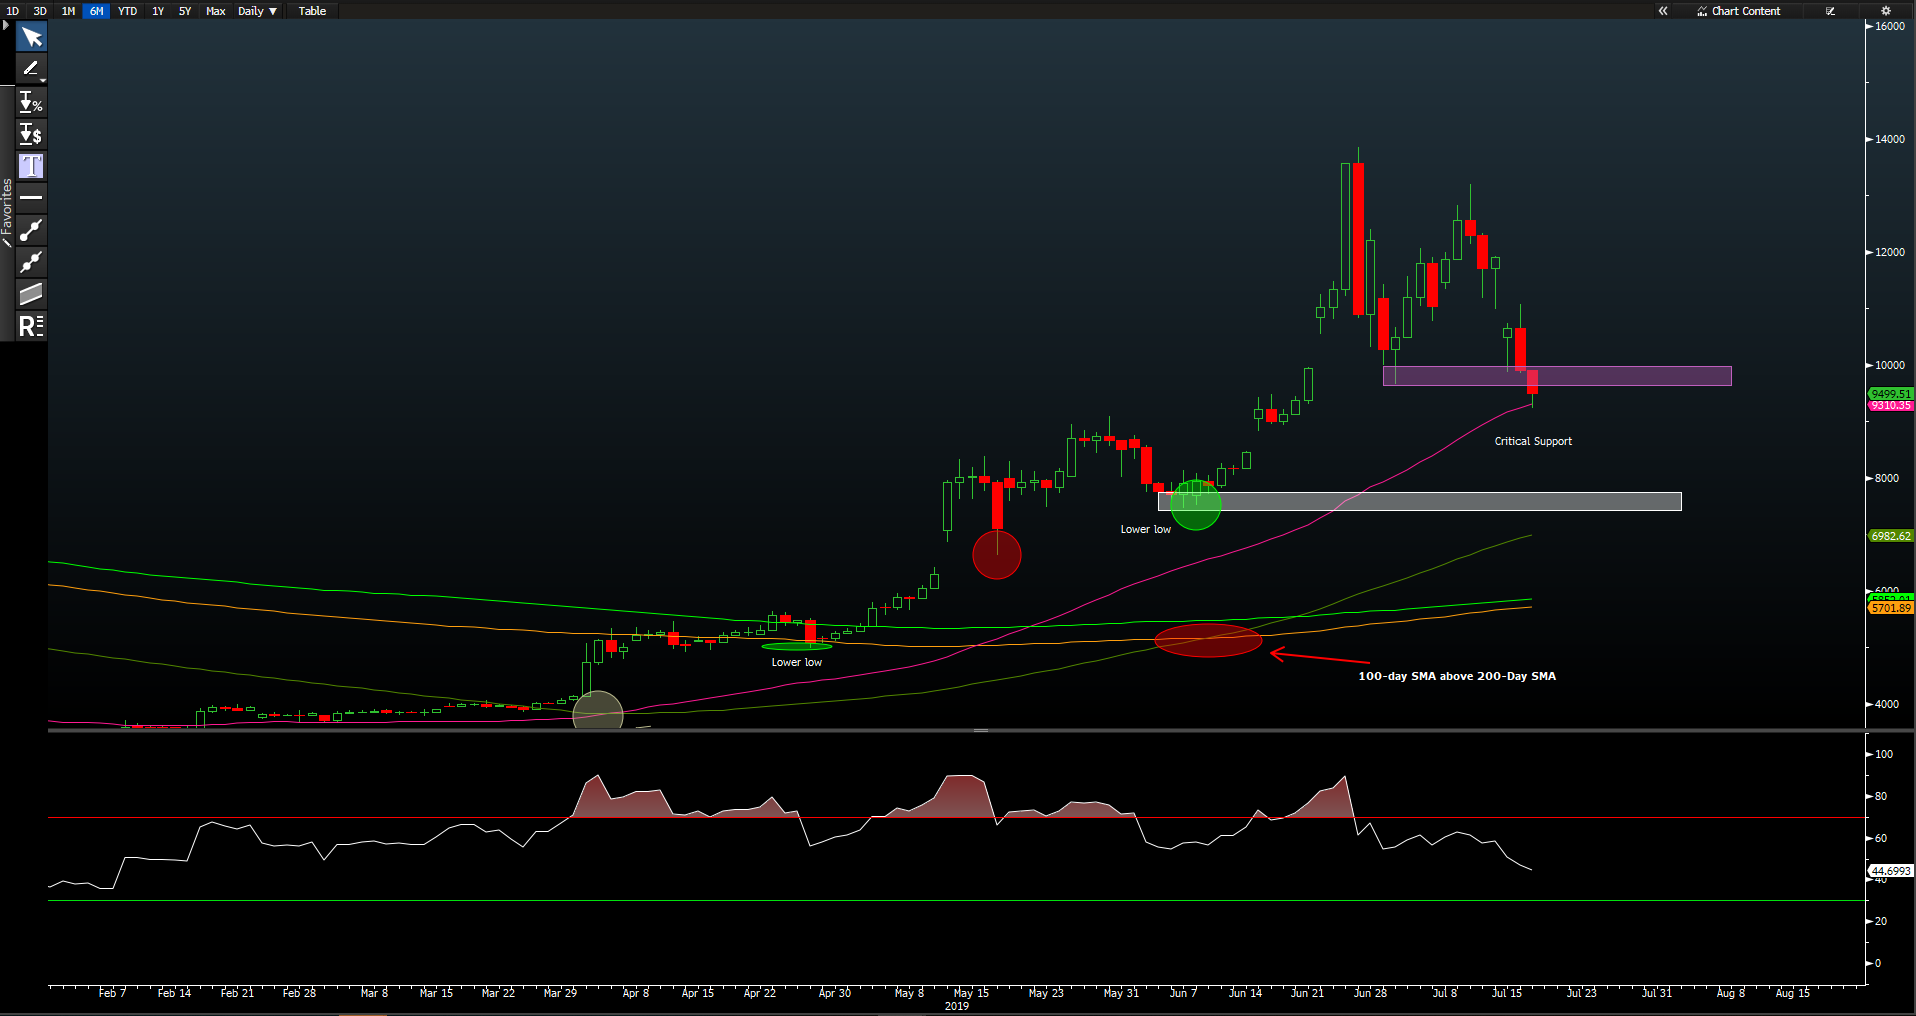
Speaking purely from the price action perspective, the Bitcoin price declined as much as 8.9 percent during the hearing and for the week it is down nearly 16 percent. The price has found its support near the 50-day moving average which is trading at $9,311. If the price falls below the 50-day moving average, it is likely that the price may continue to move lower and find support around the area of $7,418. The 242-day moving, which has impressive track record, is something that I am looking at closely. It is trading at $6,983 and the price must stay above this line in order for the bulls to keep their hopes alive.
The Analytical Overview Of The Main Currency Pairs
The EUR/USD currency pair
Technical indicators of the currency pair:
Prev Open: 1.12574
Open: 1.12099
% chg. over the last day: -0.41
Day's range: 1.12069– 1.12175
52 wk range: 1.1111 – 1.2009
The EUR/USD currency pair has gone down. Yesterday, the trading instrument fell by almost 50 points and hit key lows. The demand for the euro declined amid worsening economic sentiment in Germany. Additional support for USD was provided by positive data on US retail sales. Fed Chairman Jerome Powell reiterated that the regulator will take "appropriate measures" to ensure the country's stable economic growth. At the moment, the EUR/USD currency pair is consolidating in the range of 1.12000-1.12250. Quotes EUR/USD have the potential to further decline. We recommend to open positions from key levels.
The Economic News Feed for 17.07.2019:
Consumer price index (EU) - 12:00 (GMT+3:00);
Real estate market report (US) - 15:30 (GMT+3: 00);
Beige Book (US) – 21:00 (GMT+3:00);
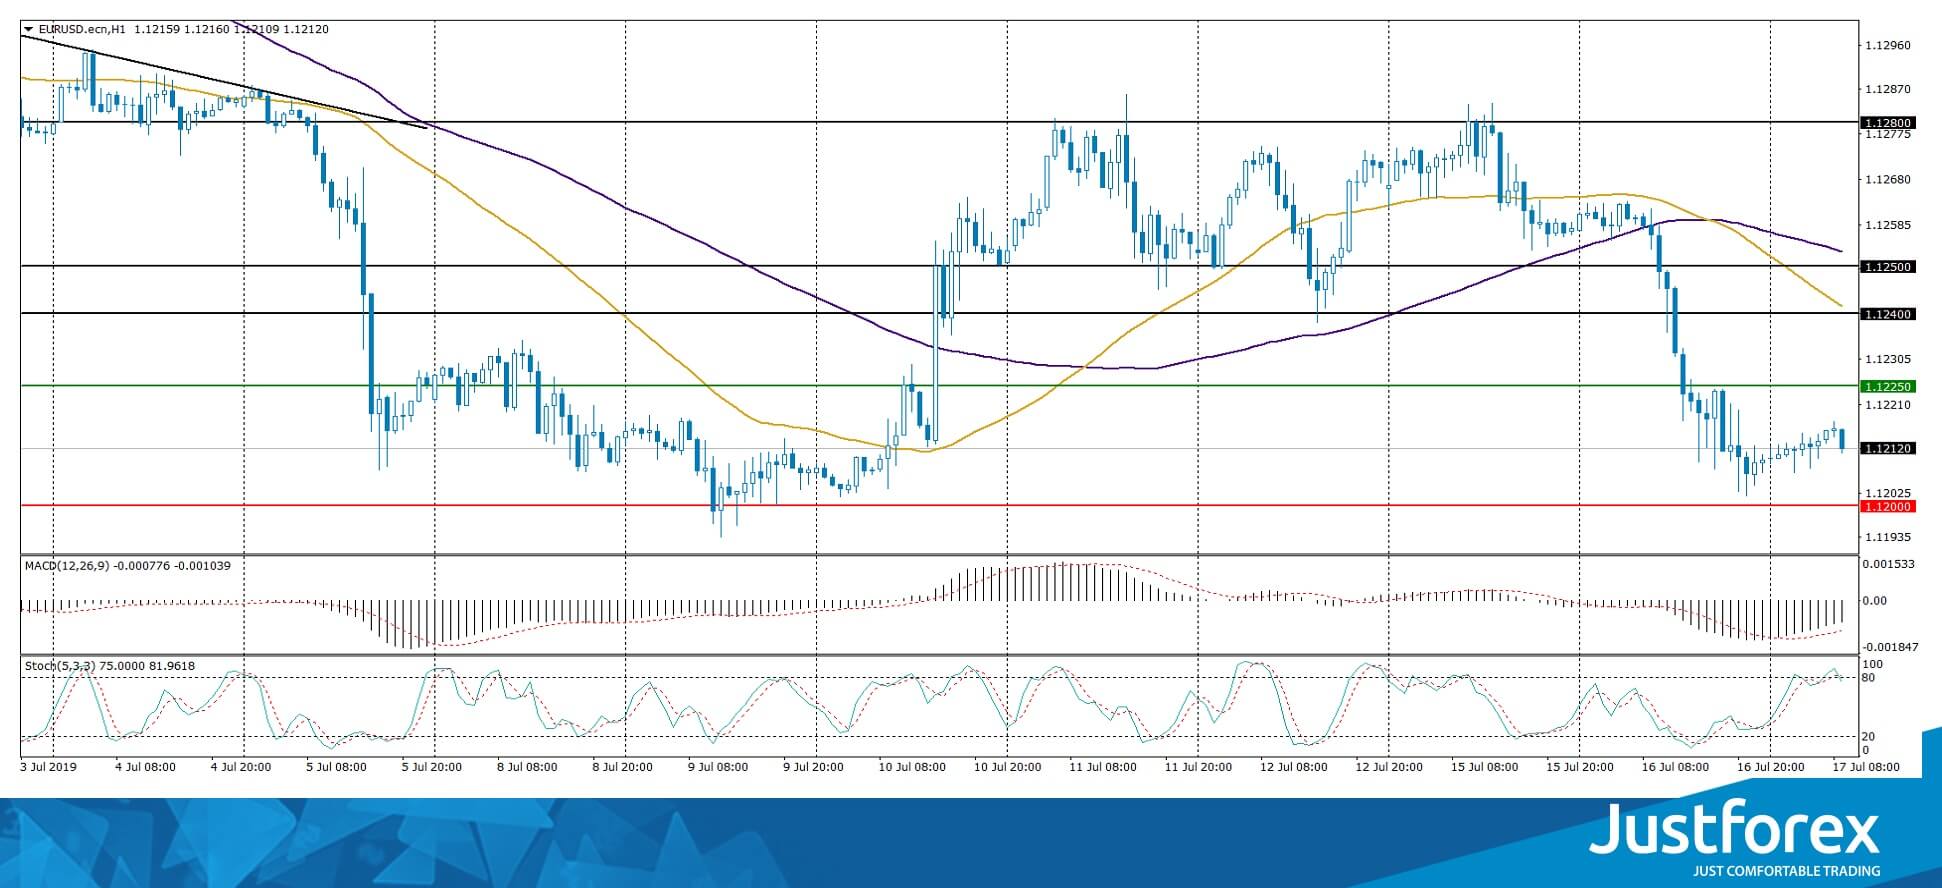
The price has fixed below 50 MA and 100 MA, which indicates the strength of the sellers.
The MACD histogram is in the negative zone, but above the signal line, which gives a weak signal to sell EUR/USD.
The Stochastic Oscillator is located near the overbought zone, the %K line crossed the %D line. There are no signals at the moment.
Trading recommendations
Support levels: 1.12000, 1.11500
Resistance levels: 1.12250, 1.12400, 1.12500
If the price consolidates below the round level of 1.12000, the quotes will fall toward 1.11700-1.11500.
Alternatively, they could recover toward 1.12400-1.12500.
The GBP/USD currency pair
Technical indicators of the currency pair:
Prev Open: 1.25495
Open: 1.25125
% chg. over the last day: -0.43
Day's range: 1.25070 - 1.25203
52 wk range: 1.2438 - 1.3631
Currency pair GBP/USD once again moved to a decline. Sterling updated local lows. At the moment, GBP/USD quotes are consolidating. The key range is 1.25100-1.25400. The pound remains under pressure due to the uncertainty around Brexit. Trading instrument can decline further. Today we expect important statistics from the UK. You should open positions from the key levels.
At 11:30 (GMT+3:00) a report on the labor market in the UK will be published.
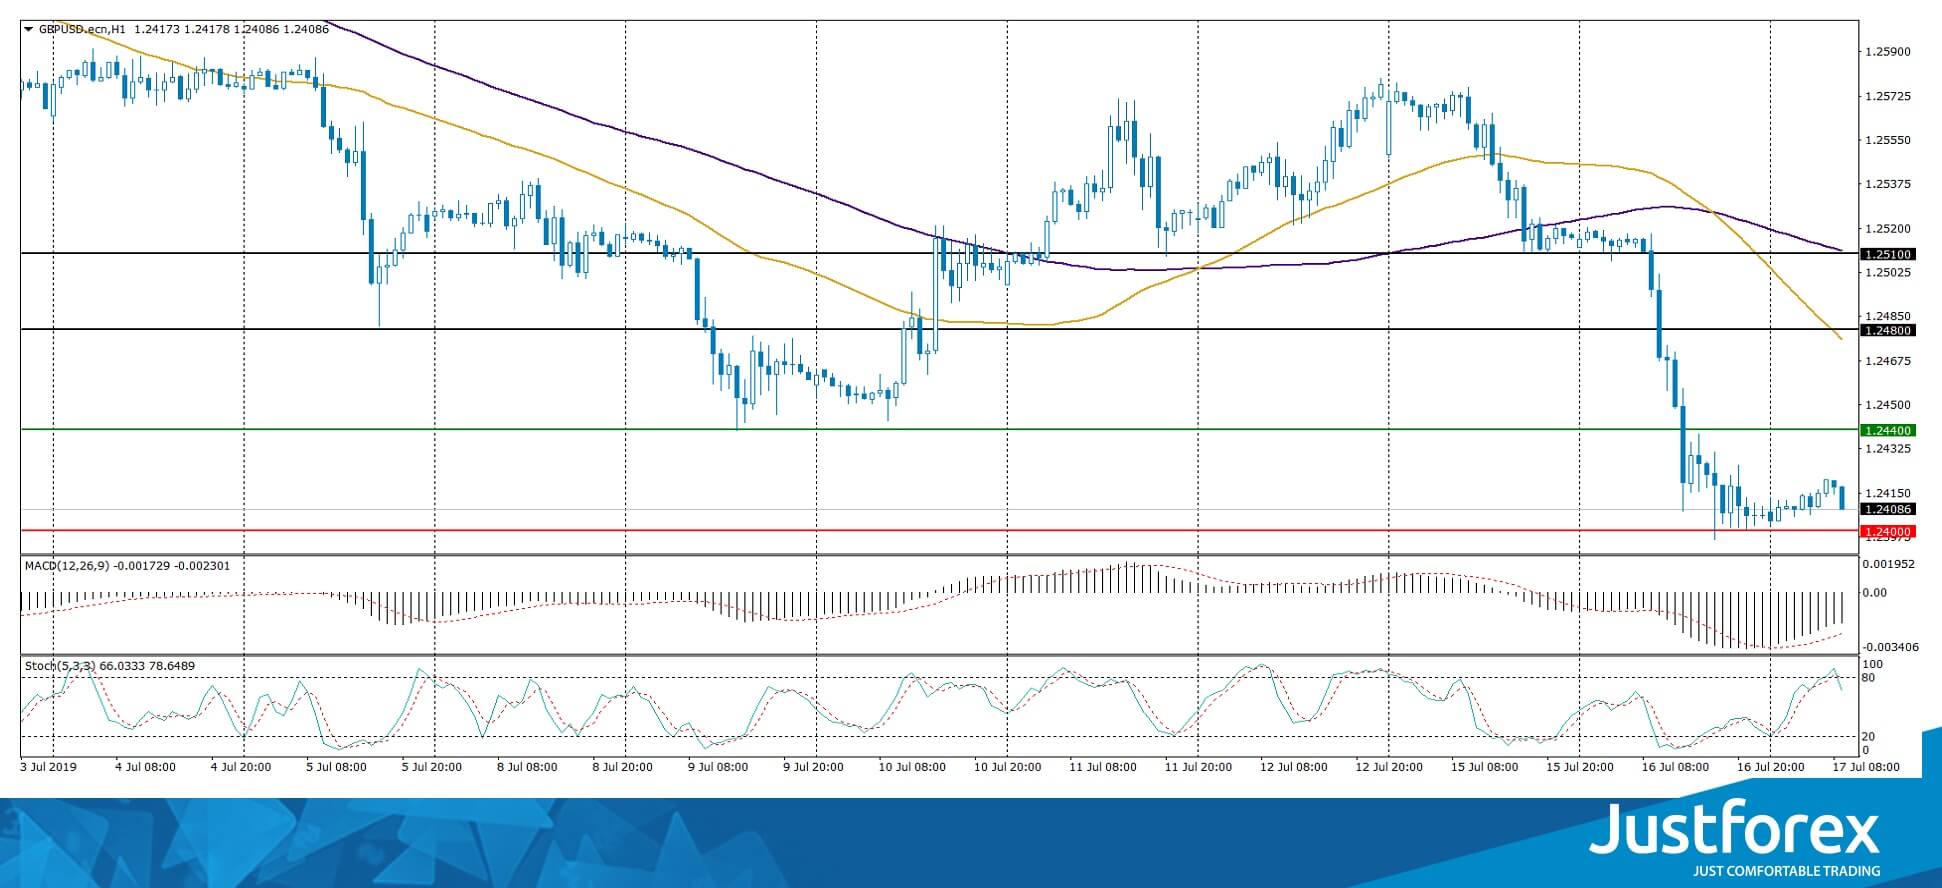
Indicators do not give accurate signals: the price has crossed 100 MA.
The MACD histogram is in the negative zone, but above the signal line, which gives a weak signal to sell GBP/USD.
The Stochastic Oscillator is in the neutral zone, the %K line crossed the %D line. There are no signals at the moment.
Trading recommendations
Support levels: 1.25100, 1.24800, 1.24400
Resistance levels: 1.25400, 1.25800, 1.26300
If the price consolidates below 1.25100, the quotes will fall toward 1.24800-1.24600.
Alternatively, the quotes can grow toward 1.25700-1.25900.
The USD/CAD currency pair
Technical indicators of the currency pair:
Prev Open: 1.30312
Open: 1.30472
% chg. over the last day: +0.11
Day's range: 1.30442 - 1.30588
52 wk range: 1.2727 - 1.3664
The USD/CAD currency pair has stabilized. CAD is in a lateral movement. Currently, the local support and resistance levels are 1.30350 and 1.30600. In the near future, technical correction of the trading instrument after a long fall is highly possible. We recommend to pay attention to the dynamics of oil prices. Positions must be opened from key levels.
The Economic News Feed for 17.07.2019 is calm.
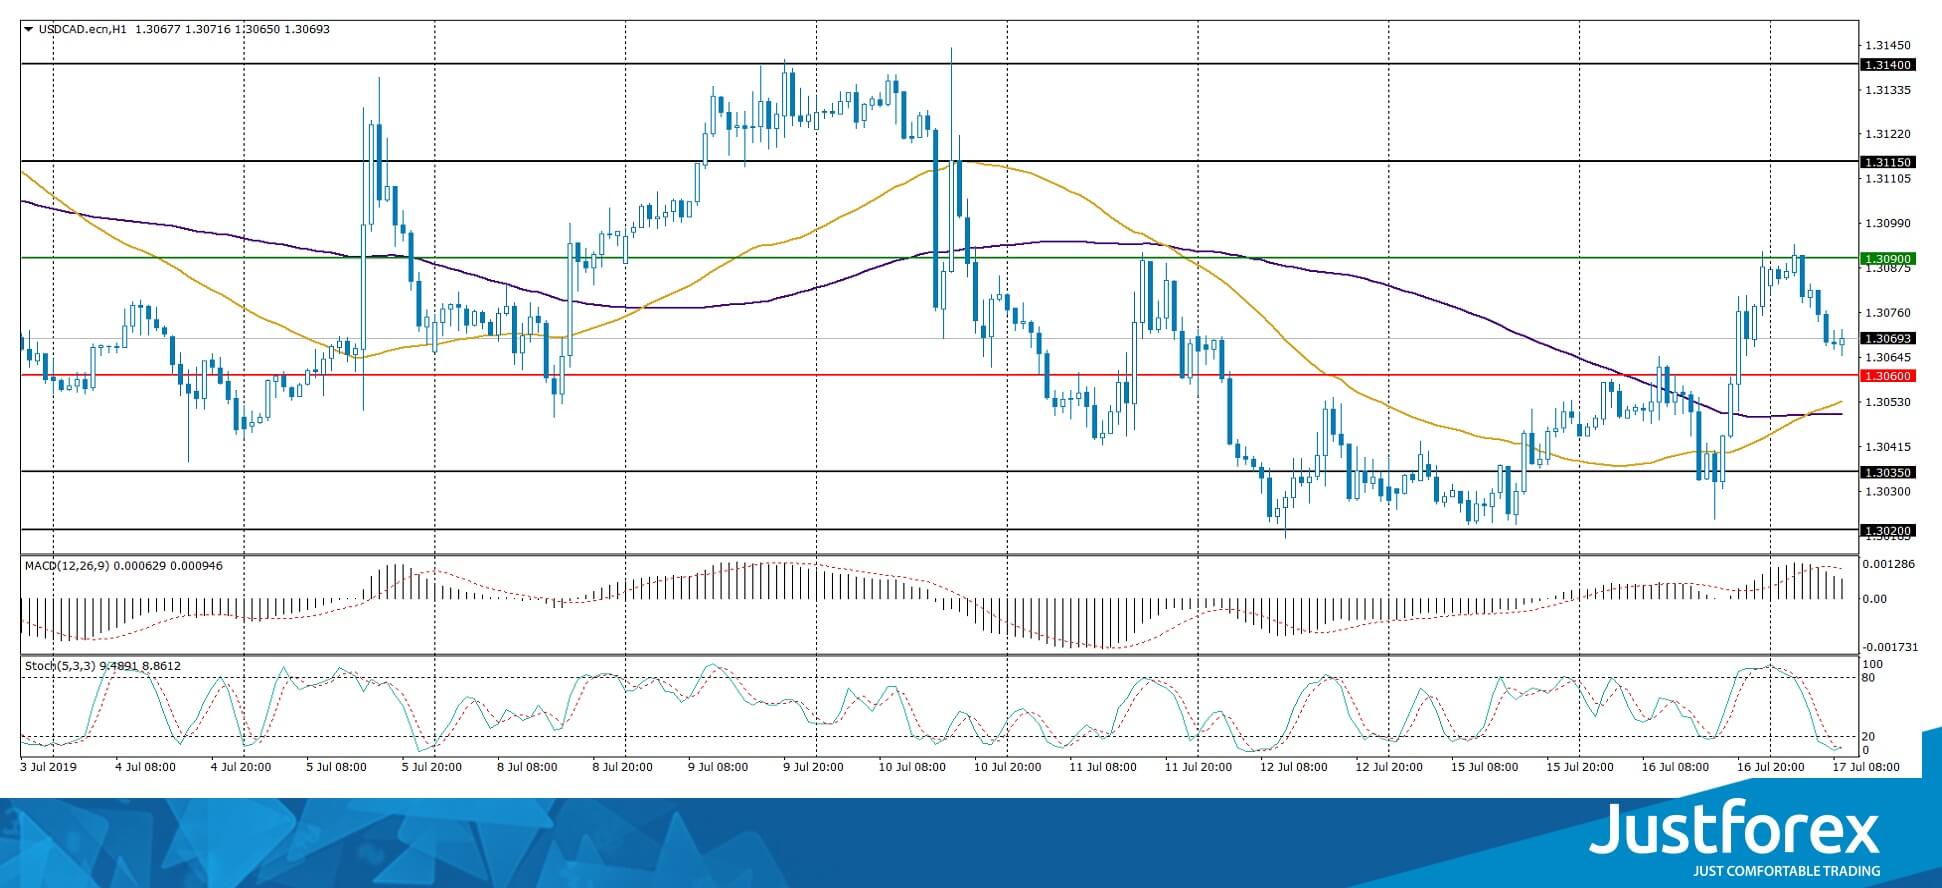
Indicators do not give accurate signals: prices are fixed between 50 MA and 100 MA.
The MACD histogram is in the positive zone and continues to rise, indicating a correction of the USD/CAD quotes.
The Stochastic Oscillator is in the neutral zone, the %K line is below the %D line, indicating a bearish mood.
Trading recommendations
Support levels: 1.30350, 1.30200, 1.30000
Resistance levels: 1.30600, 1.30900, 1.31150
If the price consolidates above 1.30600 the quotes can correct toward 1.30900-1.31100.
Alternatively, the quotes can fall toward 1.30000.
The USD/JPY currency pair
Technical indicators of the currency pair:
Prev Open: 107.854
Open: 107.909
% chg. over the last day: +0.06
Day's range: 107.820 - 108.094
52 wk range: 104.97 - 114.56
The USD/JPY currency pair continues to consolidate. Unidirectional trend is not observed. The safe harbor currency tests local support and resistance levels: 107.800 and 108.100, respectively. Financial market participants expect additional drivers. Today we recommend to pay attention to economic releases from the USA. Positions must be opened from key levels.
The news background on the Japanese economy is calm today.
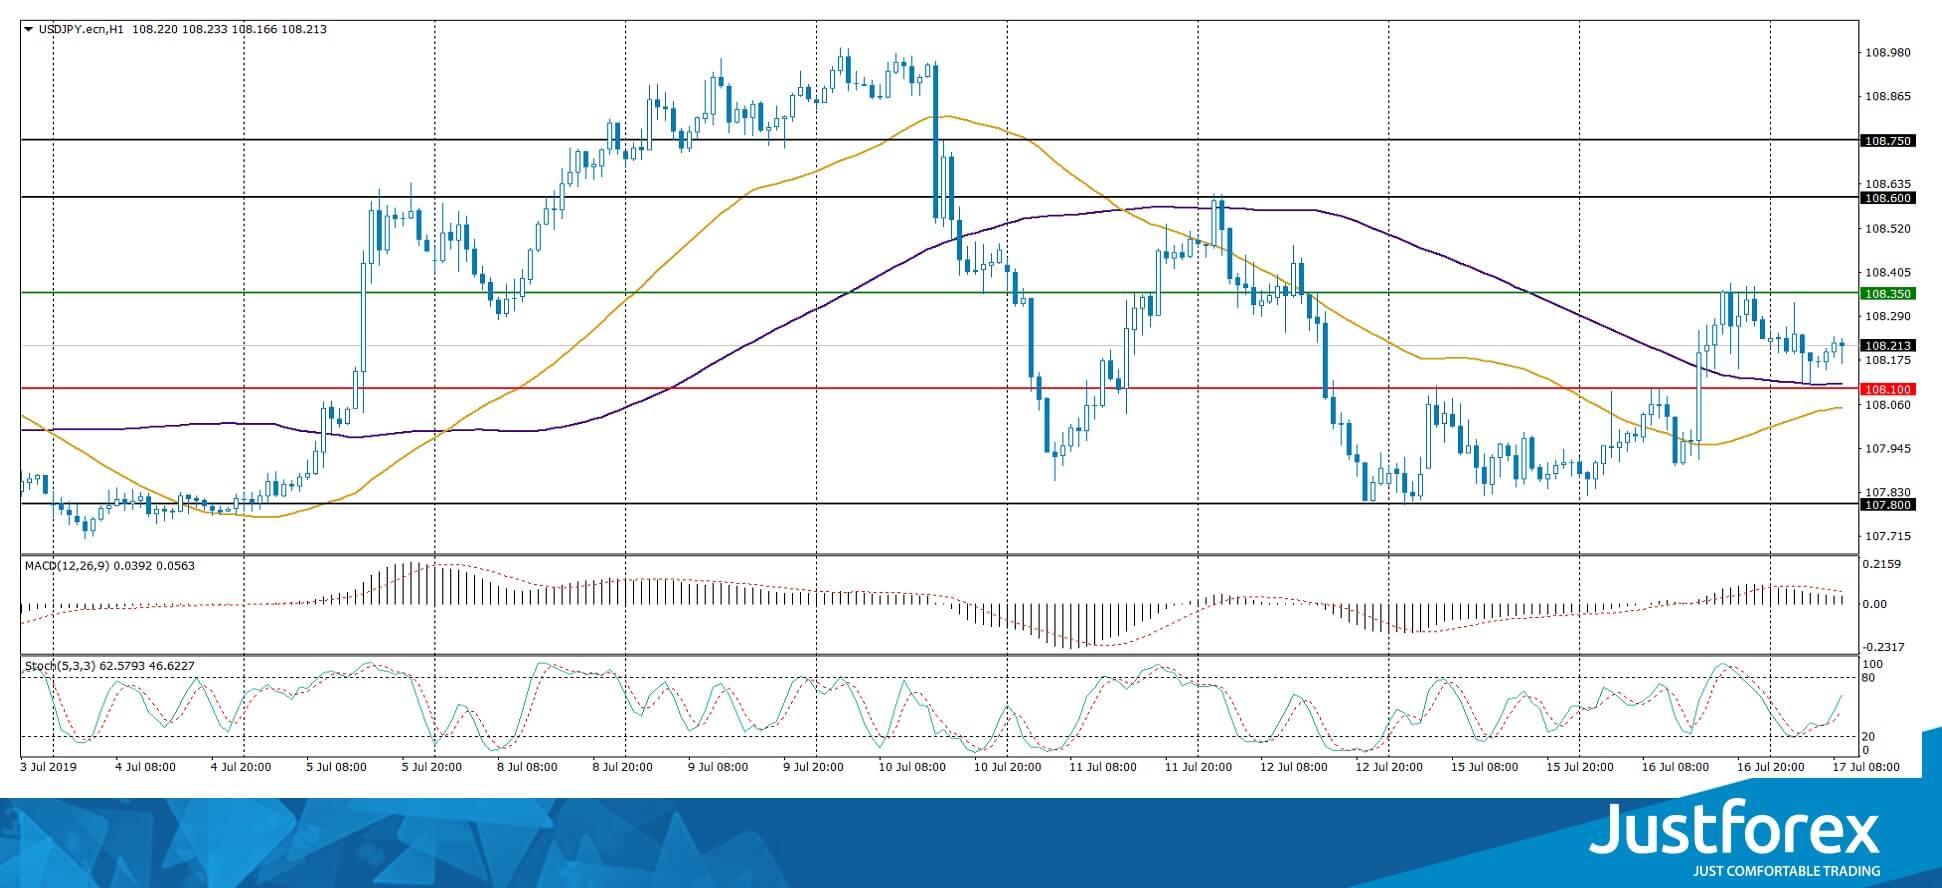
Indicators do not give accurate signals: the price crossed 50 MA.
The MACD histogram is near0.
The Stochastic Oscillator is in the neutral zone, the% K line is above the% D line, which indicates bullish moods.
Trading recommendations
Support levels: 107.800, 107.550
Resistance levels: 108.100, 108.300, 108.600
If the price consolidates below the 107.800 mark, the quotes can descend toward 107.550-107.400.
Alternatively, the quotes can grow to 108.400-108.600.
AUDUSD Prints Bearish Doji And Shifts Lower
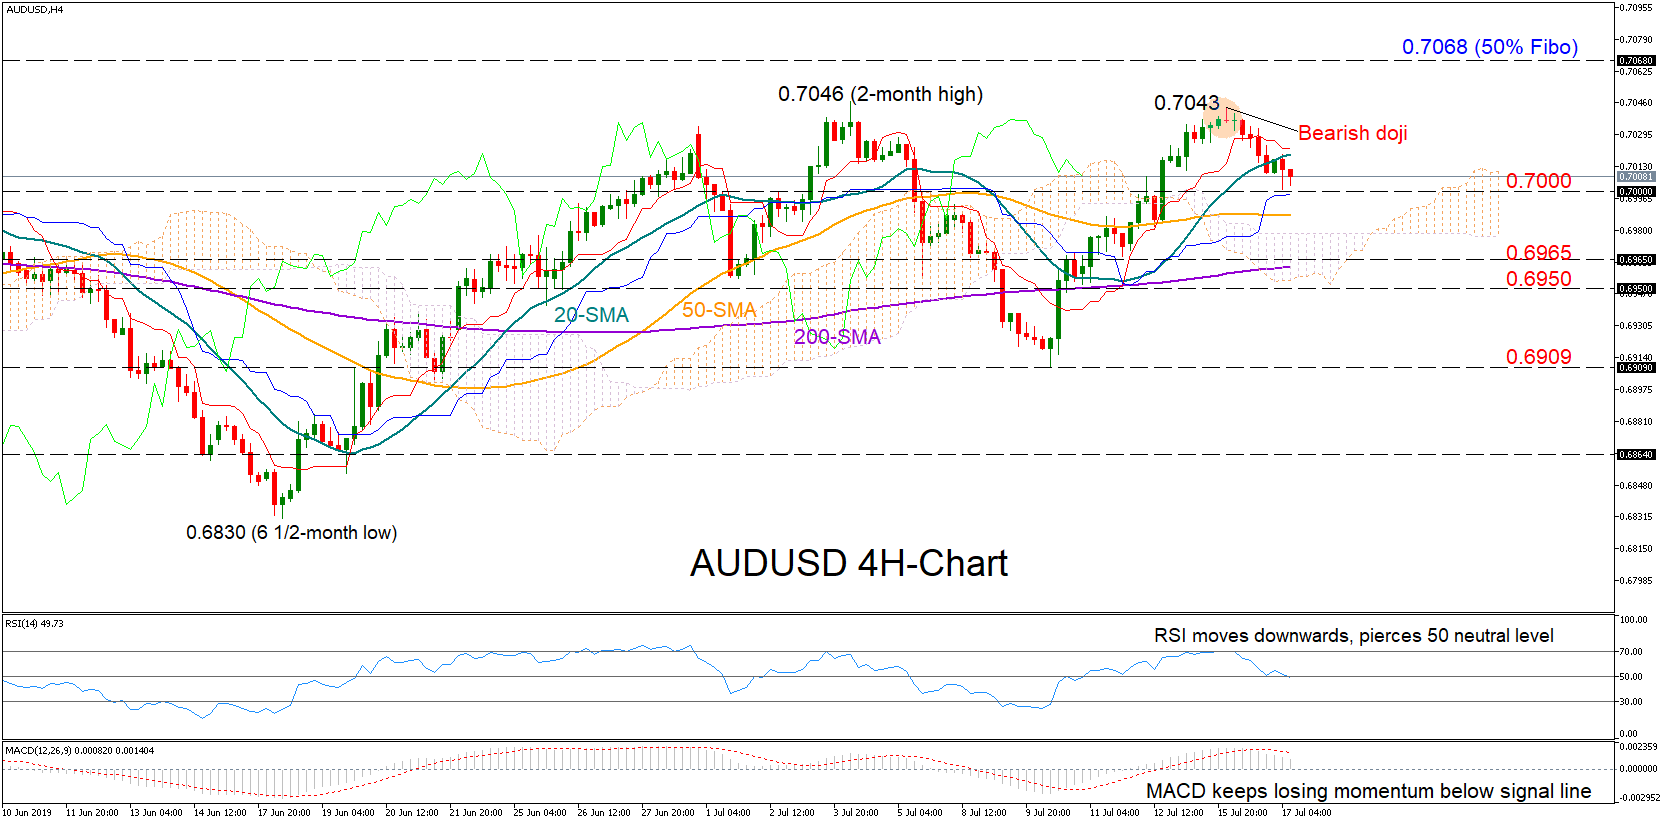
AUDUSD changed direction to the downside after printing a bearish doji near the two-month high of 0.7046 in the four-hour chart, keeping the market within the 0.7046-0.6900 range. The price has also retreated below the 20-period simple moving average (SMA), while the weakness in the RSI and the MACD is an additional warning that bearish sentiment is likely to stay in the short-term.
A decisive close below the 0.70 mark could trigger fresh selling towards the key 0.6965-0.6950 key area, where the 200-period SMA is currently hovering. Crawling lower and under the Ichimoku cloud the door would open for the previous low of 0.6909.
The 20-period SMA at 0.7020 would come first into view and ahead of the 0.7046 ceiling if the bulls retake control. Clearing the recent tops, the next important resistance to keep in mind could be detected around the 0.7068 level which is the 50% Fibonacci of the steep downleg from 0.7392 to 0.6745. If this proves easy to get through, the rally may continue until the 0.7150 area.
In brief, AUDUSD is facing a bearish short-term risk in the four-hour chart. However for the market to violate its range-bound trading the price needs to break above the 0.7046 top or fall below the 0.6900 boundary.
Sterling Stumbles As No-Deal Brexit Fears Strike Back
- Pound touches 27-month lows as no-deal Brexit concerns resurface
- Dollar capitalizes, and may have more room to recover for now
- Oil sinks as Washington hints at 'progress' with Iran
- Canadian inflation data coming up
Sterling stumbles as no-deal worries wreak havoc
The pound came under fire on Tuesday, falling by more than one big figure against the dollar to touch lows last seen in April 2017, as the risk of a no-deal Brexit popped back on the market's radar. The selloff followed remarks from Boris Johnson, the likely next Prime Minister, who during a debate late on Monday said that the Irish backstop is an 'instrument of incarceration' which must be scrapped. Separate reports that he may suspend Parliament in October to enable a no-deal Brexit exacerbated the move.
UK inflation data are due for release today, but admittedly, any sizeable reaction seems unlikely judging by the muted move after yesterday's stronger-than-expected employment figures. Rather, politics may remain the driving force.
Taking a step back, it's difficult to envision any sustained rebound in sterling, outside of one fueled by profit-taking. Yes, a lot of bad news is priced in already, but for good reason, as the nation truly seems to be drifting towards a no-deal exit, while the BoE is about to abandon its hiking plans. A weaker dollar may limit severe sterling losses in the longer term, but for now, more pain may be in store unless something drastic changes in the Brexit outlook. Perhaps hints for a General Election could do the trick.
Dollar capitalizes on pound's weakness, strong US data
The biggest winner from the plunge in sterling was the dollar, with some strong US retail sales prints amplifying the gains. The euro was broadly weaker, as the growing risk of a disorderly Brexit spells bad news for the Eurozone as well.
On the US front, it's significant that the dollar advanced even though the odds for an aggressive ‘double' Fed rate cut in July stayed unchanged. Fed speakers did not move the needle, though some remarks by Kaplan that a July cut may be a 'tactical' move and 'not the beginning of a rate-cutting cycle' were interesting.
In the near term, the dollar may have some more room to recover, as yesterday's robust retail sales suggest little appetite – or need – for a ‘double' rate cut in July, even though markets still attach a ~25% probability to that prospect.
Oil sinks as Trump hints at Iran progress; stocks retreat
In energy markets, oil prices dropped substantially, with WTI crude crossing back below the $58/barrel mark after Trump said that 'a lot of progress' is being made with Iran. Markets saw this as a signal that Washington is trying to defuse the situation, even though comments from Iran's supreme leader suggest Tehran remains adamant about rolling back the nuclear deal.
Crude prices took a separate hit from the demand outlook, alongside US stocks, after Trump reiterated his threat for more tariffs on Chinese goods. He seemed particularly annoyed that Beijing hasn't started to buy US agricultural goods again, something he insists was part of the ‘ceasefire'.
Canadian inflation data coming up; earnings continue
On the data front, the main event today will be Canada's CPI prints for June. Forecasts point to a slowdown in inflation, which may prove slightly negative for the loonie – though probably not enough to meaningfully alter expectations that the Bank of Canada will remain neutral.
Meanwhile, the earnings season continues with Netflix, Ebay, and Bank of America releasing their results today.
Forex Technical Analysis: EUR/USD, USD/JPY, GBP/USD
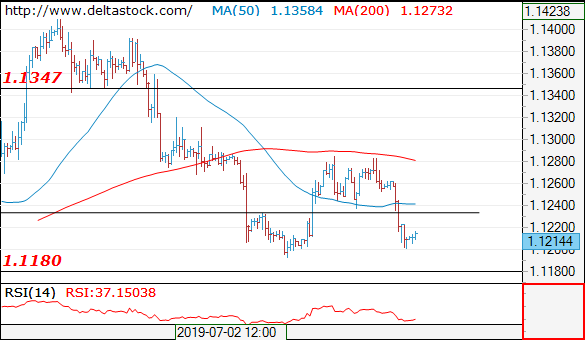
EUR/USD
Current level - 1.1214
The bias is bearish below 1.1240, for a break through 1.1180, towards 1.1110.
| Resistance | Support | ||
| intraday | intraweek | intraday | intraweek |
| 1.1240 | 1.1570 | 1.1180 | 1.1110 |
| 1.1350 | 1.1820 | 1.1110 | 1.1010 |
USD/JPY
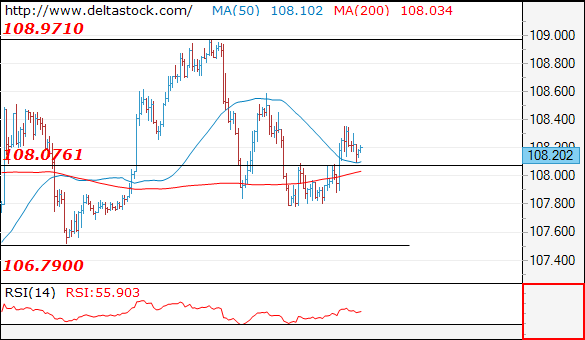
Current level - 108.20
While 108.10 static support holds, there is still a risk of a short-lived rise to 108.60 before drowning towards 107.50.
| Resistance | Support | ||
| intraday | intraweek | intraday | intraweek |
| 108.60 | 109.80 | 108.10 | 106.70 |
| 109.00 | 112.40 | 107.50 | 104.50 |
GBP/USD
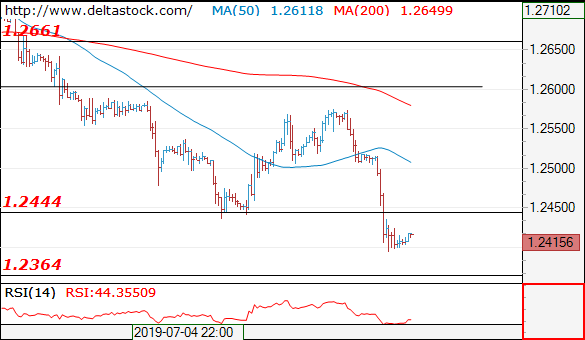
Current level - 1.2415
The test of 1.2440 was successful and the bias is bearish, for 1.2360. Initial resistance lies at 1.2450, followed by 1.2500.
| Resistance | Support | ||
| intraday | intraweek | intraday | intraweek |
| 1.2500 | 1.2660 | 1.2360 | 1.2360 |
| 1.2660 | 1.2890 | 1.2220 | 1.2110 |