Sample Category Title
WTI Futures Find Resistance At 23.6% Fibo, ‘Golden Cross’ Completed
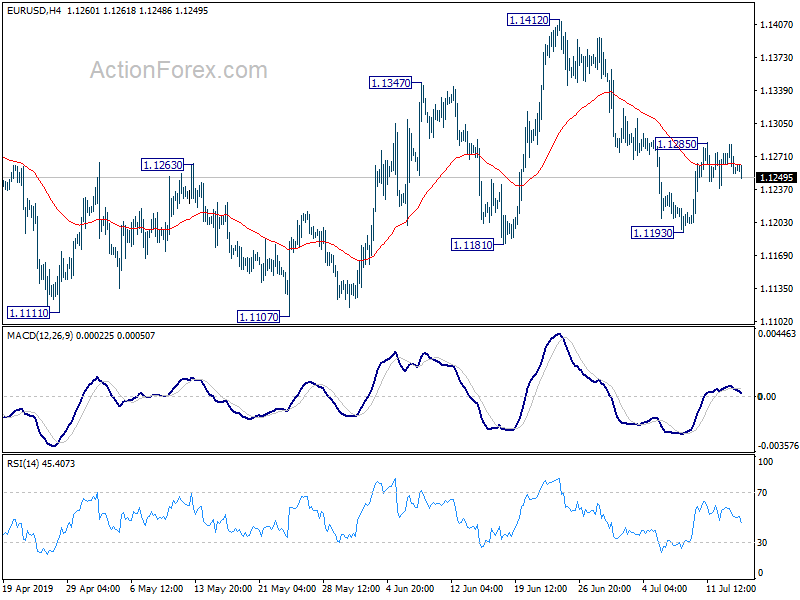
WTI crude oil futures recorded an upside rally last week, but this week the price is on the backfoot after the bounce off the significant barrier of the 23.6% Fibonacci level of the upward wave from 42.50 to 66.60 near 60.90. The technical indicators fail to give clear direction as the MACD is flattening in the positive territory, while the RSI is sloping marginally up. It is worth mentioning that the short-term 20-day simple moving average (SMA) completed a ‘golden cross’ with the long-term 200-SMA.
If the moving averages prove to be strong support to the price near 58.00, immediate resistance is being provided by the 23.6% Fibo of 60.90. Should prices run higher again, the next level would likely come from the 64.00 handle, registered on May 20.
In case of a downward attempt again, oil prices would likely meet support at the 38.2% Fibo of 57.35, before touching the 40-day SMA currently at 56.50 and the 56.00 psychological level. A break below this barrier would open the way towards the 50.0% Fibonacci region around the 54.80 support hurdle.
In the short-term, if the price drops below the five-month low of 50.60, it would switch the bias back to negative, increasing speculation for a test of the one-and-a-half month low of 42.50. Presently, the oil market seems to be cautiously positive, but traders should wait for a daily close above the 23.6% Fibo mark.
GBPUSD 1.2530 Key
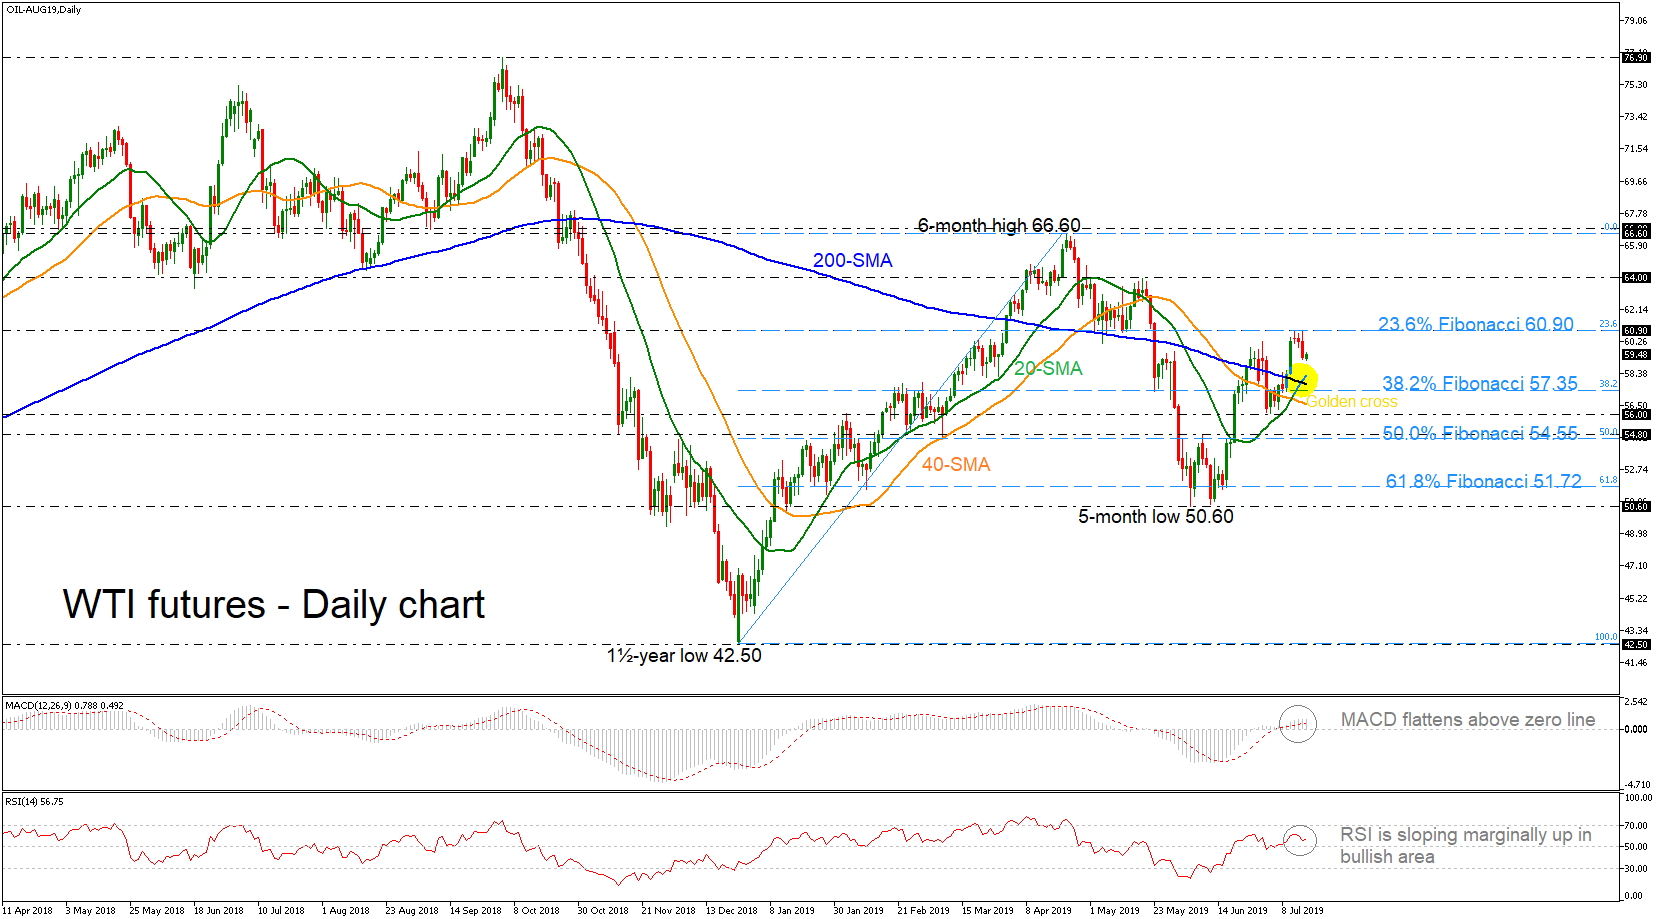
The British pound is struggling to recover higher against the US dollar, ahead of the release of key employment and wage data from the UK economy this morning. The GBPUSD pairs weekly pivot point, at 1.2530 is the key level to watch for signs of a directional bias. A lack of interest to hold the GBPUSD pair above the 1.2530 level may prompt a rebound back towards the 1.2580 area.
The GBPUSD pair is only bullish while trading above the 1.2530 level, key resistance is found at the 1.2580 and 1.2610 levels.
If the GBPUSD trades below the 1.2530 level, key support is located at the 1.2505 and 1.2470 levels.
EUR/USD Daily Outlook
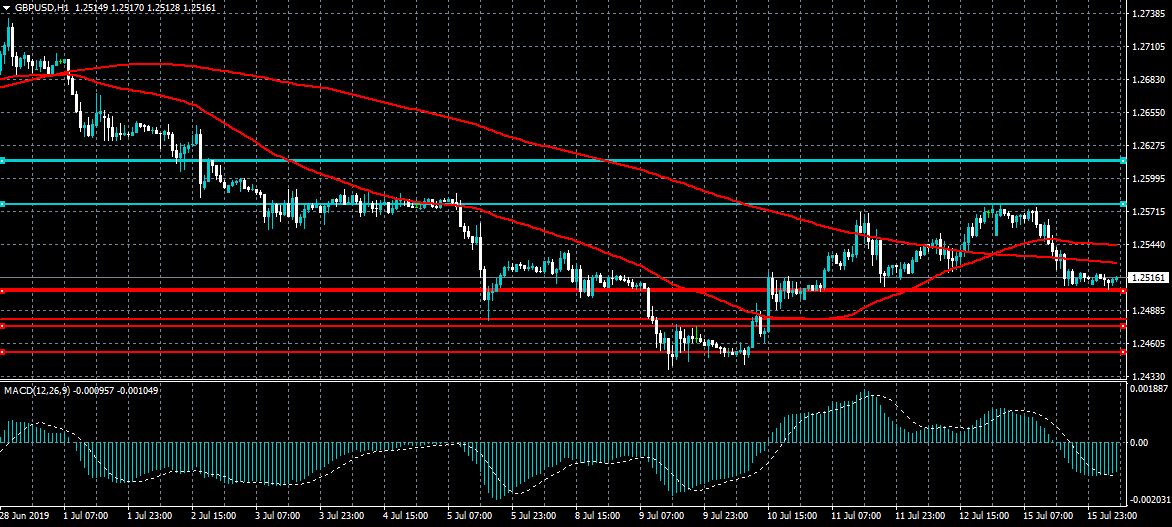
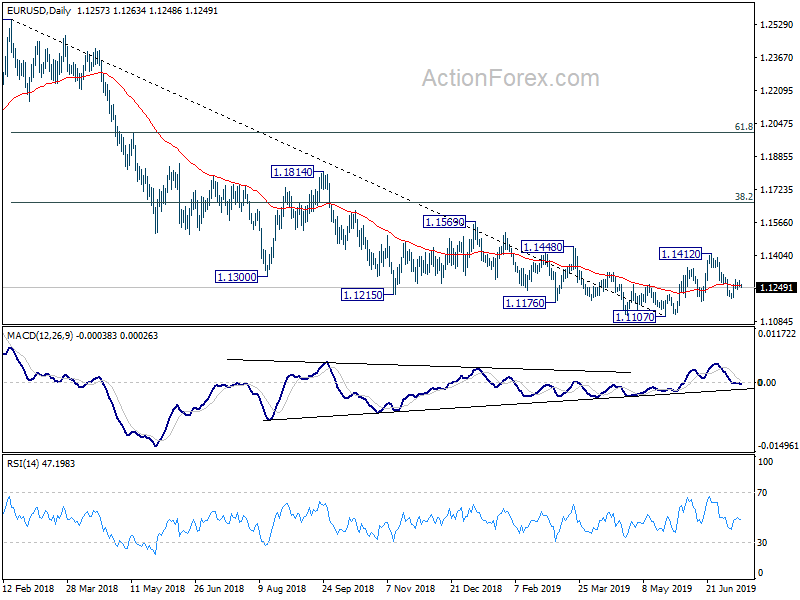
Daily Pivots: (S1) 1.1246; (P) 1.1265; (R1) 1.1277; More...
Intraday bias in EUR/USD remains neutral at this point but further rise remains mildly in favor. On the upside, above 1.1285 will extend the rise from 1.1193 to 1.1412 resistance next. On the downside, below 1.1193 will resume the fall from 1.1412 to retest 1.1107 low.
In the bigger picture, bullish convergence condition in daily and weekly MACD suggests that 1.1107 is a medium term bottom. However, rejection by 55 EMA retains medium term bearish. Outlook will be neutral for now. On the downside, break of 1.1107 will resume the down trend from 1.2555 (2018 high) to 78.6% retracement of 1.0339 to 1.2555 at 1.0813. Meanwhile, break of 1.1412 will resume the rebound to 38.2% retracement of 1.2555 to 1.1107 at 1.1660.
EURUSD Higher High Needed
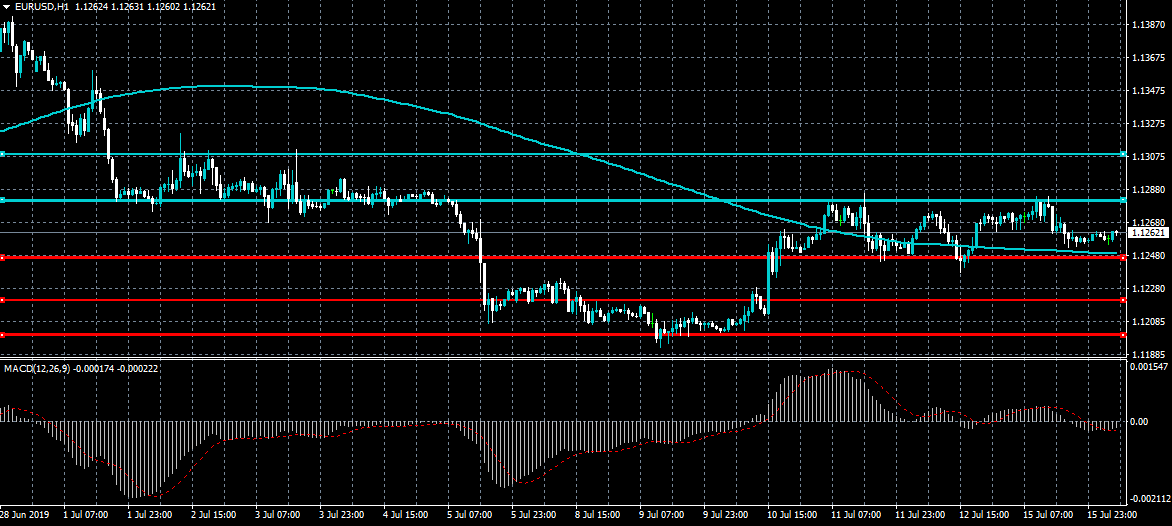
The euro is trading above the 1.1250 level against the US dollar, with the pair remaining contained in a relatively narrow trading range since last Wednesday. Bulls need to break above the 1.1285 level, to encourage a key technical test of the 1.1310 level. Continued weakness under the 1.1248 level could prompt EURUSD bears to test towards the important 1.1220 support level.
If the EURUSD pair trades below the 1.1248 level, key support is found at the 1.1220 and 1.1200 levels.
If bulls break the 1.1285 level, the EURUSD pair could trade towards the 1.1310 and 1.1355 levels.
ETHUSD $220.00 Key Level To Watch
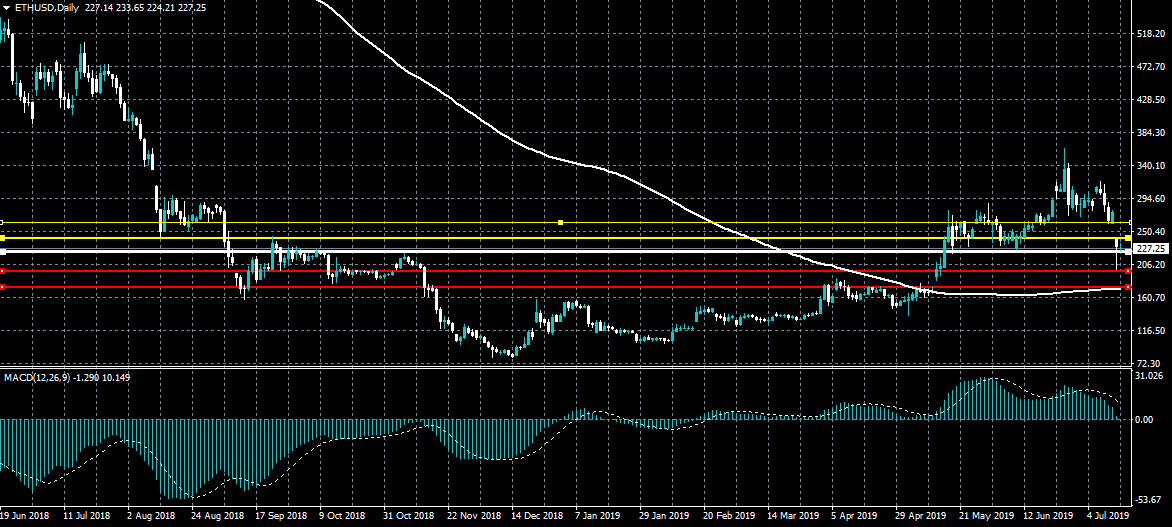
Ethereum is attempting to recover earlier losses after the second largest cryptocurrency found strong technical support from just above the $200.00 level. Further technical weakness in the ETHUSD pair should be expected if sellers keep price below the $220.00 support level. Overall, a major test of the Ethereum’s 200-day moving average, just above the $170.00 level, appears likely at some point.
If the ETHUSD pair trades below the $220.00 level, key support is found at the $200.00 and $170.00 levels.
If the ETHUSD pair trades above the $220.00 level, key resistance is found at the $235.00 and $255.00 levels.
Aussie Declines After RBA Signals More Rate Cuts Possible
The Australian dollar declined slightly after the RBA released its minutes for the meeting held on July 2nd. In the meeting, the RBA slashed interest rates by 25 basis points for the second consecutive month. In the minutes, the members said that they were prepared to slash rates again with the goal of supporting the economy. Officials argued that low interest rates would provide more jobs to Australians and assist with achieving more assured progress towards the inflation target. Yesterday, the Australian dollar rose shortly after China released its GDP data, which implied that the country could be forced to increase its stimulus.
The New Zealand dollar rose after the country released its inflation data. In the second quarter, consumer prices increased to an annualized rate of 1.7% from 1.5% in the previous month. This was in line with expectations. On a QoQ basis, the CPI increased from 0.1% to 0.6%. The New Zealand economy mostly depends on the amount of goods it exports. In recent data, the country’s economy expanded by 2.5%, while the unemployment rate declined to 4.2% from the previous 4.3%.
Today, investors will receive the employment numbers from the UK, where the unemployment rate is expected to remain unchanged at 3.8%. The claimant count is expected to decline from 23.2k to 18.9k while the average earnings index plus bonus is expected to remain unchanged at 3.1%. In Germany, ZEW will release its current conditions and economic sentiment data. From the US, investors will receive the retail sales, export and import price data and statements from Fed officials like Bostic, Browman, and Powell. Further, there will be important earnings releases today such as those from Goldman Sachs, Morgan Stanley, and Johnson & Johnson.
EUR/USD
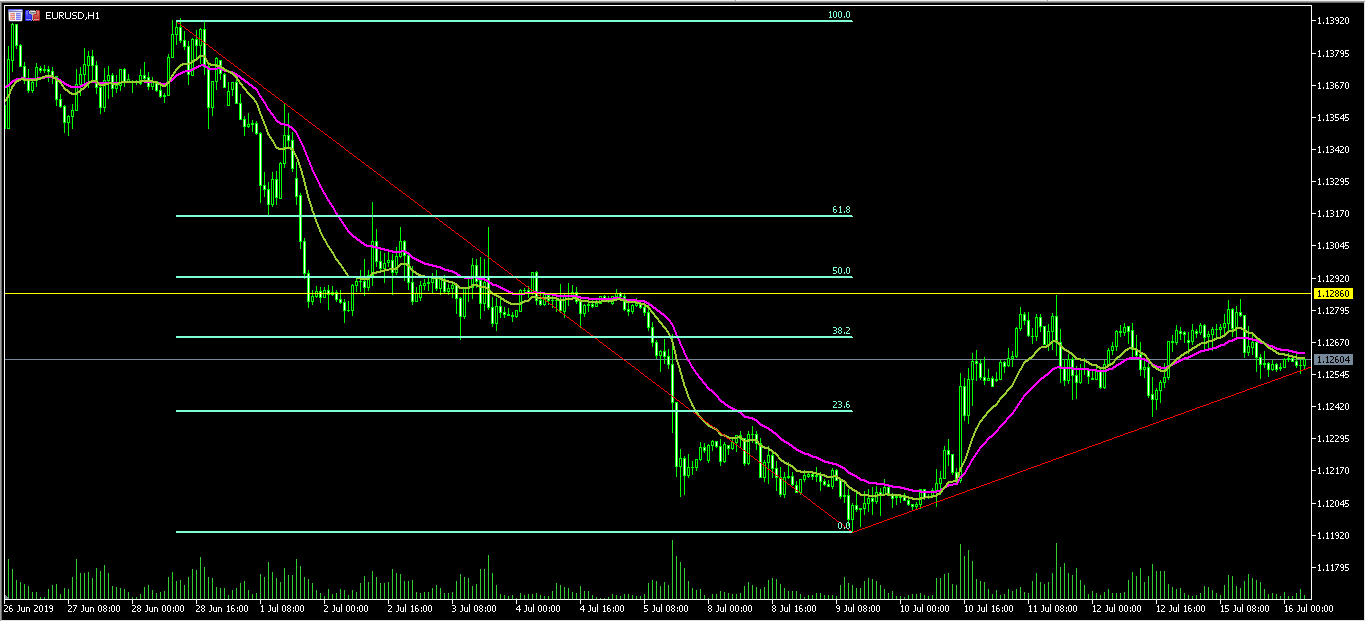
The EUR/USD pair declined in the US session yesterday. In the Asian session, the pair remained unchanged and is currently trading at 1.1260. On the hourly chart, this is slightly below the 38.2% Fibonacci Retracement level and along the 21 and 14-day moving averages. The pair has formed an ascending triangle pattern as shown below. With major news expected from Europe and the Fed, the pair will likely experience a major upward or downward trend today.
AUD/USD
The AUD/USD pair moved slightly lower and is trading at 0.7035, which is lower than yesterday’s high of 0.7043. On the hourly chart below, this price is along the shorter-term 21-day EMA and slightly above the longer-term 42-day EMA. The RSI has moved slightly lower from the overbought level of 70 to the current 55. The pair will likely retest the 61.8% Fibonacci Retracement level of 0.7000.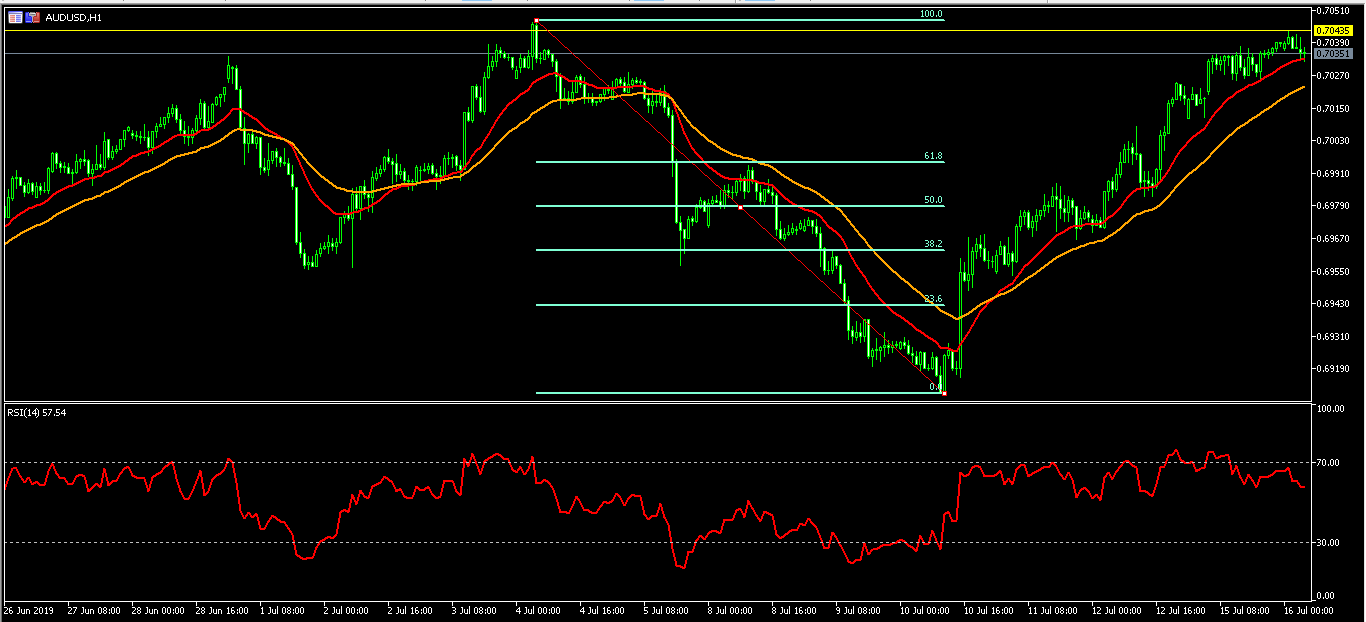
NZD/USD
The NZD/USD pair rose after New Zealand released its inflation numbers. The pair is now trading at 0.6735, which is the highest level since April 18. On the daily chart below, the price is slightly above the 21-day and 42-day moving averages while the RSI has climbed to the current level of 42. It’s likely that the pair will continue moving higher, to test the important resistance level of 0.6940.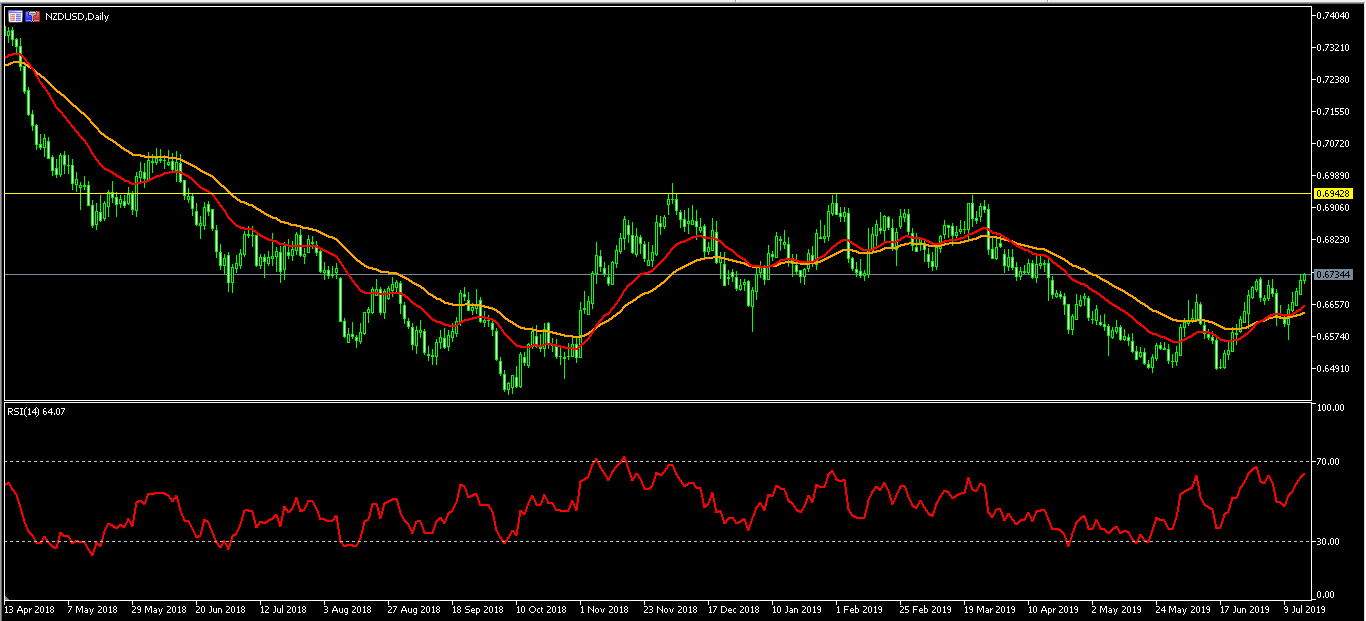
GBP/USD Daily Outlook
Daily Pivots: (S1) 1.2491; (P) 1.2535; (R1) 1.2559; More....
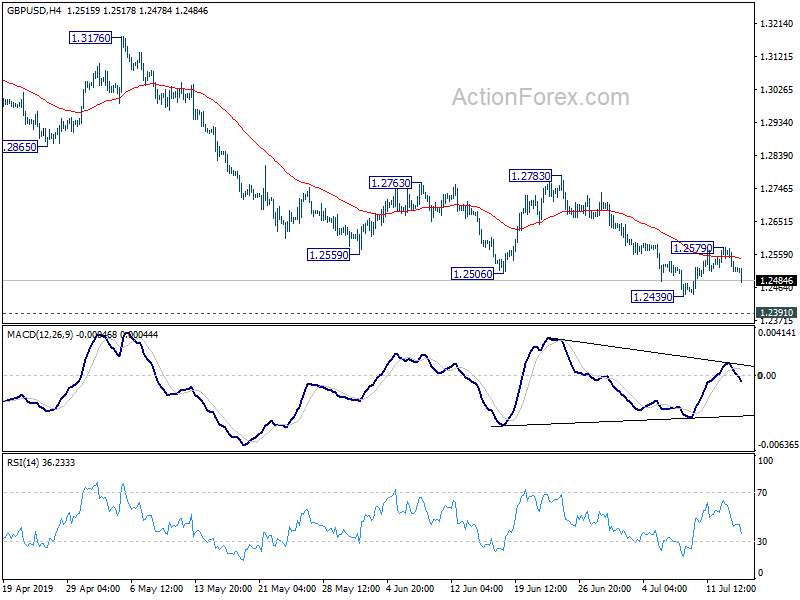
Intraday bias in GBP/USD remains neutral for the moment. Consolidation from 1.2439 might extend. But in case of another rise, upside should be limited below 1.2783 resistance to bring fall resumption. On the downside, break of 1.2439 would resume the decline from 1.3381 to retest 1.2391 low. Firm break there will resume larger down trend.
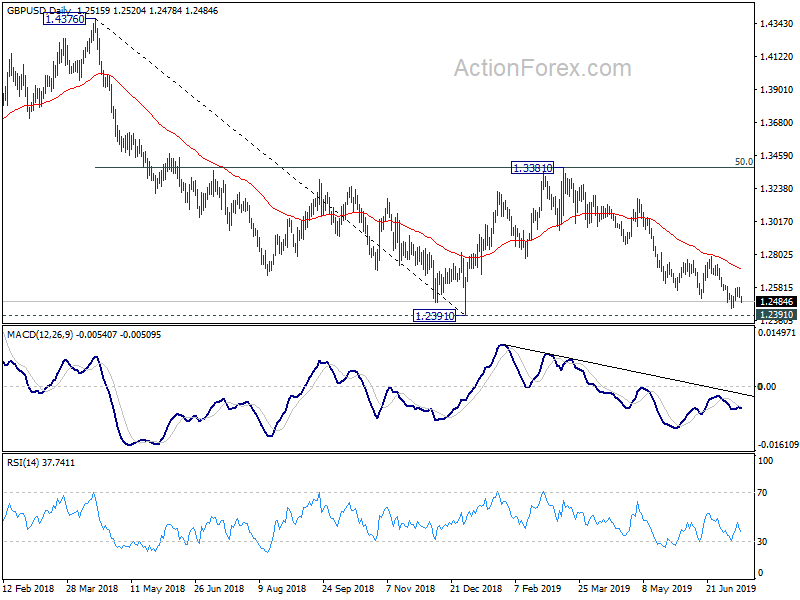
In the bigger picture, down trend from 1.4376 (2018 high) is still in progress. Break of 1.2391 would target a test on 1.1946 long term bottom (2016 low). For now, we don't expect a firm break there yet. Hence, focus will be on bottoming signal as it approaches 1.1946. In any case, medium term outlook will stay bearish as long as 1.3381 resistance holds, in case of strong rebound.
USD/CHF Daily Outlook
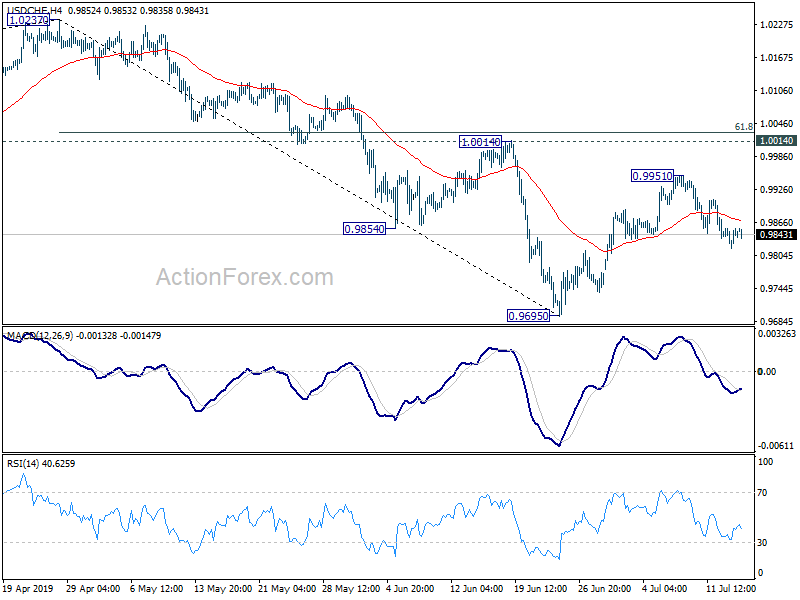
Daily Pivots: (S1) 0.9824; (P) 0.9839; (R1) 0.9861; More...
USD/CHF's corrective rebound from 0.9695 should have completed at 0.9951, after rejection by 55 day EMA. Deeper fall should be seen back to retest 0.9695 low first. On the upside, above 0.9951 will extend the rebound from 0.9695. In that case, upside should be limited by 61.8% retracement of 1.0237 to 0.9695 at 1.0030.
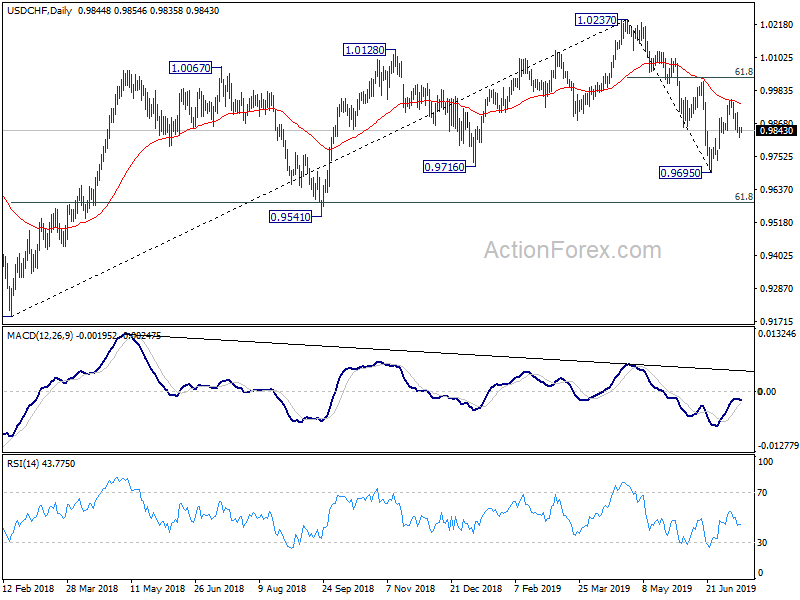
In the bigger picture, up trend from 0.9186 (2018 low) should have completed at 1.0237 already. Deeper decline would be seen to 61.8% retracement of 0.9186 to 1.0237 at 0.9587 and below. For now, USD/CHF is seen as in long term range pattern between 0.9186 and 1.0342. Hence, we'd pay attention to bottoming signal below 0.9587. However, sustained break of 1.0014 will revive medium term bullishness and turn focus back to 1.0237 high.
USD/JPY Daily Outlook
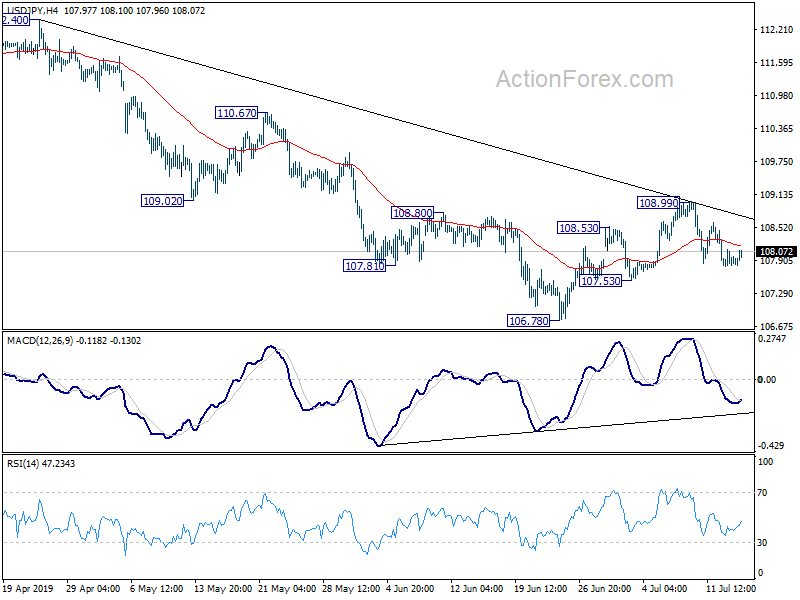
Daily Pivots: (S1) 107.77; (P) 107.94; (R1) 108.08; More...
USD/JPY is losing some downside momentum as seen in 4 hour MACD. But outlook remains unchanged for now. Corrective rebound from 107.54 should have completed at 108.99, after rejection by 55 day EMA. Further fall should be seen and break of 107.53 support will likely send USD/JPY through 106.78 to resume the decline from 112.40. This is will remain the preferred case as long as 108.99 resistance holds.
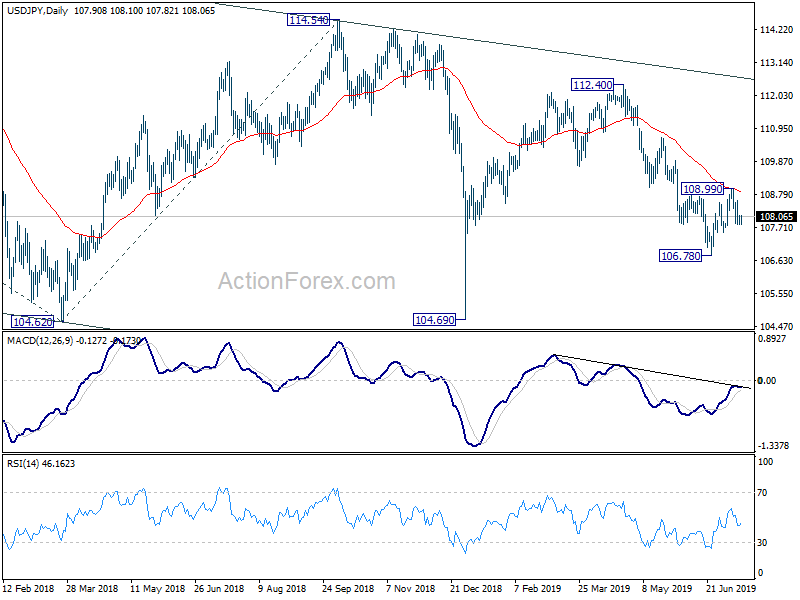
In the bigger picture, decline from 118.65 (Dec 2016) is still in progress, with the pair staying inside long term falling channel. Break of 104.62 will target 100% projection of 118.65 to 104.62 from 114.54 at 100.51. For now, we'd expect strong support above 98.97 (2016 low) to contain downside to bring rebound. In any case, break of 112.40 is needed to the first serious sign of medium term bullishness. Otherwise, further decline will remain in favor in case of rebound.
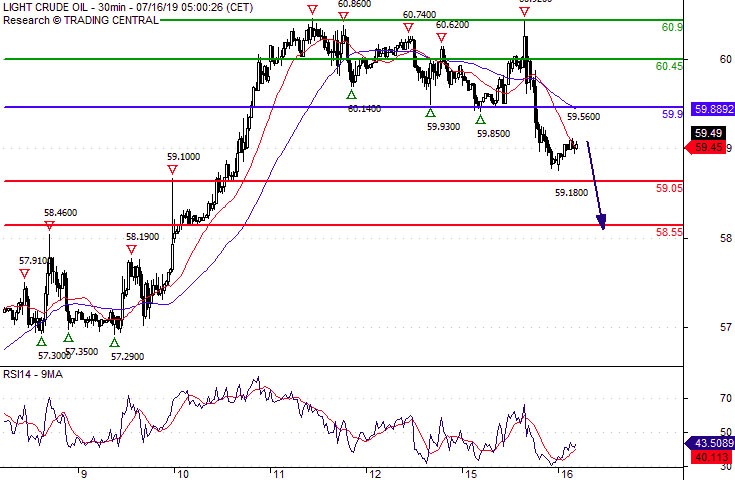
Crude Oil 58.55 Expected
Pivot (invalidation): 59.90
Our preference Short positions below 59.90 with targets at 59.05 & 58.55 in extension.
Alternative scenario Above 59.90 look for further upside with 60.45 & 60.90 as targets.
Comment The RSI is bearish and calls for further downside.