Sample Category Title
GBPUSD Weakens Towards Key Support
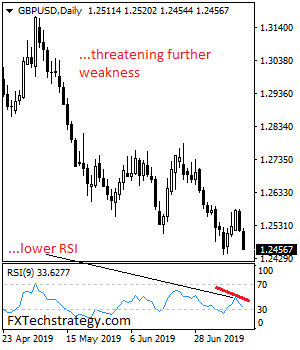
GBPUSD weakens towards key support located at 1.2439/00 levels. Support comes in at 1.2350 with a turn below that level shifting focus to the 1.2300 level. Further down, support resides at the 1.2250 level where a break will turn attention to the 1.2200 level. Further down, support lies at the 1.2150 level. On the upside, resistance stands at the 1.2500 with a turn above here allowing for additional strength to build up towards the 1.2550 level. Further out, resistance stands at the 1.2600 level followed by the 1.2650 level. On the whole, GBPUSD retains its downside pressure short term.
USDJPY Swing Level In Focus
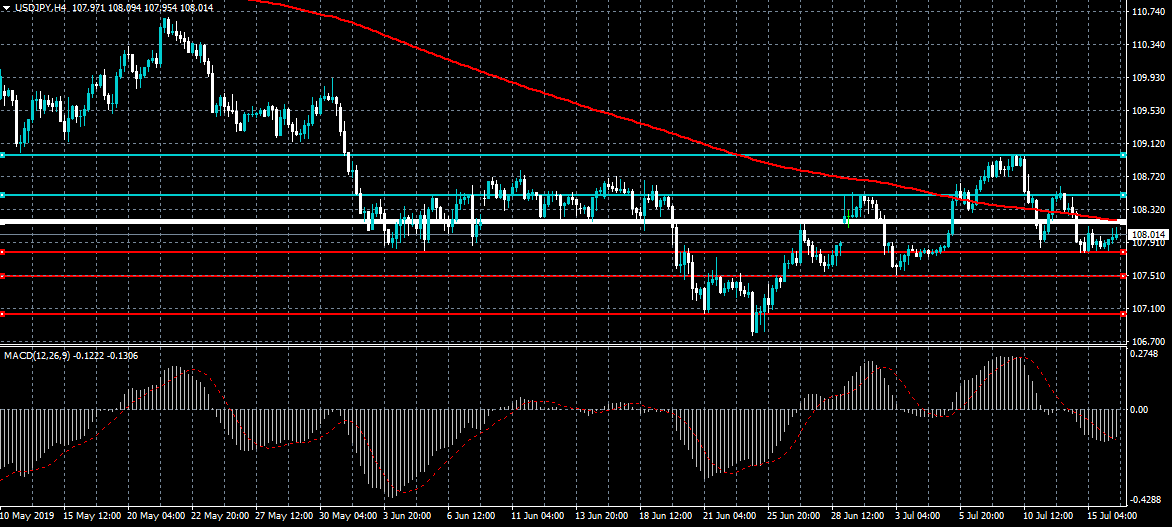
The US dollar is continuing to recover above the 108.00 support level against the Japanese yen as the greenback strengthens ahead of today’s U.S retail sales report. Bulls are increasingly likely to push the USDJPY towards the pairs key weekly pivot point, at the 108.23 level. Bears may look to enter from the weekly pivot, while buyers may attempt to play a sustained breakout above this key area.
The USDJPY pair is only bullish while trading above the 108.23 level, key technical resistance is found at the 108.45 and 108.60 levels.
If the USDJPY pair fails to hold above the 108.23 level, sellers may test back towards the 107.80 and 107.00 levels.
GBPUSD Recovery Still Possible
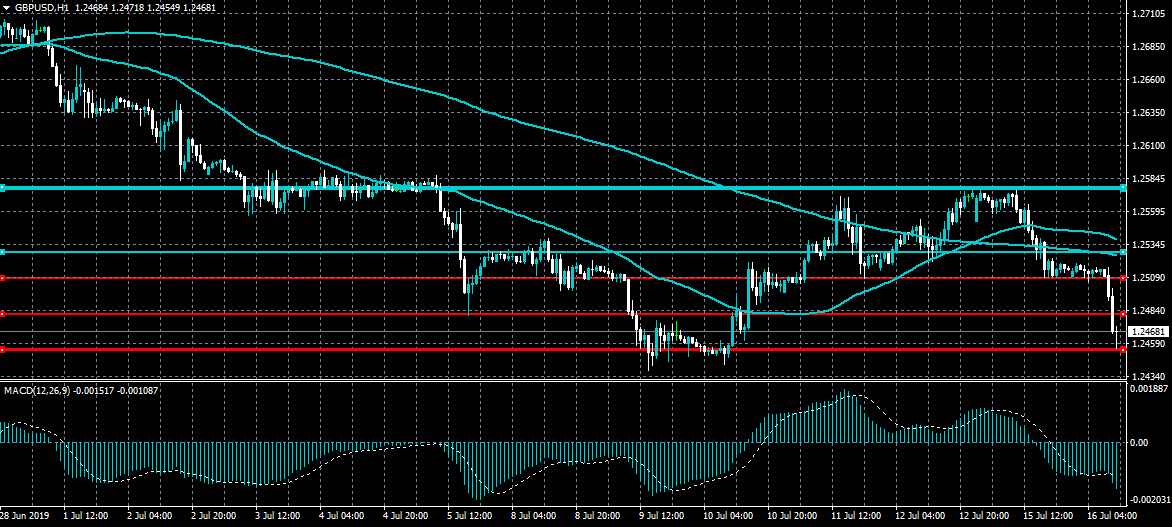
The British pound has slipped back towards its yearly trading low against the US dollar, after the sellers broke through the 1.2510 support barrier during the European trding session. However, the bullish inverted head and shoulders pattern on the four-hour time still remains valid. A further bearish decline below the 1.2450 support level may trigger an extended down move towards the 1.2410 level.
The GBPUSD pair is only bullish while trading above the 1.2510 level, key resistance is found at the 1.2530 and 1.2580 levels.
If the GBPUSD trades below the 1.2510 level, key support is located at the 1.2550 and 1.2410 levels.
Morgan Stanley Stock Moves Above 200-Day Simple Moving Average
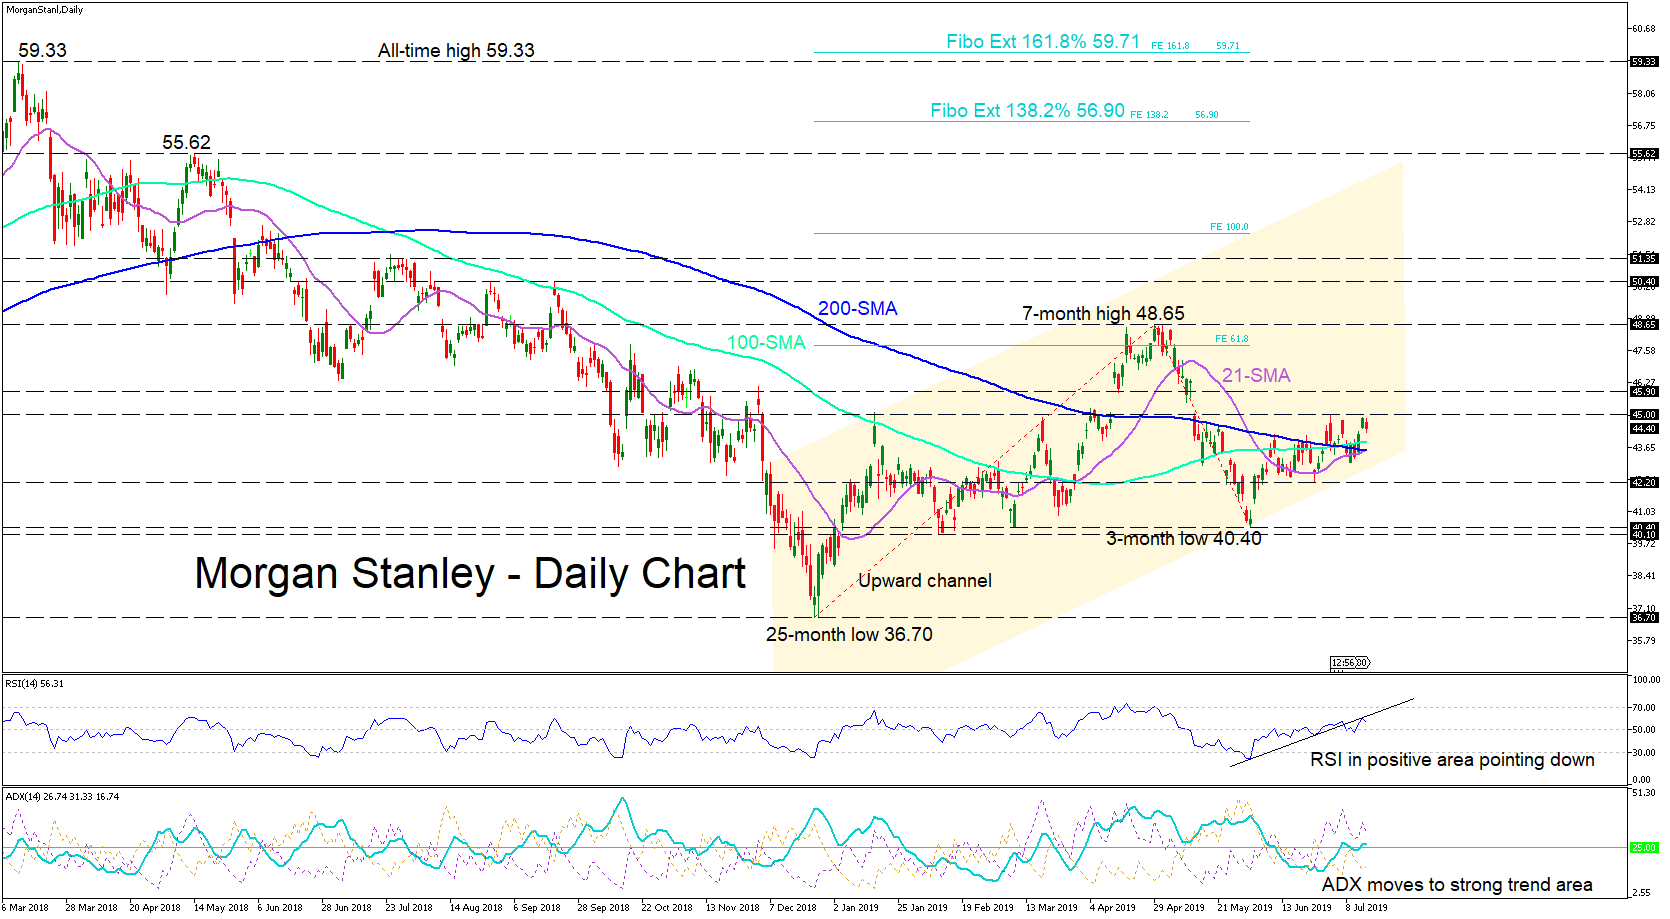
Morgan Stanleys' stock has been incrementally following the north road since the end of December, and in the last month has risen from a three-month low of 40.40 to face the ultimate battle with the 200-day simple moving average (SMA). Presently, it is facing short-term resistance at the previous weeks' break high above the 200-day hurdle of 45.00.
Momentum cooled after the 200-day break, as also shown by the RSI as it points down in the positive area, whereas the ADX recently moved to areas of trend kickoff. The short-term 21-SMA has started to cross the 200-SMA upwards, whereas the long-term 100-SMA is already above it and headed further north.
On the way up, a break of the 45.00 immediate resistance and latter 45.90 obstacle, could produce a test of the seven-month high of 48.65. A bullish continuation could then breed levels around 50.40 – 51.35, before any consideration of a further bolt to catalyze the test of the Fibonacci extensions of 138.2% and 161.8%, close to the all-time high of 59.33.
Downwards, a 45.00 resistance hold could prompt an immediate test of the 100- and 200-day SMAs around 43.85 – 43.60. Fracturing the support of 42.20 would be next before a shift to a bearish bias. A breach of the three-month lows next to 40.40 – 40.10 could then be considered.
Overall, the short- and medium-term bullish bias outweighs the risk to the down move.
CADJPY Lacks Direction In Short And Long Terms
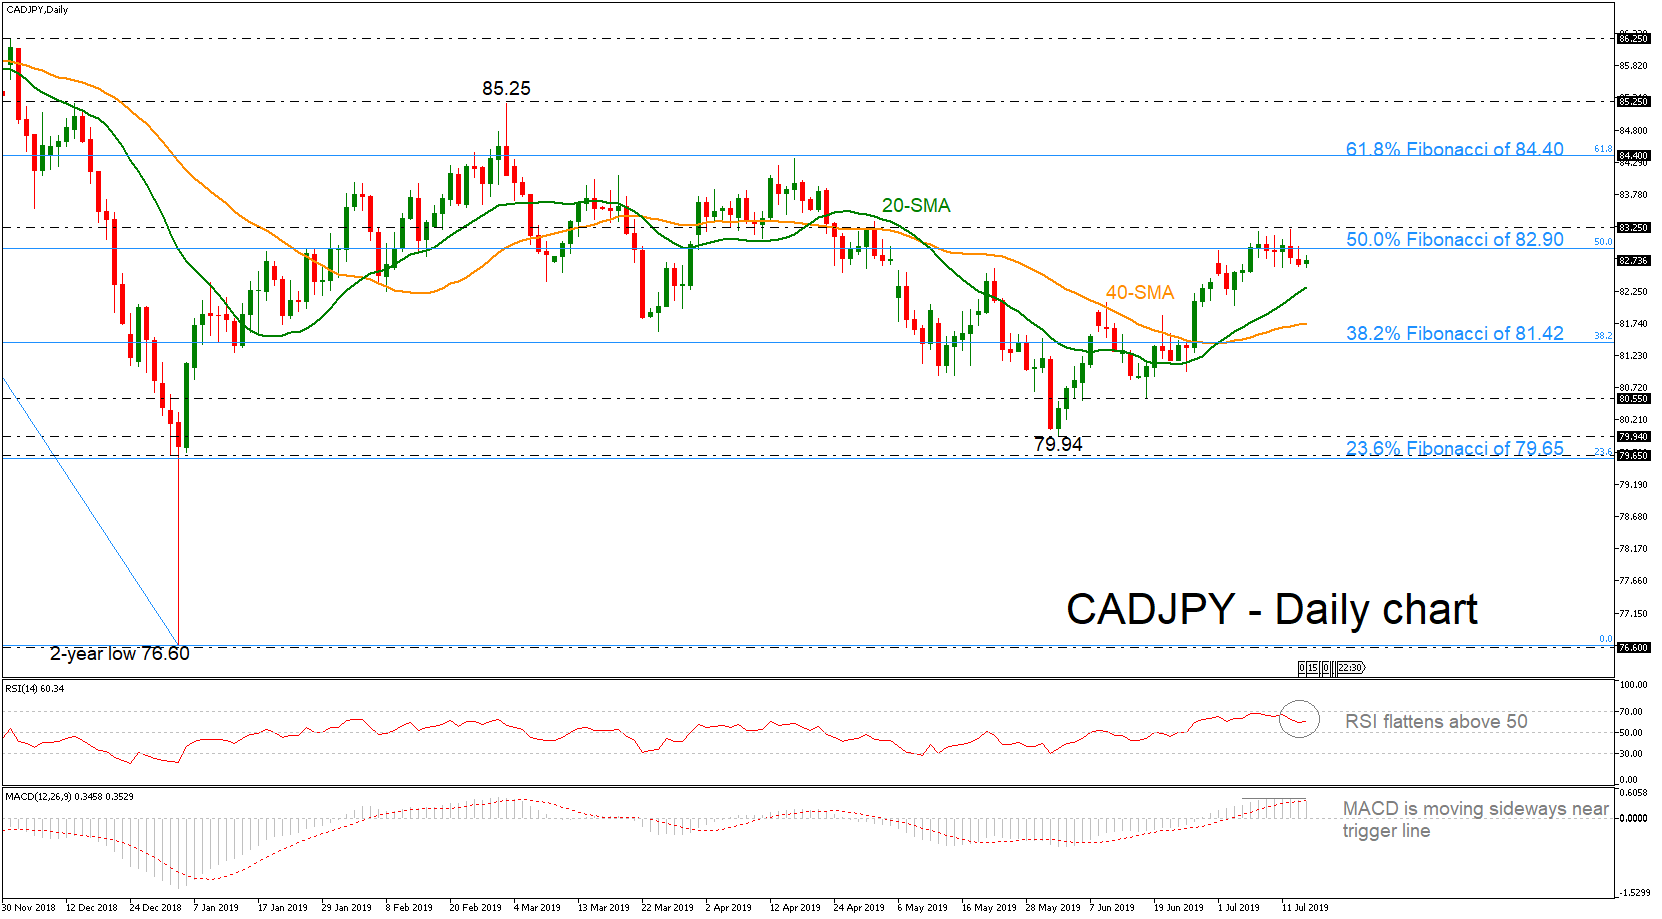
CADJPY is hovering near the 50.0% Fibonacci retracement level of the downleg from 89.25 to 76.60. After the rebound on the two-year low of 76.60, the pair has been lacking direction, confirmed by the technical indicators. The RSI is flattening in the positive area, while the MACD is moving sideways near the trigger line.
An advance above the 50.0% Fibonacci of 82.90 and the 83.25 resistance could open the door for bullish actions until the 61.8% Fibonacci region, which overlaps with the 84.40 resistance level, registered on April 17.
A step lower could find support around the 20- and then at the 40-simple moving averages (SMAs) currently at 82.30 and 81.72 respectively. More downside pressures could drive the pair towards the 38.2% Fibo of 81.42.
Concluding, a break above the 61.8% Fibo of 84.40 in the near term could change the bearish outlook to bullish. However, in case of a pullback below the 23.6% Fibonacci, this could confirm the long-term negative momentum.
The US Dollar Is Condolidating
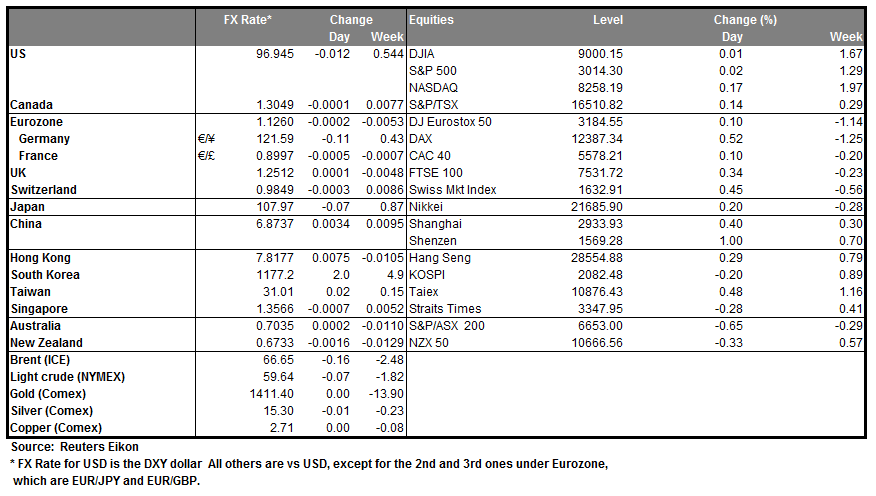
The US dollar is changing slightly against a basket of major currencies. The US dollar index (#DX) closed trading session with a slight increase (+ 0.13%) yesterday. Trading activity and volatility in the foreign exchange market declined as investors focused on the publication of economic releases, which may signal further adjustments in interest rates of global Central Banks. Today, financial market participants will assess important statistics from the UK, Germany and the US.
During the Asian trading session, the New Zealand consumer price index has been published, which has met market expectations and counted to 0.6% (q/q). The British pound is still under pressure due to the uncertainty concerning Brexit. The main contenders for the post of leader of the Conservative Party, Boris Johnson and Jeremy Hunt, claimed that they were ready to the no-deal Brexit.
The "black gold" prices are stable. At the moment, futures for the WTI crude oil are testing $59.85 per barrel. At 23:30 (GMT+3:00) API weekly crude oil stock will be published.
Market Indicators
- Yesterday, the bullish sentiment was observed in the US stock markets: #SPY (+0.03%), #DIA (+0.08%), #QQQ (+0.32%).
- The 10-year US government bonds yield fell slightly. Currently, the indicator is at the level of 2.08-2.09%.
The News Feed on 2019.07.16:
- Data on the UK labor market at 11:30 (GMT+3:00);
- German ZEW economic sentiment at 12:00 (GMT+3:00);
- Statistics on retail sales in the US at 15:30 (GMT+3:00).
Brexit Weighs On The GBP
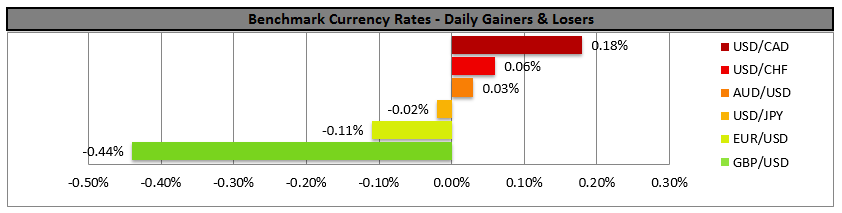
GBP/USD dropped yesterday as Brexit weighed on the pound once again yesterday, keeping any gains temporary and in check. On the monetary front, poor data and the possibility of the BoE cutting rates instead of raising them (as was previously expected) seems to also, weigh on the pound. We expect the release of May’s UK employment data today to be closely watched and could affect the pound’s direction. In the UK political scene the prospect of Boris being UK’s next Prime Minister does not seem to be thrilling the markets as the 22nd of July nears. Analysts have also noted that Brexit may also act as a deadweight of the EUR as well as the issue drags on. Media mentioned that Brexit talks seem to get more hostile and note that a meeting between negotiators last week was one of the worst since 2016. Cable dropped yesterday the European session, not able to clearly break the 1.2560 (R1) resistance line. As the pair broke the upward trendline incepted since the 10th of July, dropped and later stabilized, we maintain a bias for a sideways motion, yet the release of the UK employment data for May could provide some volatility. Under certain circumstances the pair could rise somewhat as the US financials to be released today, could weaken the USD side. Should the cable’s long positions be favored by the market, we could see it breaking the 1.2560 (R1) resistance line and aim for the 1.2665 (R2) resistance hurdle. Should the pair come under the selling interest of the market on the other hand, we could see it breaking the 1.2475 (S1) support line and aim for the 1.2375 (S2) support barrier. Please note that should the pair reach (S2) that would be the lowest level for over two years.
Oil prices drop as production in the Gulf of Mexico resumes
Oil prices dropped somewhat on yesterday as oil production in the Gulf of Mexico area has resumed according to media. Oil producers have started to restore of the output that was cut at U.S. Gulf of Mexico platforms ahead of tropical storm Barry. In addition, US shale oil production is expected to rise to record levels boosting supply further. U.S. oil output from seven shale formations is expected to rise to a record 8.55 million bpd, the EIA stated in its monthly drilling productivity report. The increase of the US oil production levels seems to be undermining efforts of Saudi Arabia and Russia to raise prices. We expect market participants to be closely watching the release of the US API weekly crude oil inventories figure. WTI prices dropped yesterday and during yesterday’s late American session tested the 59.50 (S1) support line, without successfully breaking it. As the commodity’s prices bounced on the prementioned support line, we maintain a bias for a sideways scenario for the commodity’s price action. Should the bulls dictate the pair’s direction we could see WTI prices breaking the 61.00 (R1) resistance line and aim for higher grounds. Should the bears finally get the upper hand over WTI’s direction, we could see the commodity’s prices breaking the 59.50 (S1) and aim if not break the 57.70 (S2) support level.
Other economic highlights, today and early tomorrow
Today, during the European session, we get UK’s employment data for May and Germany’s ZEW economic sentiment indicator for July. In the American session we get the US retail sales growth rates for June, as well as the US industrial production growth rate for June. Late in the American session, as already mentioned the API weekly crude oil inventories figure is to be released. Please note that Fed Chair Powell is scheduled to speak today in Paris, at the “Bretton Woods: 75 years later”, however we would not be surprised to see some comments about monetary policy slipping. Also, please note that ECB member Villeroy de Galhau, Atlanta Fed President Bostic, Dallas Fed President Robert Kaplan, Fed Chairman Jerome Powell, Chicago Fed President Charles Evans are also scheduled to speak. On second note, EU Parliament is to vote to confirm Ursula von der Leyen as the new EU Commission president, which under some circumstances could provide some uncertainty for the common currency.
GBP/USD H4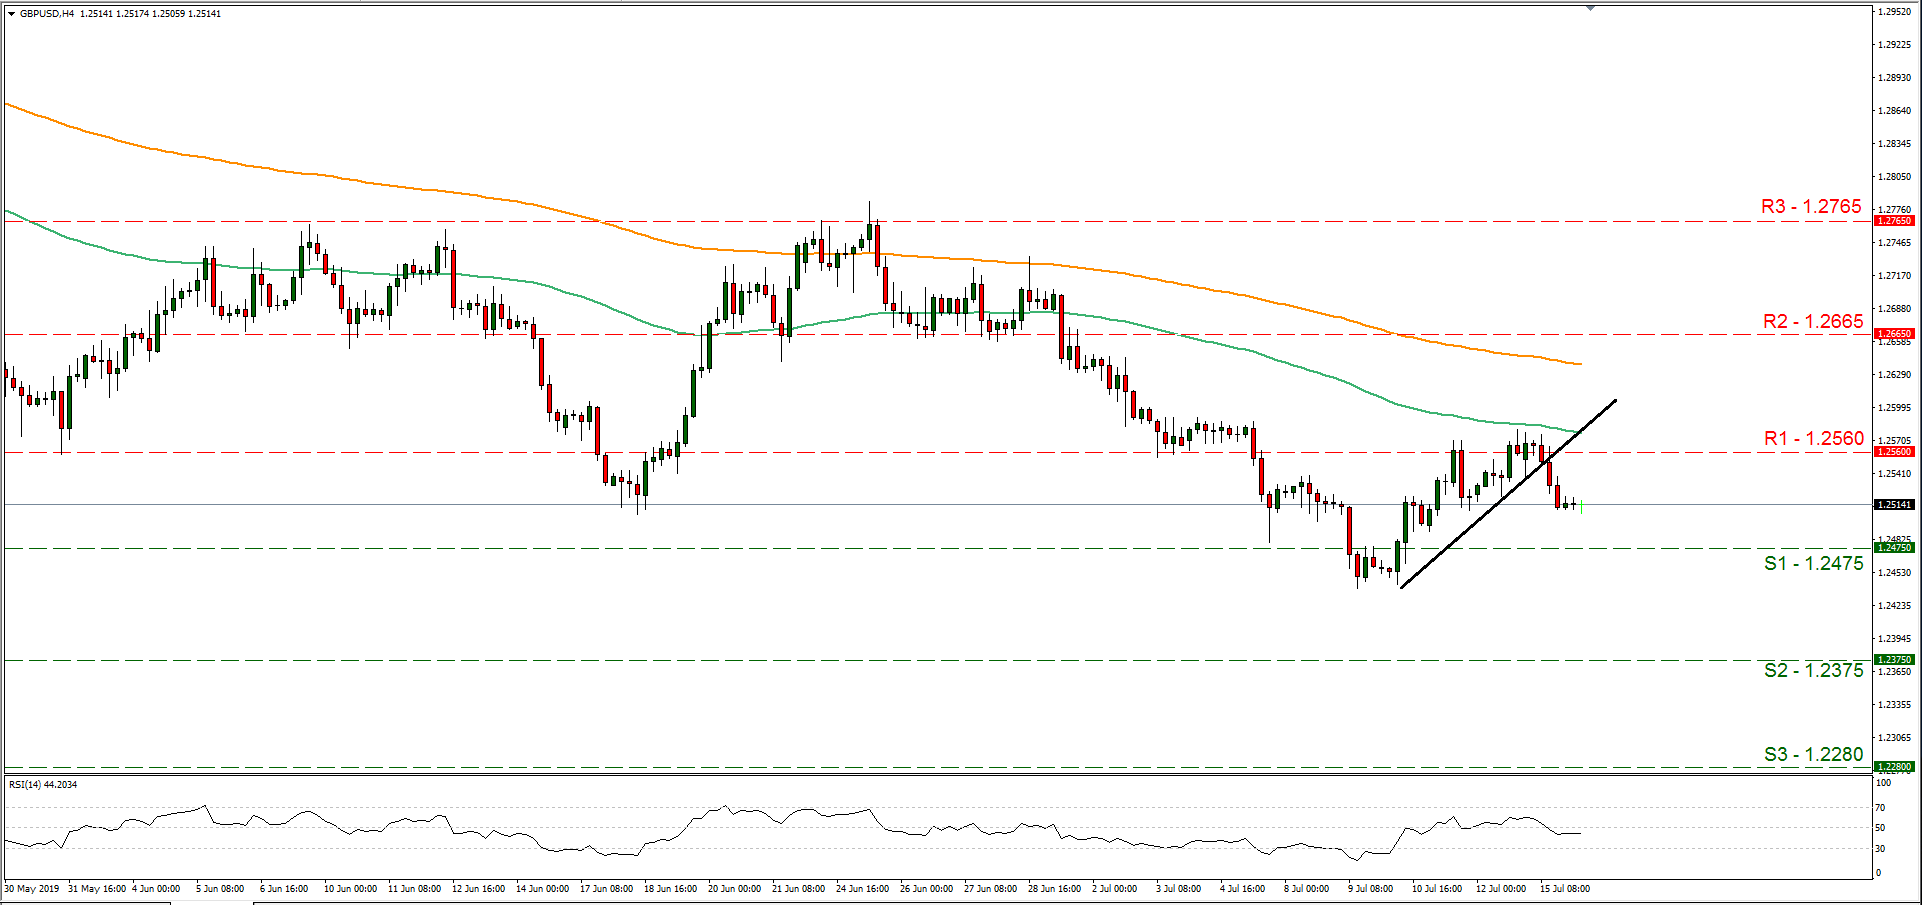
Support: 1.2475 (S1), 1.2375 (S2), 1.2280 (S3)
Resistance: 1.2560 (R1), 1.2665 (R2), 1.2765 (R3)
WTI H4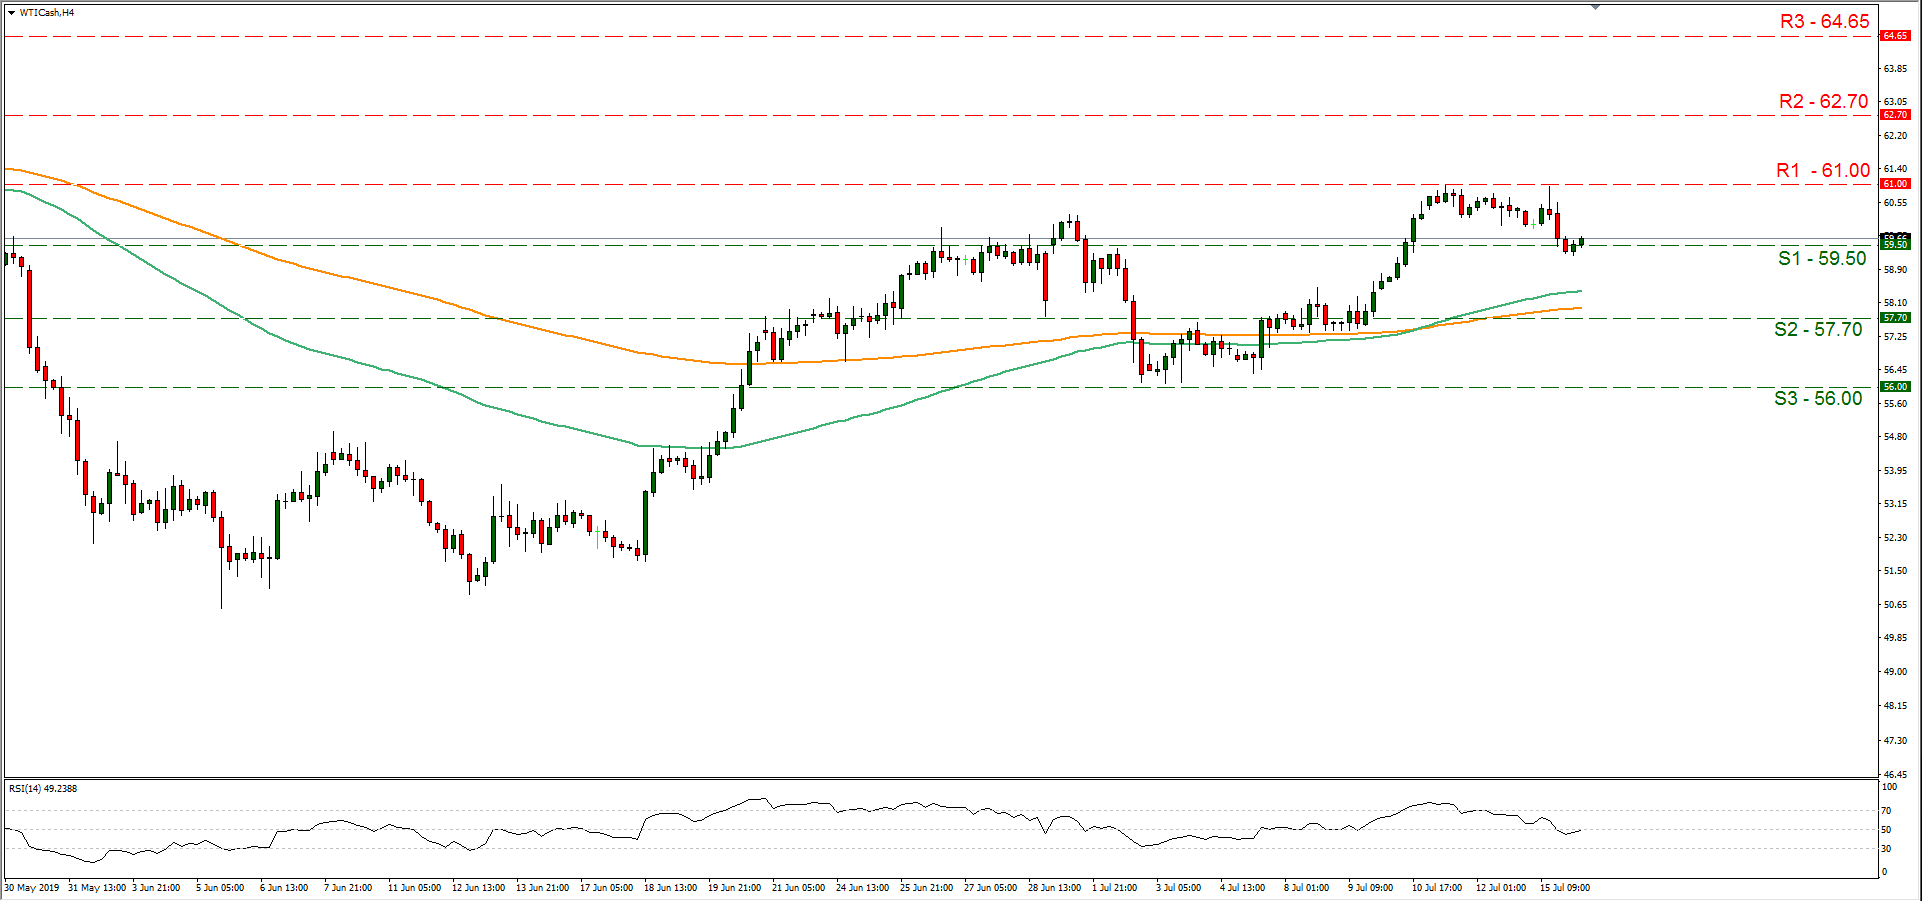
Support: 59.50 (S1), 57.70 (S2), 56.00 (S3)
Resistance: 61.00 (R1), 62.70 (R2), 64.65 (R3)
EUR Indecisive, RBA Minutes
EUR indecisive ahead of European Commission final vote
Things are getting serious for EU top position candidates. Following a month of intense negotiations, the 28 EU national leaders finally came with a final list consisting of Charles Michel as President of the European Council (formally elected), Josep Borrell High Representative for Foreign Affairs, ECB President Christine Lagarde and finally President of European Commission Ursula von der Leyen. Yet the final call gets to members of European Parliament, a vote that is expected to be tight and which puts the single currency in torment. A failure to confirm top leaders would not only be a major blow for the bloc, but also for the ECB ahead of next Thursday monetary policy meeting.
Compromise candidate Ursula von der Leyen final pledge to secure EU top positions will likely be a game changer ahead of final vote gathering from 6 pm that requires the backing of a minimum of 374 votes out of 747, although 400 votes would be appropriate for the majority to be able to pass laws. In the event of rejection by MEPs, an emergency summit should occur next week if the leadership package is not approved, which could potentially trigger a EUR rally amid speculations of a less-dovish ECB head by considering Jens Weidmann as a potential candidate. However, that would likely be a short-term view since a dovish council would have the last word anyway. The task is therefore becoming challenging for outsider candidate Ursula von der Leyen as her promises need to convince far-right and left Eurosceptic parties as well as socialist and liberals without being able to count on the Greens which ruled out any support (~10% of total MEP seats).
EUR/USD is therefore like to remain under pressure short-term. Heading along 1.1230
RBA minutes consolidate dovish bias
Despite a rate cut from the RBA at the beginning of the month July, the Australian dollar reversed momentum following Jerome Powell testimony before the Congress. In fact, G10 commodity currencies outperformed their peers since then with the Kiwi, the Aussie and the NOK rising 1.83%, 1.46% and 1.21%, respectively. Safe-haven currencies were also better bid with the Swissie and yen up 0.94% and 0.71%, respectively.
As mentioned above, on July 2nd, the Reserve Bank of Australia trimmed the Official Cash Rate by 25bps to record low 1% following worries over job market slack and especially the level of underemployment. Indeed, just like his American counterpart, Governor Lowe is committed to use monetary tools not solely to increase price pressure but also to reach full employment.
The minutes were fairly in line with the July statement. More specifically, the minutes highlighted the RBA’s commitment to reduce further the level of interest rates to support growth in employment and incomes and bolster overall economic conditions, with the ultimate goal of lifting inflation back within the 2%-3% target band. All in all, the minutes confirmed the fact that the RBA has a clear dovish bias and will not hesitate to pull the trigger should the conditions justify it. The slowdown of the Chinese economy, together with heightened uncertainty caused by trade tensions across the globe, increase the likelihood of further cut before the end of the year. In addition, the Fed and ECB have already signalled that they are going down that road; there is no doubt the RBA would mimic them. AUD/USD is down 0.10% on Tuesday morning at around $0.7033. Early this morning, the pair tested the resistance that lies at 0.7048 (high from July 4th) and faced rejection. We believe that the slowing Chinese economy, together with the fact that the RBA a much more room to manoeuvre in monetary terms than most of its peers, will prevent the Aussie to extend gain significantly.
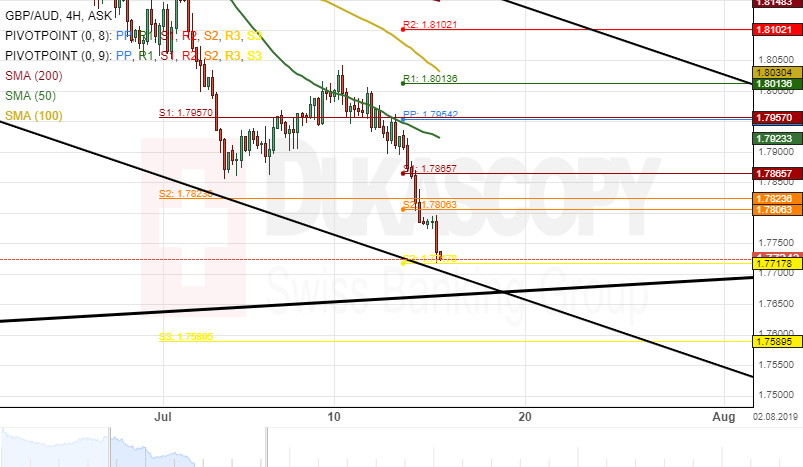
GBP/AUD 4H Chart: Decline Likely To Continue
The British Pound depreciated about 1.40% in value against the Australian Dollar during last week's trading sessions. The currency pair was pressured south by the 50-hour simple moving average.
Most likely, the exchange rate could continue its southern movement until it reaches a support level at 1.7650.
If the support line holds, a potential upside reversal might occur during the following trading sessions.
Meanwhile, technical indicators demonstrate that the currency exchange rate will continue to edge lower in the short-term.
GBP/CAD 4H Chart: Bears Market
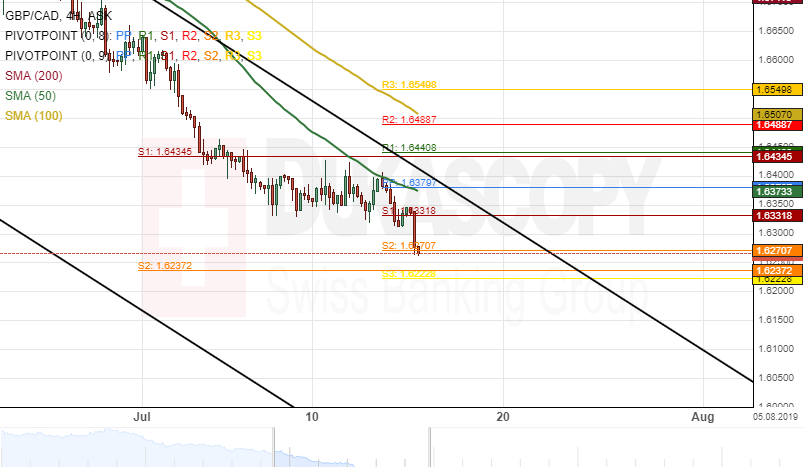
The Pound Sterling traded sideways against the Canadian Dollar during last week's trading sessions. The 50-hour simple moving average provided resistance for the pair at 1.6434.
Everything being equal, it is likely that the GBP/CAD currency pair continues its decline within this week's trading sessions. The possible target for bearish traders will be near a support cluster formed by the combination of the weekly and the monthly PPs at 1.6237.
If the support cluster as mentioned earlier holds, a reversal north could occur during next week's trading sessions.