Sample Category Title
GBP/USD Daily Outlook
Daily Pivots: (S1) 1.2490; (P) 1.2530; (R1) 1.2568; More....
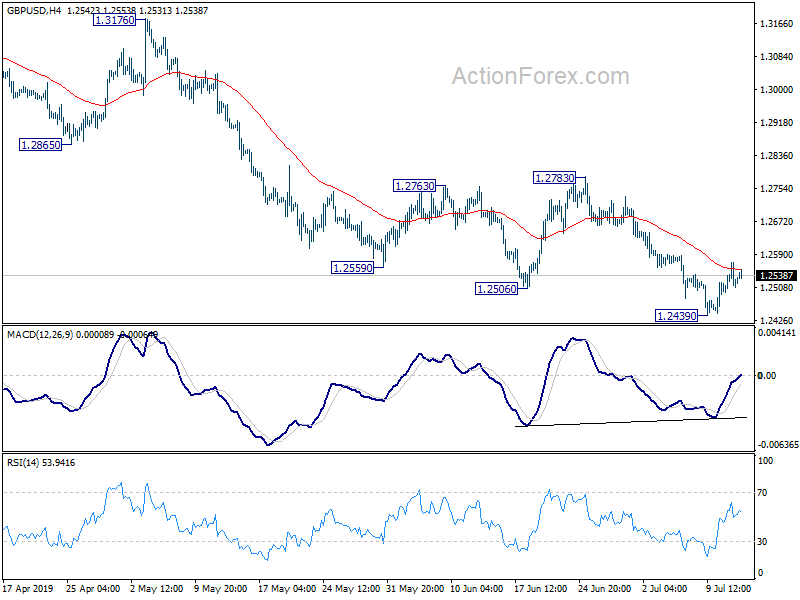
No change in GBP/USD's outlook. Corrective recovery from 1.2439 might extend higher. But upside should be limited well below 1.2783 resistance to bring fall resumption. On the downside, break of 1.2439 would resume the decline from 1.3381 to retest 1.2391 low. Firm break there will resume larger down trend.
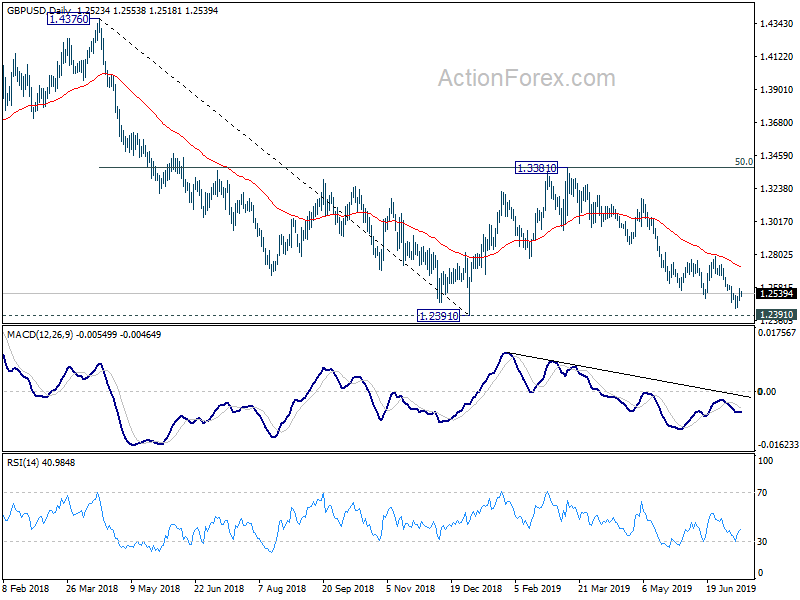
In the bigger picture, down trend from 1.4376 (2018 high) is still in progress. Break of 1.2391 would target a test on 1.1946 long term bottom (2016 low). For now, we don't expect a firm break there yet. Hence, focus will be on bottoming signal as it approaches 1.1946. In any case, medium term outlook will stay bearish as long as 1.3381 resistance holds, in case of strong rebound.
US Market: Leading The Way And In Search Of Support
Markets continue to aggressively play off the idea of a speedy US interest rates reduction and a potential easing of other key CB monetary policy. A cautious attitude on the part of the Central Bank provides visible support to stock indices, as well as returns the demand for currencies of developing countries and raw materials. Despite Powell’s concern about the business environment and the weak reporting of some large companies, the US economy continues to produce strong data, calling into question the need for emergency resuscitation of the economy through the lowering of rates until the end of July.
Yesterday, Core CPI surpassed analysts' expectations due to the annual growth rate of 2.1%, which corresponds to a healthy price rate. As the FxPro analysts mention, in previous years the Fed is actively raising the rate, while the FOMC now seems prepared to cut.
Initial jobless claims have been falling for the third week in a row, returning to the levels near 200K.
Alarms in the US economy are certainly beginning to sound. However, the emergency intervention from the Fed's side will look like unnecessary care, rather than prescribing much-needed medicine. Therefore, it now runs the risk of overheating of the economy.
Stocks
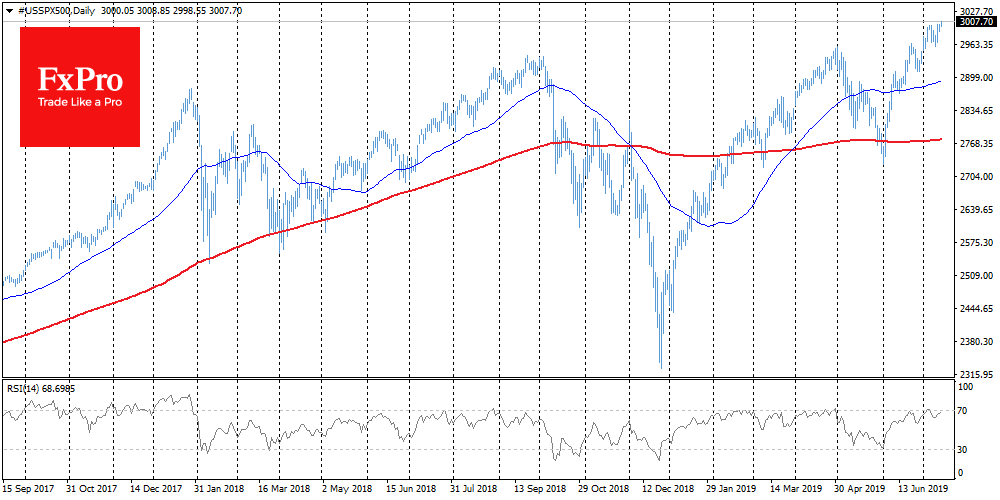
All three key US indices - Nasdaq, S&P500 and Dow Jones - updated their historical highs yesterday. On the one hand, there are doubts about the stock market's stability on the trade conflicts and some disappointing corporate reports. On the other hand, this “fragile” market continues to set the records.
EURUSD
The single currency broke in the downward trend (which had lasted since the beginning of the month) and turned to growth. This is due to the lower interest rates on dollar-denominated debt markets. Strong CPI data brought EURUSD down by 40 points from the levels near 1.1280. However, the investors' positive mood returned the purchases on the pair.
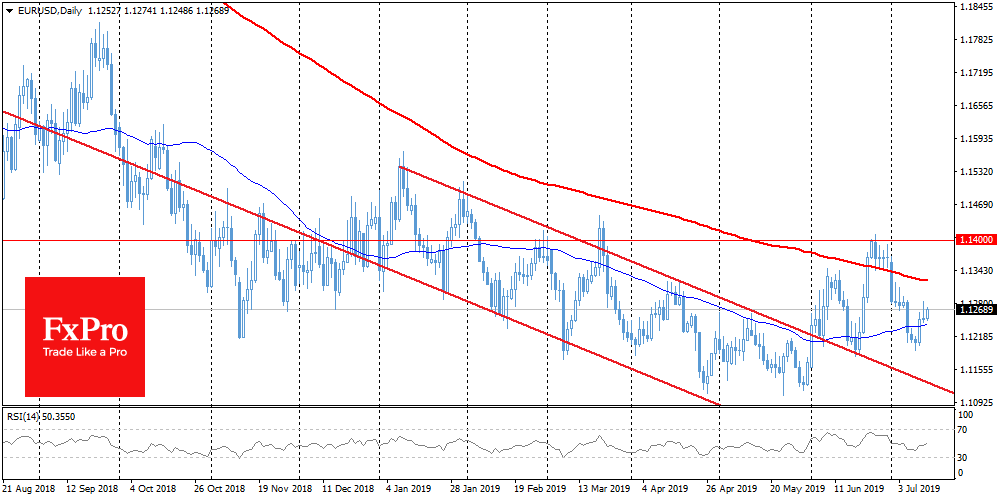
Today it is worth paying attention to the US PPI. Actual data could be a good barometer for the future inflation rates. 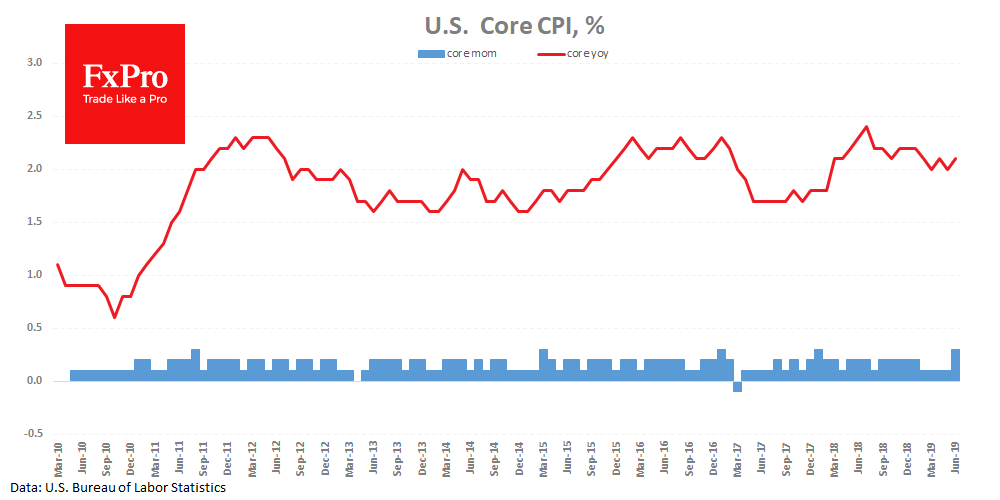
WTI
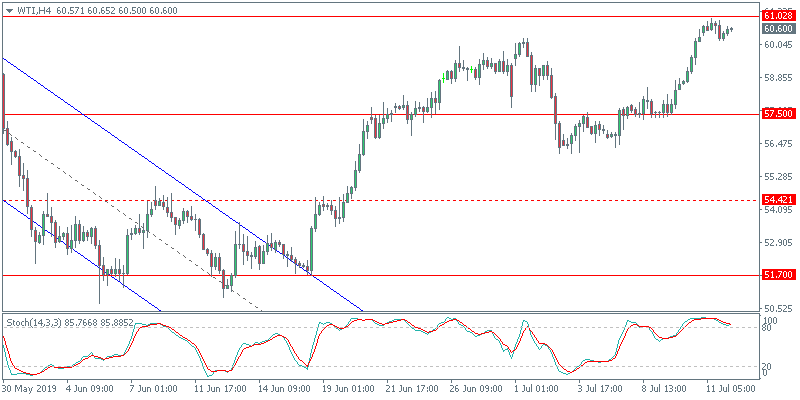
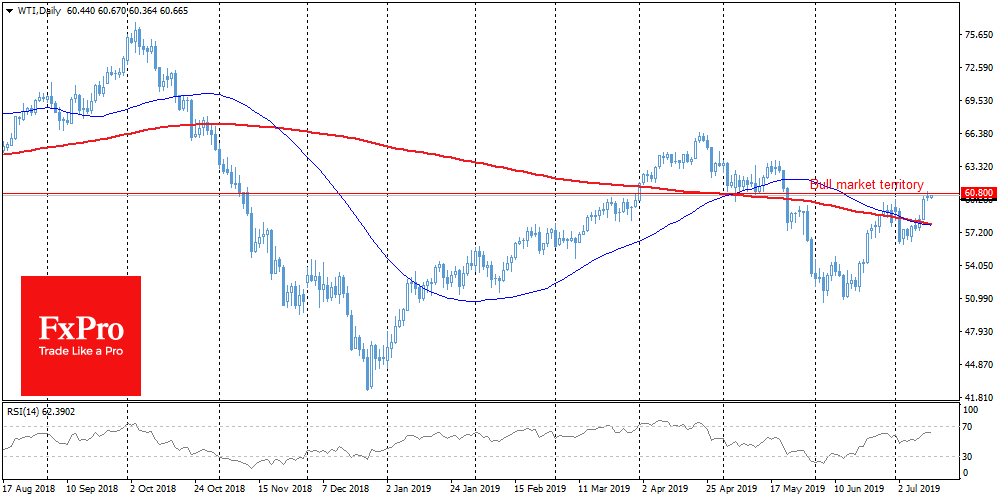
This week Crude oil prices returned above $60 per barrel. Behind the growth is a general demand for risky assets, alongside news of falling stocks market. That is another sign of the normal state of the American economy. From the side of technical analysis, it is worth paying attention to the fact that WTI quickly recovered from the decline, subsequently re-testing the bullish territory. A 20%-increase formally passes through 60.80 against current levels at 60.70. Any movement above may also attract buyers.
USD/CHF Daily Outlook
Daily Pivots: (S1) 0.9863; (P) 0.9887; (R1) 0.9928; More...
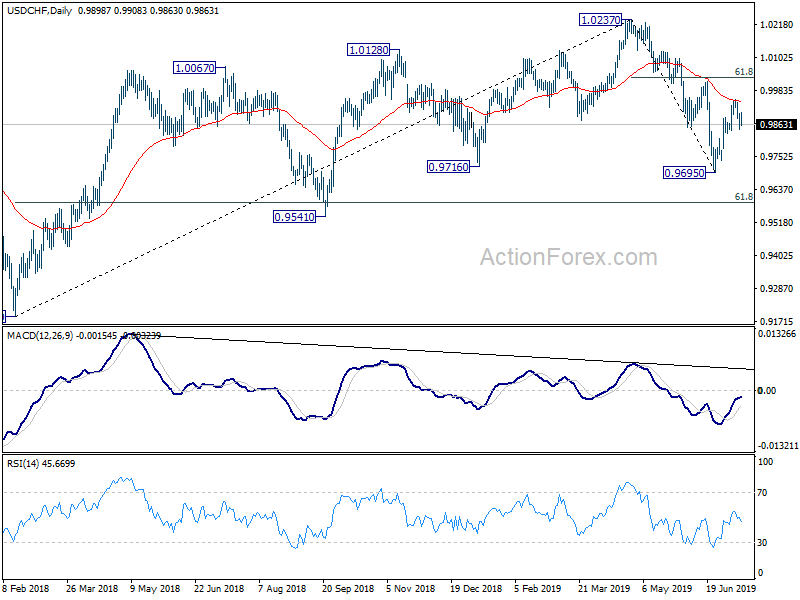
USD/CHF is staying in range of 0.9842/9951 and intraday bias remains neutral first. On the downside, break of 0.9842 will indicate that rebound from 0.9695 has completed at 0.9951. In this case, intraday bias will be turned back to the downside for retesting 0.9695 low. On the upside, above 0.9951 will target 1.0014. But upside could be limited by 61.8% retracement of 1.0237 to 0.9695 at 1.0030.
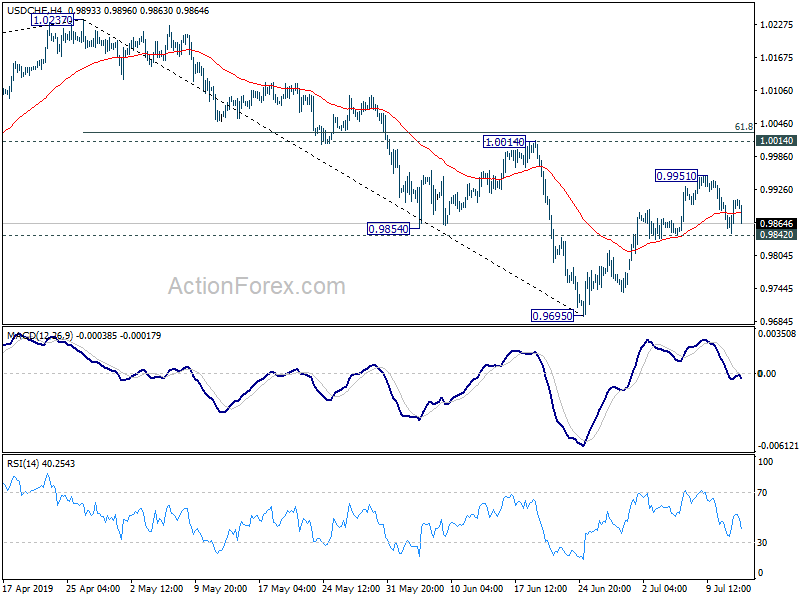
In the bigger picture, current development suggests that up trend from 0.9186 (2018 low) has completed at 1.0237 already. Deeper decline would be seen to 61.8% retracement of 0.9186 to 1.0237 at 0.9587 and below. For now, USD/CHF is seen as in long term range pattern between 0.9186 and 1.0342. Hence, we'd pay attention to bottoming signal below 0.9587. However, sustained break of 1.0014 will revive medium term bullishness and turn focus back to 1.0237 high.
USD/JPY Daily Outlook
Daily Pivots: (S1) 108.06; (P) 108.29; (R1) 108.73; More...
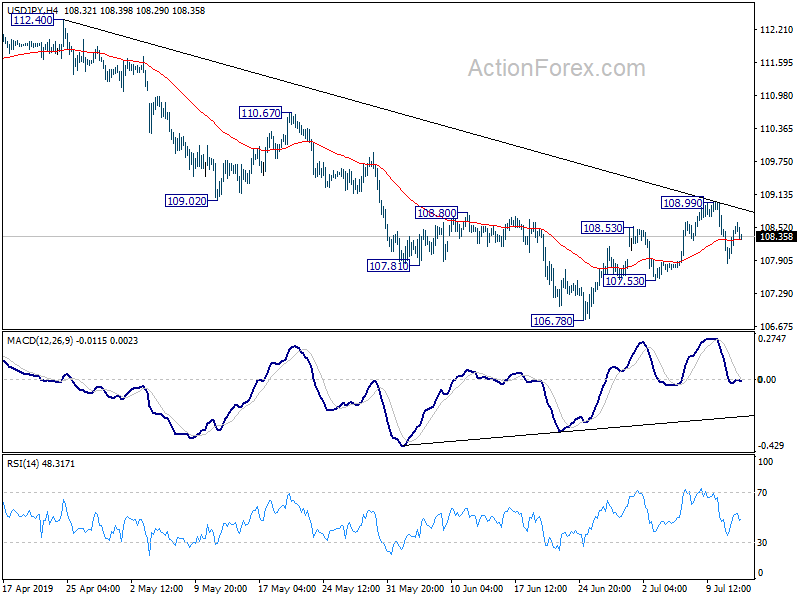
Outlook in USD/JPY remains unchanged. Corrective rebound from 106.78 should have completed at 108.99, after rejection by 55 day EMA. Break of 107.53 will likely send USD/JPY through 106.78 to resume the decline from 112.40. For now, near term outlook will remain bearish as long as 108.99 resistance holds.
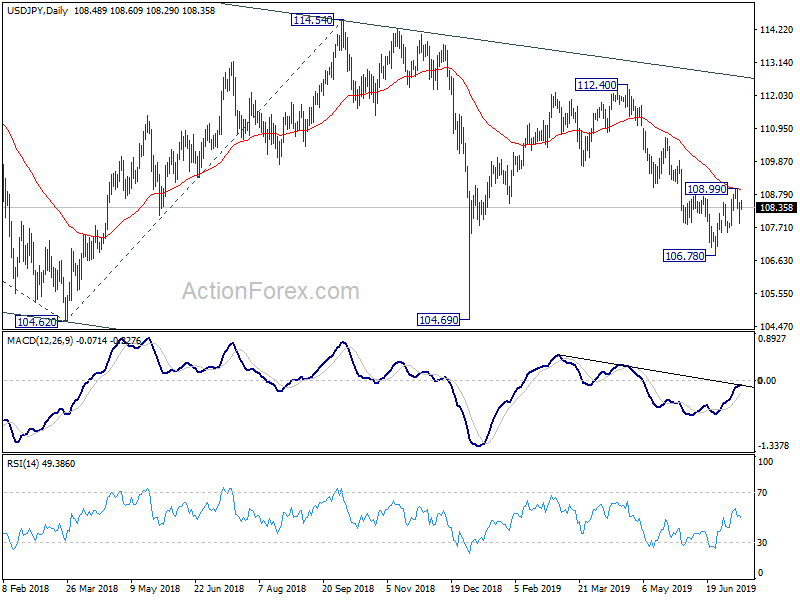
In the bigger picture, decline from 118.65 (Dec 2016) is still in progress, with the pair staying inside long term falling channel. Break of 104.62 will target 100% projection of 118.65 to 104.62 from 114.54 at 100.51. For now, we'd expect strong support above 98.97 (2016 low) to contain downside to bring rebound. In any case, break of 112.40 is needed to the first serious sign of medium term bullishness. Otherwise, further decline will remain in favor in case of rebound.
AUD/USD Daily Outlook
Daily Pivots: (S1) 0.6957; (P) 0.6973; (R1) 0.6991; More...
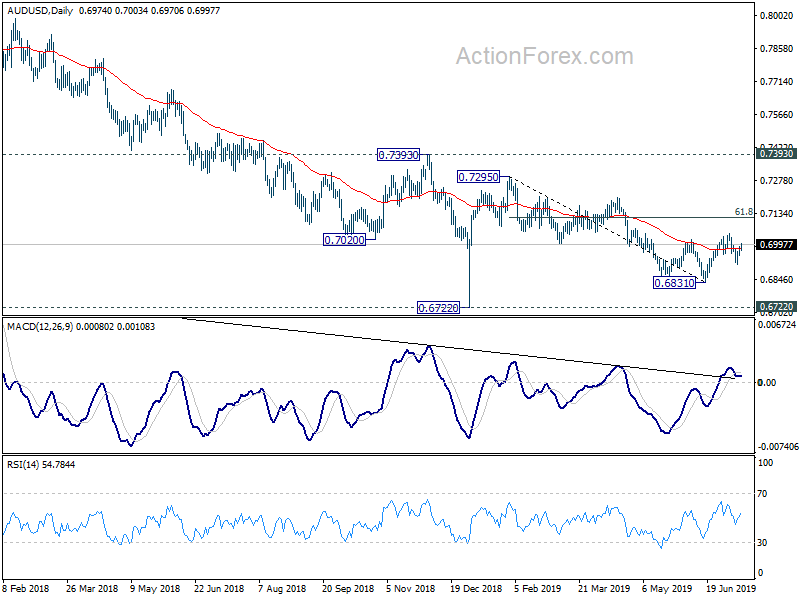
Break of 0.6994 resistance dampened our original bearish view. Pull back from 0.7047 is completed at 0.6910 and rebound from 0.6831 is possibly still in progress. Intraday bias is back on the upside for 0.7047 first. Break will target 61.8% retracement of 0.7295 to 0.6831 at 0.7118. On the downside, below 0.6910 will bring retest of 0.6831 low instead.
In the bigger picture, with 0.7393 key resistance intact, medium term outlook remains bearish. The decline from 0.8135 (2018 high) is seen as resuming long term down trend from 1.1079 (2011 high). Decisive break of 0.6826 (2016 low) will confirm this bearish view and resume the down trend to 0.6008 (2008 low). However, firm break of 0.7393 will argue that fall from 0.8135 has completed. And corrective pattern from 0.6826 has started the third leg, targeting 0.8135 again.
Forex Technical Analysis: EUR/USD, USD/JPY, GBP/USD
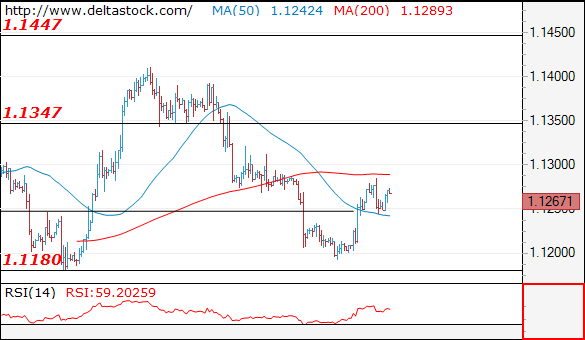
EUR/USD
Current level - 1.1267
The upmove is intact while 1.1230 holds and a continuation is to be expected, to 1.1350.
| Resistance | Support | ||
| intraday | intraweek | intraday | intraweek |
| 1.1350 | 1.1570 | 1.1230 | 1.1110 |
| 1.1410 | 1.1820 | 1.1180 | 1.1010 |
USD/JPY
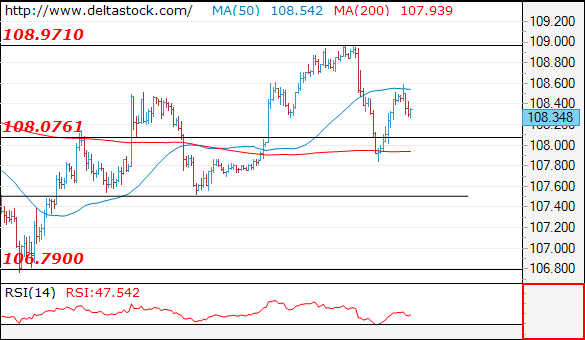
Current level - 108.34
The rebound after 107.90 low should be considered corrective, preceding a dip to 107.90 low.
| Resistance | Support | ||
| intraday | intraweek | intraday | intraweek |
| 108.60 | 109.80 | 108.00 | 106.70 |
| 109.00 | 112.40 | 107.50 | 104.50 |
GBP/USD
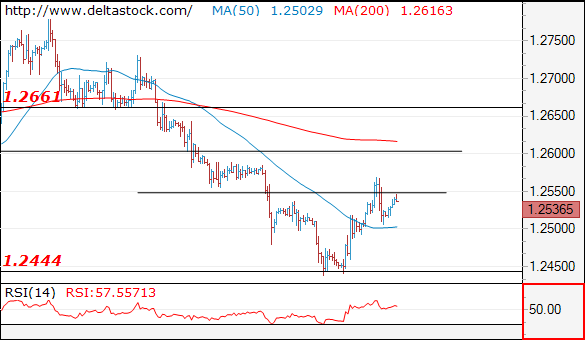
Current level - 1.2536
Current pullback is corrective and the bias remains positive above 1.2480, for a rise towards 1.2660.
| Resistance | Support | ||
| intraday | intraweek | intraday | intraweek |
| 1.2550 | 1.2890 | 1.2480 | 1.2440 |
| 1.2660 | 1.3170 | 1.2440 | 1.2360 |
The Analytical Overview Of The Main Currency Pairs
The EUR/USD currency pair
Technical indicators of the currency pair:
Prev Open: 1.12507
Open: 1.12533
% chg. over the last day: +0.02
Day's range: 1.12495 – 1.12750
52 wk range: 1.1111 – 1.2009
The US dollar has stabilized against most world currencies. Investors are waiting for additional drivers. The quotes are consolidating around 1.12500 and 1.12800, respectively. According to the minutes of the last ECB meeting of the, the regulator does not exclude the introduction of additional incentive measures in the face of growing risks in the global economy. The technical picture signals a further recovery of the EUR/USD currency pair. We recommend to open positions from key levels.
The Economic News Feed for 12.07.2019:
Manufacturer's Price Index (US) – 15:30 (GMT+3:00);
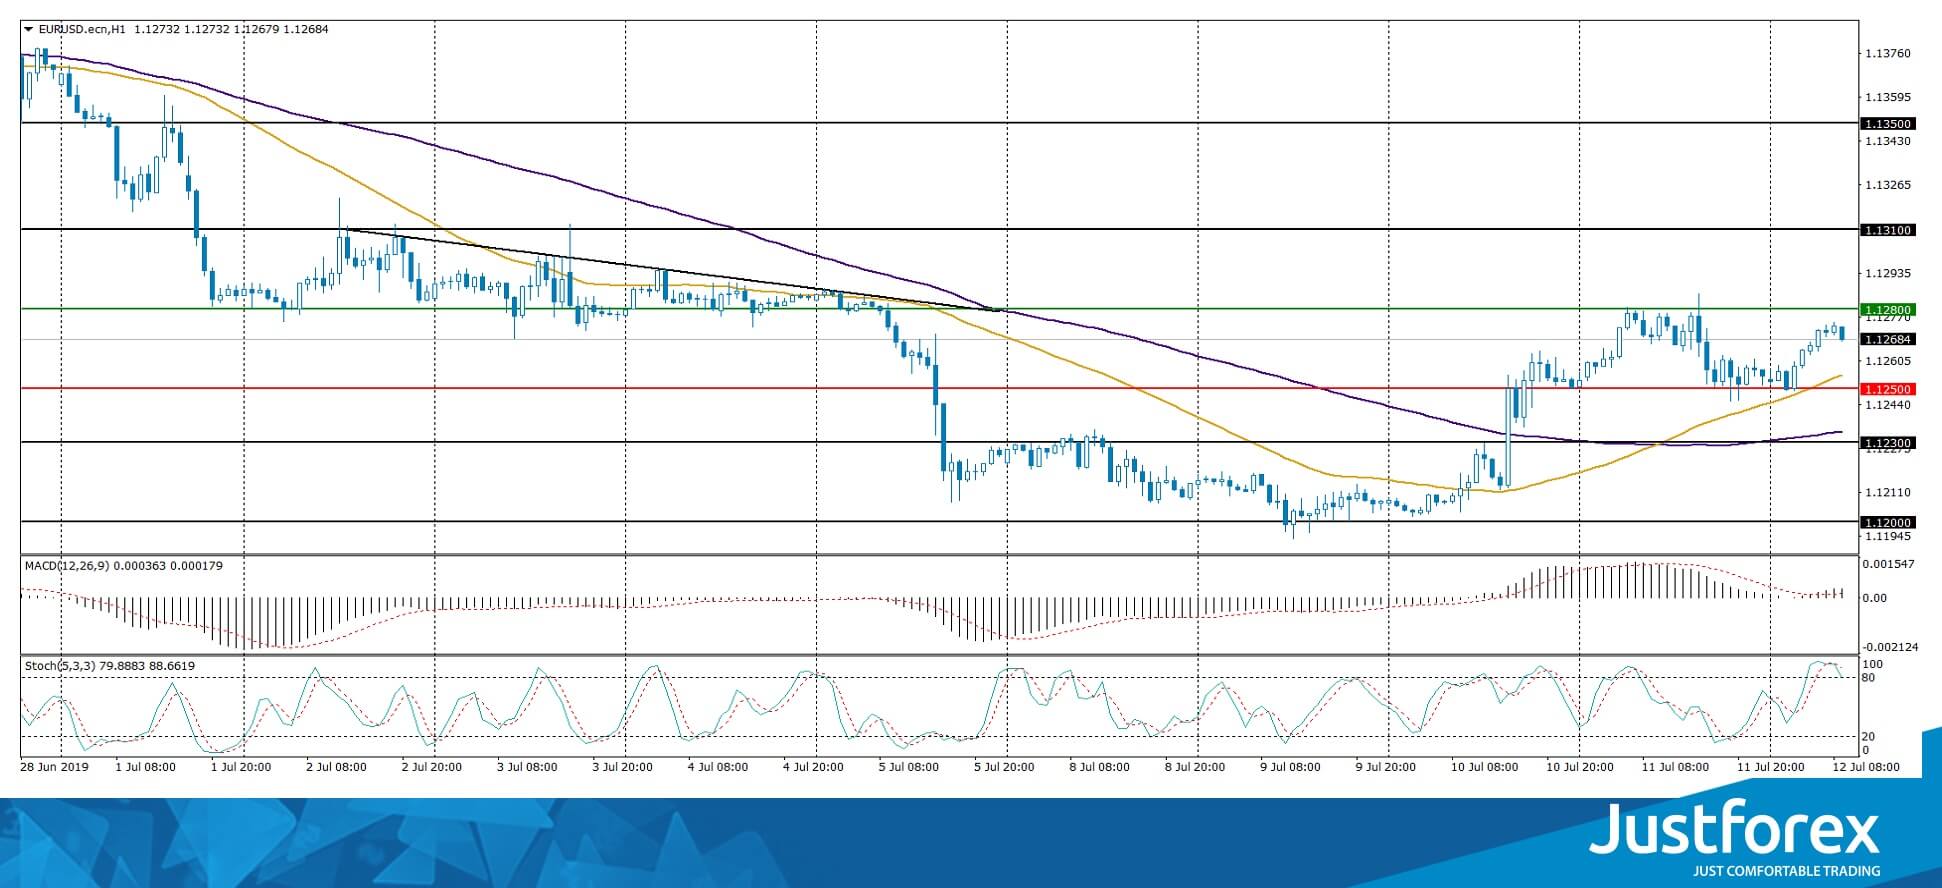
The price has fixed above 50 MA and 100 MA, which indicates the strength of buyers.
The MACD histogram has started to rise, which also gives a signal to buy EUR/USD.
The Stochastic Oscillator is in the overbought zone, the %K line crossed the %D line. There are no signals at the moment.
Trading recommendations
Support levels: 1.12500, 1.12300, 1.12000
Resistance levels: 1.12800, 1.13100, 1.13500
If the price consolidates above 1.12800, expect further groth toward 1.13100-1.13400.
Alternatively, the quotes can drop to 1.12200-1.12000.
The GBP/USD currency pair
Technical indicators of the currency pair:
Prev Open: 1.24974
Open: 1.25234
% chg. over the last day: +0.16
Day's range: 1.25182 - 1.25485
52 wk range: 1.2438 - 1.3631
The GBP/USD currency pair is in a lateral movement without a defined trend. Support and resistance levels are 1.25150 and 1.25650, respectively. GBP can correct further. The financial markets participants continue to monitor the situation around Brexit. Today we expect important economic releases from the United States. You should open positions from the key levels.
The Economic News Feed for 12.07.2019 is calm.
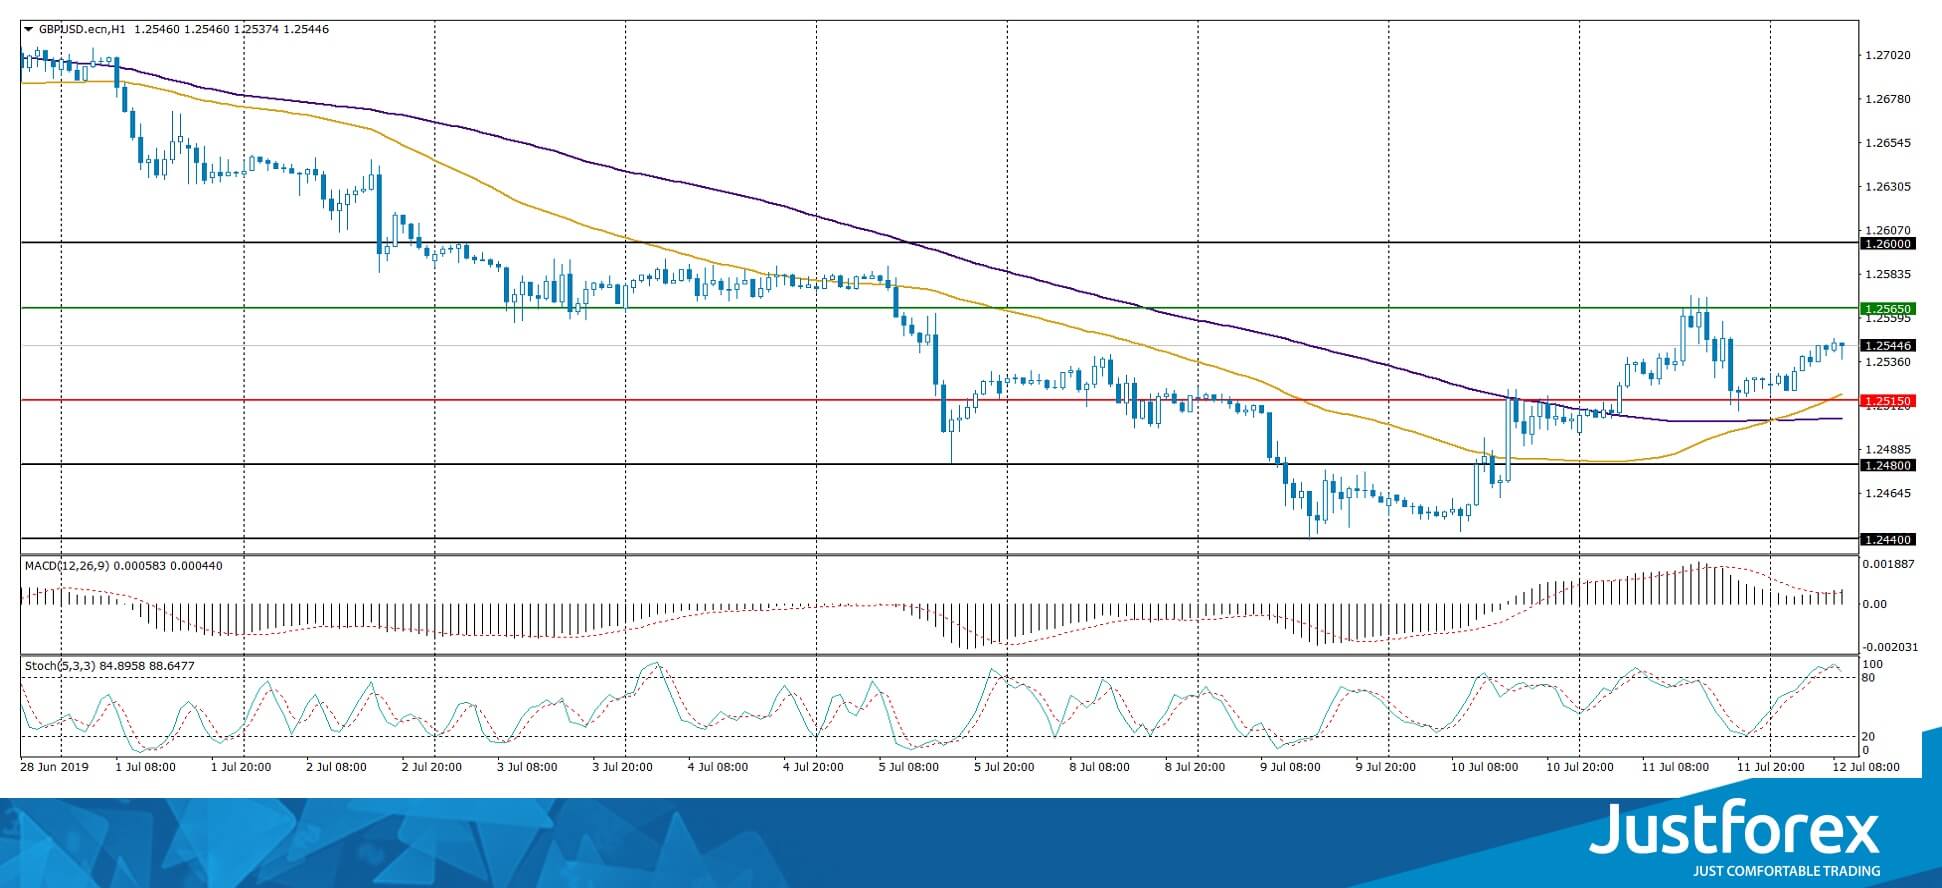
The price has fixed above 50 MA and 100 MA, which indicates the strength of buyers.
The MACD histogram is in the positive zone and continues to rise, which gives a strong signal to buy GBP/USD.
The Stochastic Oscillator is in the overbought zone, the %K line crossed the %D line. There are no signals at the moment.
Trading recommendations
Support levels: 1.25150, 1.24800, 1.24400
Resistance levels: 1.25650, 1.26000
If the price consolidates above 1.25650 expect further growth toward 1.26000.
Alternatively, the price could fall to 1.24800-1.24600.
The USD/CAD currency pair
Technical indicators of the currency pair:
Prev Open: 1.30806
Open: 1.30699
% chg. over the last day: -0.10
Day's range: 1.30248 - 1.30717
52 wk range: 1.2727 - 1.3664
USD/CAD shows a negative trend and updated key extremes. At the moment, USD/CAD quotes are testing the local support of 1.30250. 1.30450 is already a "mirror" resistance. Trading instrument has the potential to decline further. A bullish mood on oil market provides additional support for CAD. You should open positions from the key levels.
The Economic News Feed for 12.07.2019 is calm.
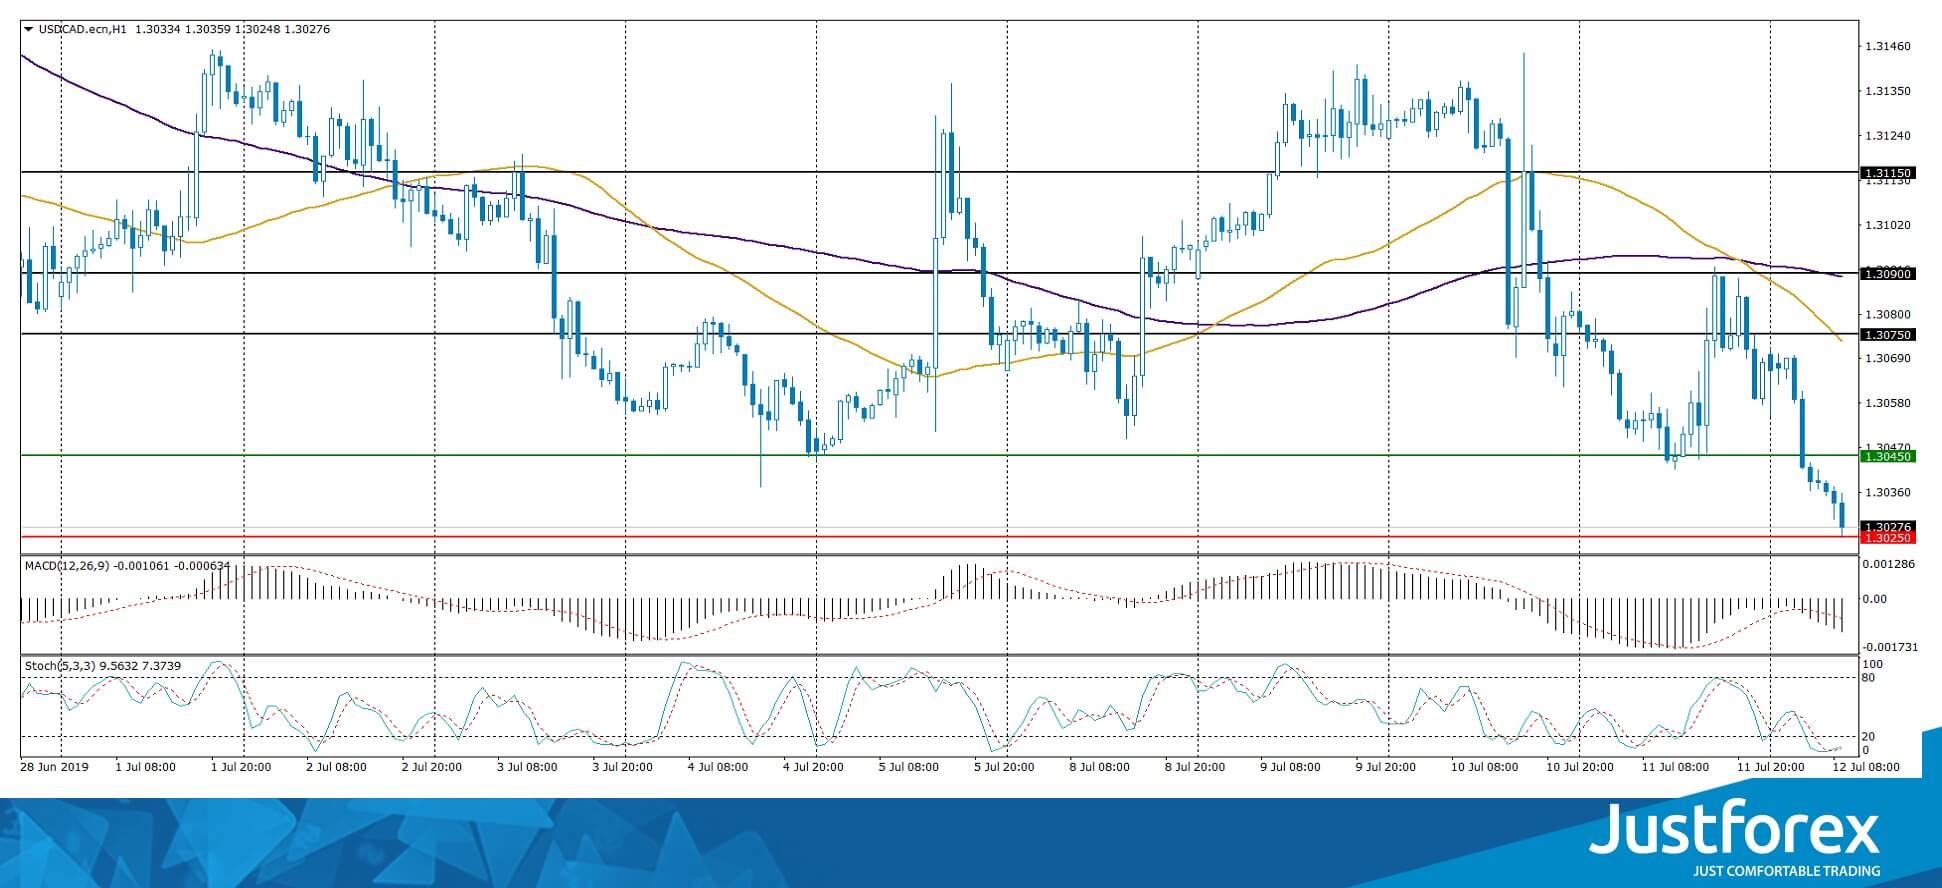
The price has fixed below 50 MA and 100 MA, which indicates the strength of the sellers.
The MACD histogram is in the negative zone and continues to decline, which gives a strong signal to sell USD/CAD.
The Stochastic Oscillator is in the oversold zone, the %K line crossed the %D line. There are no signals at the moment.
Trading recommendations
Support levels: 1.30250, 1.30000, 1.29750
Resistance levels: 1.30450, 1.30750, 1.30900
If the price consolidates below 1.30250, expect a further decline toward 1.30000-1.29750.
Alternatively, the quotes can grow to 1.30650-1.30800.
The USD/JPY currency pair
Technical indicators of the currency pair:
Prev Open: 108.423
Open: 108.489
% chg. over the last day: +0.08
Day's range: 108.290 - 108.610
52 wk range: 104.97 - 114.56
An ambiguous technical picture emerged on the USD/JPY currency pair. The trading instrument is consolidating. The safe haven currency tests local support and resistance levels: 108.300 and 108.600, respectively. USD/JPY quotes have a downside potential. We recommend to pay attention to the dynamics of the yield of US government bonds. Positions must be opened from key levels.
During Asian trading session Japan published weak data on the volume of industrial production in May.
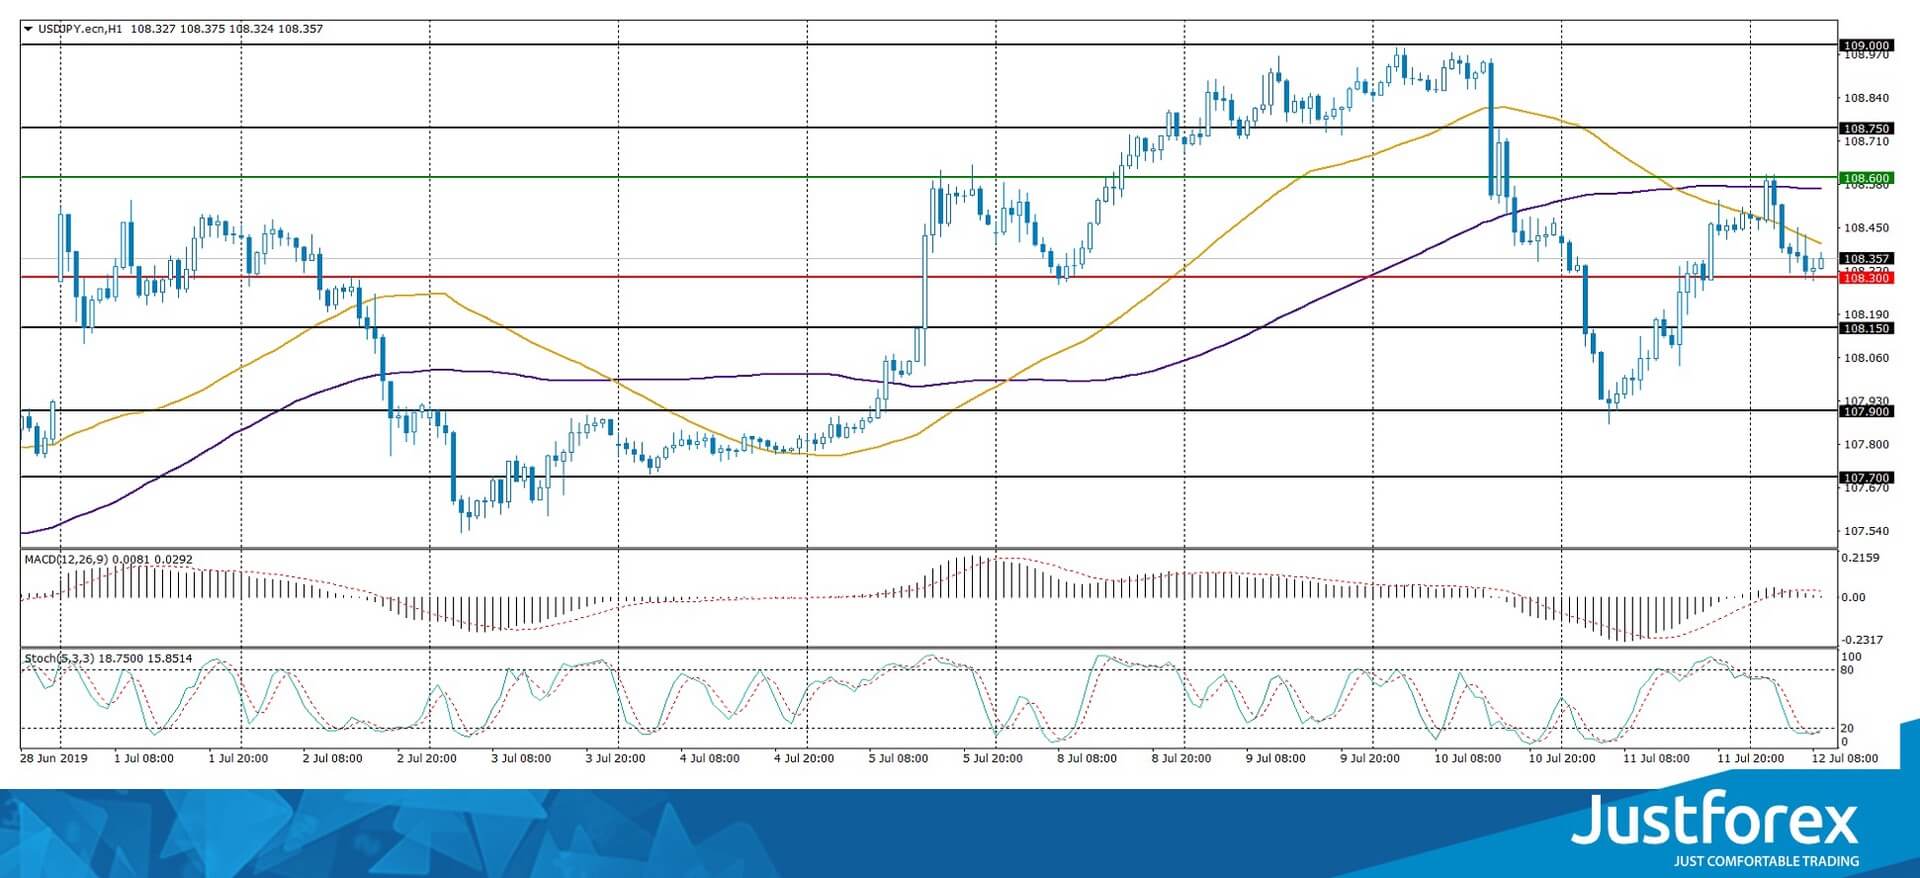
Indicators do not give accurate signals: the price crossed 50 MA and 100 MA.
The MACD histogram is near the 0 mark.
The Stochastic Oscillator is in the oversold zone, theK line crossed theD line. There are no signals at the moment.
Trading recommendations
Support levels: 108.300, 108.150, 107.900
Resistance levels: 108.600, 108.750, 109.000
If the price consolidates below 108.300, the USD/JPY quotes are expected to fall. The potential movement to 108.000-107.800.
Alternatively, the quotes could grow to 108.750-109.000.
European Open, US, Bitcoin
Quiet end to the week
It may be a relatively quiet end to the week as traders digest the last two days of Powell's testimony and US data and weigh up the prospects for interest rates this year.
Powell's appearance Wednesday was extremely well received, with the Fed Chairman giving us as dovish a message as he was ever likely to. There was no attempt to discourage investors from fully pricing in a July cut so that looks as close to a certainty as you can expect to see.
Investors appear encouraged that it won't be the last as well, with his gloomier assessment of the outlook appearing an indication of future cuts. The CPI numbers on Thursday added a layer of confusion, as weak price pressures are one of the primary factors supporting calls for cuts. A core annual inflation reading of 2.1% may well leave people wondering whether inflation is as lacking as Powell indicated and the Fed's preferred PCE measure suggests.
Stocks ended the day higher on Thursday and Europe is slightly in positive territory at the open but the data yesterday did take some of the wind out of the sails. This may put more emphasis on the PPI data today but broadly speaking it's looking a little thin. Thankfully, Monday marks the start of earnings season so we won't have to wait long for something to get our teeth into.
Cryptocurrencies are Trump's latest bugbear
Trump's attack on Libra and cryptocurrencies as a whole didn't have as great an impact on the space as you might have typically expected. The President declared he's not a fan, insisting they are not money and that Facebook and others would need a banking charter and become subject to all regulations. In ending the attack by lauding the dollar's dependability and dominance, it makes you wonder whether the President is feeling a little threatened by Facebook's foray into the space.
The President's tweets were enough to sink bitcoin by around $500 over the next couple of hours but by its own standards, this is a rather mild response. It has also since halved that deficit so the initial response - granted not at the busiest time of the day - has been fairly muted. It will be interesting to see if traders respond more over the course of today, especially if this turns out not to be a one-off attack.
Gold Slips On US CPI Data
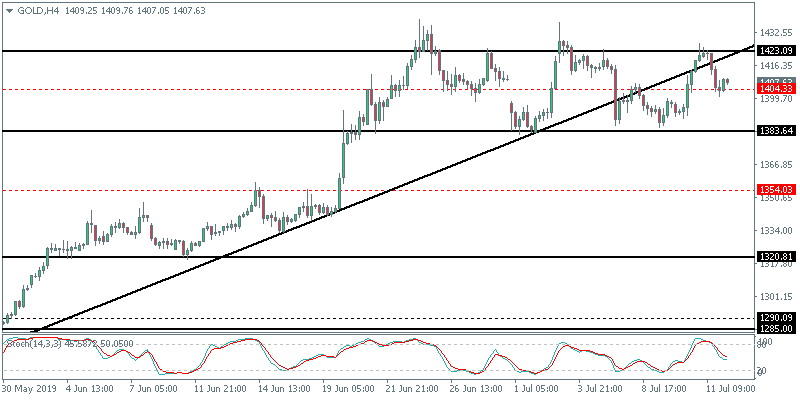
Gold prices pared gains on Thursday. The monthly inflation data from the US showed a modest increase in headline inflation. On a monthly basis, CPI grew 0.1% beating estimates of an unchanged print. But on a yearly basis, US inflation eased to 1.6% from 1.8% previously. The inflation report came a day after Fed Powell’s dovish comments sent the precious metal higher.
Can XAUUSD Breakout Higher?
The precious metal has been trading within the range of 1423 and 1383 levels for the past three weeks. Despite the gains earlier this week, gold failed to capitalize on the momentum. We expect the precious metal to remain range-bound within the said levels. A breakout from this range will establish the next leg in the direction of the prices.
Oil Rally Stalls As OPEC Expects Non-OPEC Production To Slow
The rally in crude oil prices took a pause on Thursday. OPEC said that its 2019 production forecast from non-OPEC will slow. Supply is expected to fall by 95,000 BPD for 2019. The prospect of a weakening global economy is also expected to dampen demand. The oil cartel also said that it expects the same levels of demand to continue into 2021.
Will Crude Oil Correct Lower?
After strong gains earlier this week, oil prices have stalled just below the 61.00 handle. This puts the range within the 61.00 and 57.50 levels for oil price. A breakout from this level will signal the next leg in the direction of the commodity. Further gains can be expected on a strong close above the 61.00 handle. Alternatively, a close below 57.50 will trigger further declines that could see a test of the 54.00 handle.