Sample Category Title
AUD/USD Nears 200-Hour SMA At 0.6984
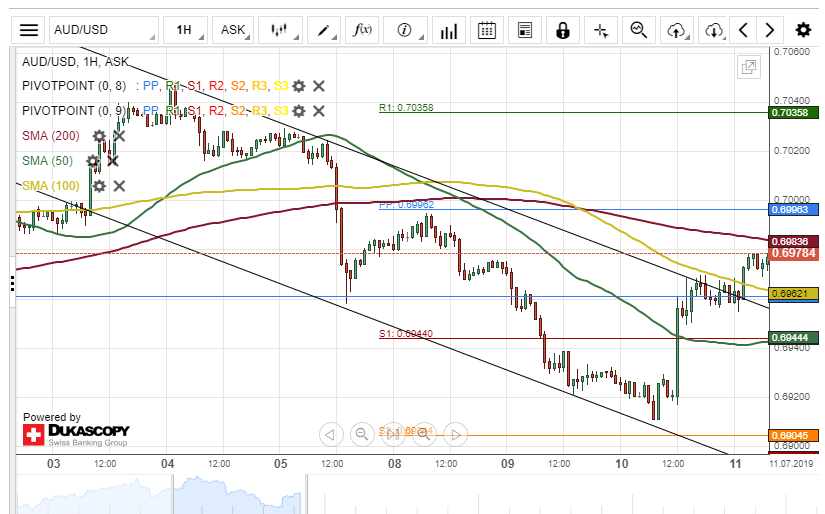
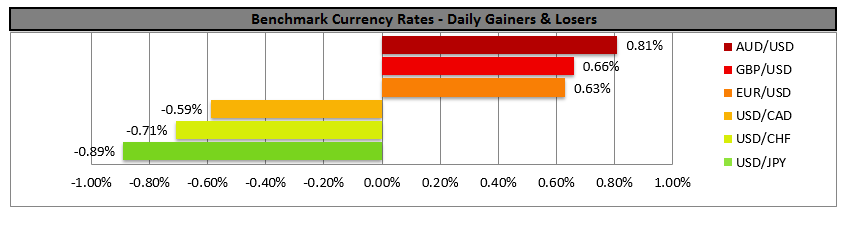
The Australian Dollar appreciated about 58 base points against the US Dollar on Wednesday. A breakout occurred through the upper boundary of a descending channel pattern during the morning hours of today's trading session.
Given that a breakout had occurred, Most likely, the AUD/USD currency pair will continue its upward movement today. The potential target will be near a swing high at 0.7035.
However, a resistance line formed by the 200-hour simple moving average at 0.6984 could provide resistance for the currency exchange rate during the following trading session.
USD/CAD Decline Likely To Continue
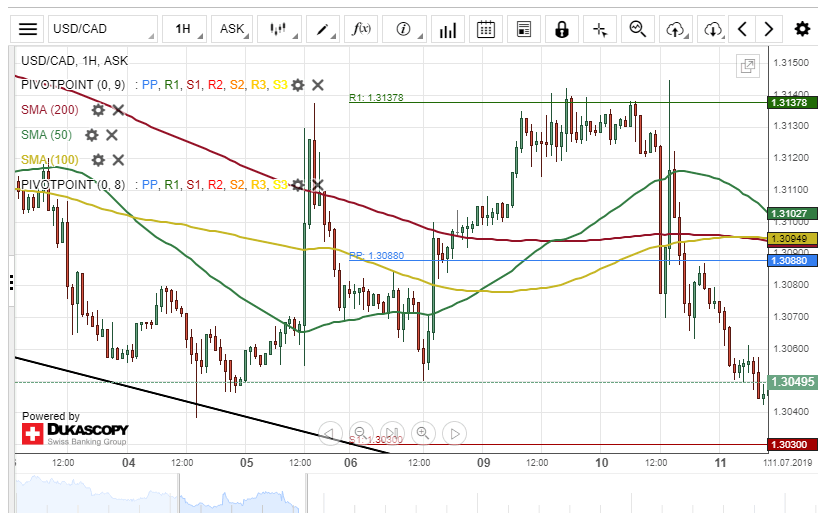
During the past 24 hours, the US Dollar versus the Canadian Dollar has depreciated over 90 base points. The currency pair breached both the 50-, 100– and 200-hour SMAs on Wednesday.
As for the near future, it is likely that the USD/CAD exchange rate will continue to edge lower. The potential target for bearish traders will be near the bottom border of a descending channel pattern at 1.2980.
Although, the decline might be stopped by a support level formed by the weekly S1 at 1.3030 during the following trading session.
NZD/USD Might Aim For Weekly R1
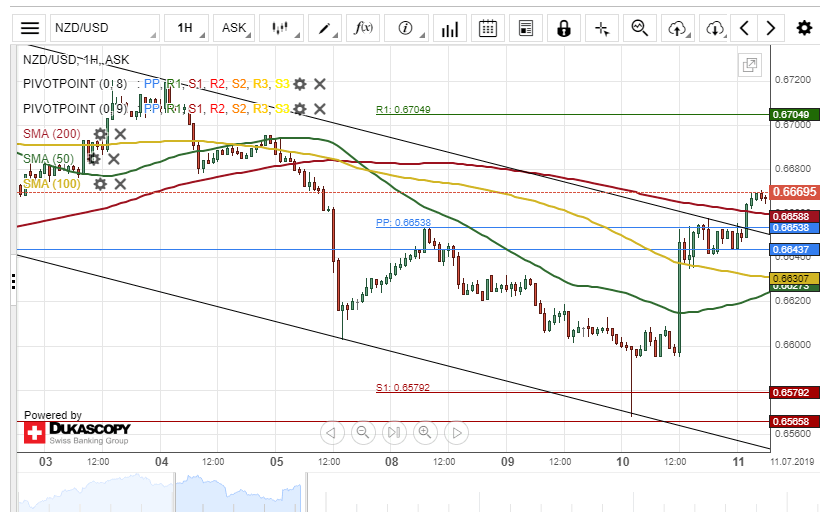
The New Zealand Dollar appreciated about 64 base points against the US Dollar on Wednesday. The currency pair breached a descending channel pattern during the morning hours of today's trading session.
Given that a breakout had occurred, it is likely that bullish traders could aim for a swing high at 0.6704.
On the other hand, the currency exchange rate might reverse from the current price level at 0.6674 and aim for a retest of a support level formed by the 50-hour simple moving average at 0.6623 during the following trading session.
Netflix Stock Tests 7-Month High, Narrow Range In Medium Term
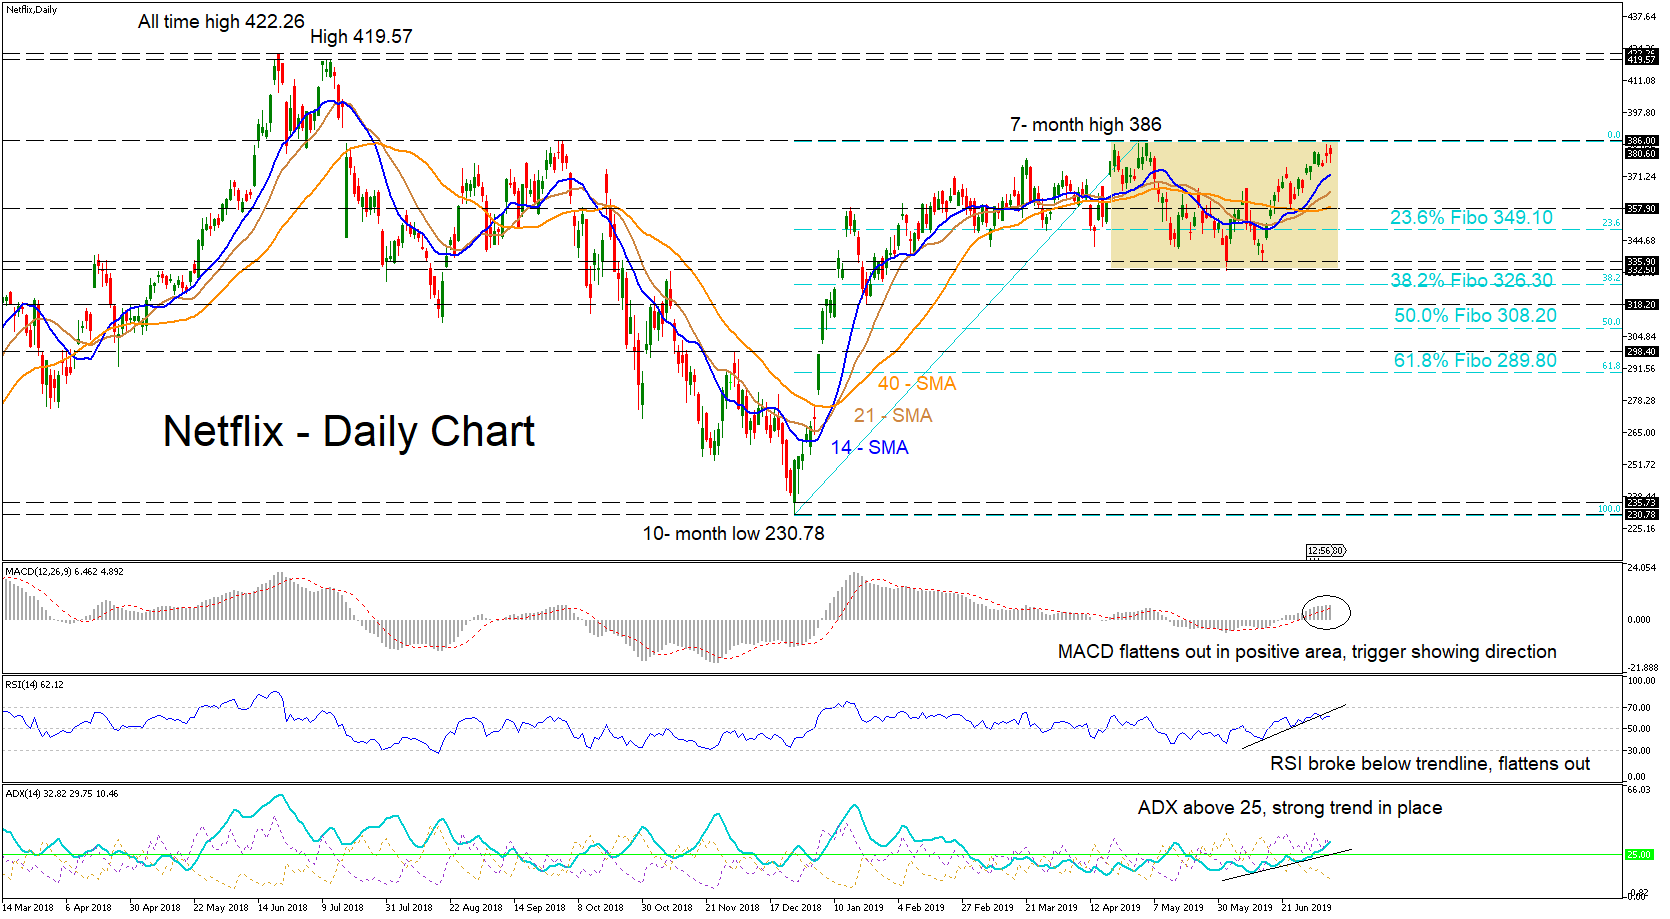
Netflix stock experienced a short-term upside rally from the bottom boundary of the trading range for the last month, that began at the end of April, to the upper boundary of a seven-month high of 386. The stock has temporarily faltered near the resistance, waiting for the buyers’ and sellers to set the direction.
Although in a sideways move, the short- and medium-term simple moving averages (SMAs) of 14-, 21- and 40-day SMAs, confirm a positive momentum on price action which have temporary strength, with their bullish crosses. The MACD and the RSI have flattened in the positive area, both showing that momentum in the short-term has wavered. However, the ADX is showing a strong trend above 25 level, but currently stands near 32 and is moving away from the line, indicating further increases.
Currently the stock is neutral, waiting for a definitive direction to unfold, and if the price breaks the upper boundary of the range, the near-term obstacle could be close to the all-time highs of 419.57 and 422.26.
If momentum indicators decrease, first support could come at the 14- and 21-SMAs at 372.30 and 364.50 respectively, before testing simultaneously the 40-day SMA, which overlaps with the support level of 357.90. Further moves down would touch the 23.6% Fibonacci retracement level of the upleg from 230.78 to 386 near 349.10.
Overall, in the long-term, Netflix stock seems to be strongly positive despite the latest sideways move in the near term.
The US Dollar Is Under Pressure After Fed Chairman Powell’s Comments
The US dollar fell against a basket of major currencies after the speech by Fed Chairman, Jerome Powell. The official said that concerns about trade policy and the weakness of the economy continued to put pressure on the forecasts for the US economy, and the Fed was ready to do everything necessary to support economic growth. Powell believes that the rate of economic growth has become moderate, but weak inflation may last a little longer than it was supposed. The US dollar index (#DX) closed in the negative zone (-0.40%) yesterday.
Investors took the statements by the head of the US Central Bank as a signal that the Fed was ready for a more aggressive interest rate reduction. According to the CME FedWatch Tool, more than 50% of financial market participants believe that the regulator may reduce the range of key interest rate to 1.75%-2.00% at a meeting in September.
Among other things. Yesterday, ambiguous economic statistics were published in the UK. GDP (m/m) increased by 0.3%, as experts expected. Manufacturing production grew by only 1.4% in May instead of 2.2%. Also, the Bank of Canada decided on a key interest rate yesterday. As expected, the regulator left the indicator unchanged at 1.75%.
The "black gold" prices are growing. At the moment, futures for the WTI crude oil are testing the mark of $60.75 per barrel.
Market Indicators
- Yesterday, the bullish sentiment was observed in the US stock markets: #SPY (+0.48%), #DIA (+0.31%), #QQQ (+1.00%).
- The 10-year US government bonds yield has become stable. Currently, the indicator is at the level of 2.04-2.05%.
The News Feed on 2019.07.11:
- Publication of the ECB account of monetary policy meeting at 14:30 (GMT+3:00);
- Data on inflation in the US at 15:30 (GMT+3:00).
Powell’s Dovish Testimony Weakens The USD
USD weakened substantially yesterday across the board, as Fed Chairman Jerome Powell had a clearly dovish tone in his testimony before the US congress yesterday. The Fed's Chairman underscored his dovishness as in a question he answered, by implying that global growth and trade uncertainties as well as low inflation, outweigh the healthy US labour market. It should be noted that despite a number of Fed members preferring to get more data before making any decisions, a strong case for a rate cut is building and analysts were quick to note that the case for a 50bp rate cut is still present. The Fed meeting minutes released later on showed that there is some support within the Fed for such a scenario, highlighting worries about inflation. In addition to that, the crypto market was hit, as the Fed's Chairman stated that Facebook's Libra “cannot go forward” until serious concerns are addressed. We expect the USD to remain weak, as the market still digests Powell's testimony and could see today's US CPI releases drawing also the market's attention. EUR/USD rallied yesterday and during today's Asian session, breaking the 1.1220 (S2) and the 1.1260 (S1) resistance lines, now turned to support. We could see the pair rising further should the USD continue to weaken during the day. Should the pair find fresh buying orders along its path, we could see the pair breaking the 1.1300 (R1) resistance line and aim for higher grounds. Should the pair come under selling interest, we could see it breaking the 1.1260 (S1) support line and aim for the 1.1220 (S2) support level.
Oil's tight supply prospect boosted prices
EIA crude oil inventories showed a widened drawdown of -9.5 million barrels, indicating a tight US oil market. The situation could be even tighter next week, as Gulf of Mexico is hit by a storm, production ceases and personnel has being evacuated from the area. On other news, Middle East tensions rose yesterday, as Iranians tried unsuccessfully to seize a British tanker in the Persian Gulf. US President Trump tweeted a new stark warning against Iran, intensifying the situation further. We could see oil prices continue to rise, as the supply side seems to remain tight. WTI prices continued their rise yesterday and during today's Asian session, breaking the 59.50 (S1) resistance line, now turned to support. We maintain a bullish bias for the commodity's prices and we would require a clear breaking of the upward trendline incepted since the 9th of July, for it to change. Should the bulls continue to dictate the WTI's direction we could see it breaking the 61.00 (R1) resistance line and aim for the 62.70 (R2) resistance barrier. Should the commodity come under selling pressure, we could see WTI prices breaking the 59.50 (S1) support line.
Other economic highlights, today and early tomorrow
Today during the European session, we get Germany's and France's final HICP rates for June, as well as Sweden's CPI rate for June. During the American session, we get the US CPI rates (headline and core) for June. During tomorrow's Asian session, Japan's final industrial production growth rate for June is to be released, however we expect attention to be turned towards China's trading data for June. Also please note that during the European session Bank of England's stability report is due out, while the EUR may expect some volatility during the release of ECB's account of monetary policy meeting. As for speakers, today Fed's Chairman Powell is to be testifying for a second day and Atlanta Fed President Bostic, Richmond Fed President Barkin, FOMC's Quarles and Minneapolis Fed President Kashkari are also scheduled to speak.
EUR/USD H4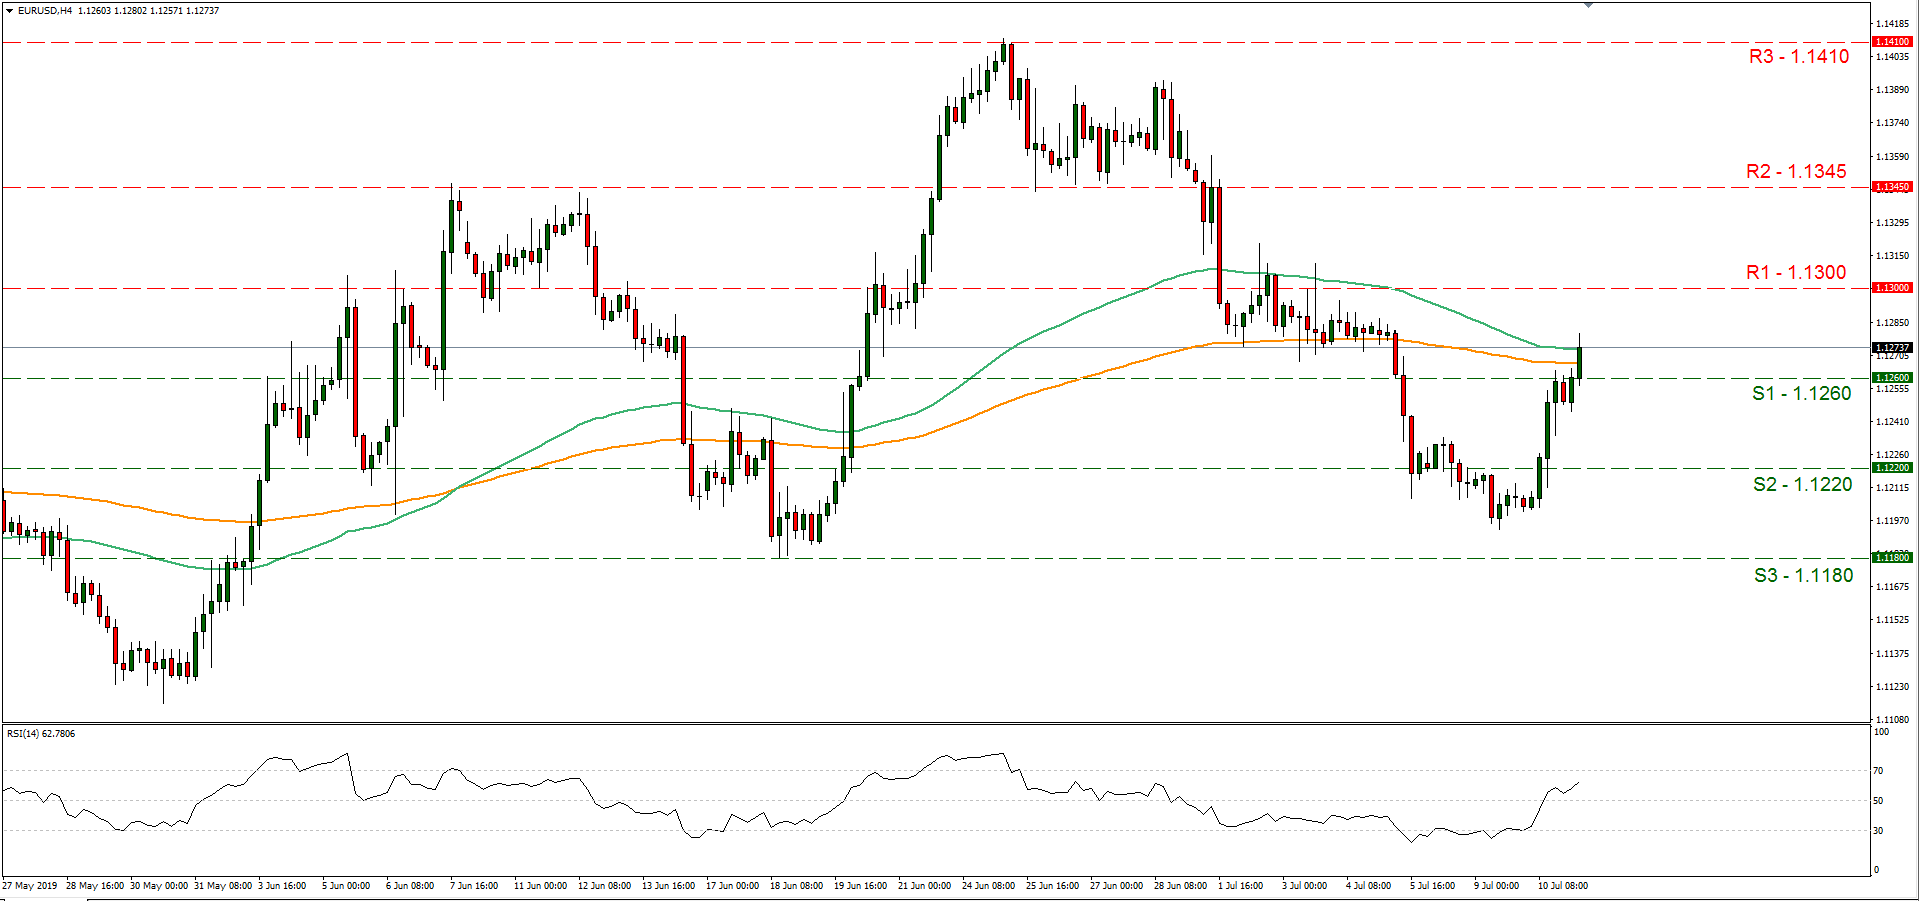
Support: 1.1260 (S1), 1.1220 (S2), 1.1180 (S3)
Resistance: 1.1300 (R1), 1.1345 (R2), 1.1410 (R3)
WTI H4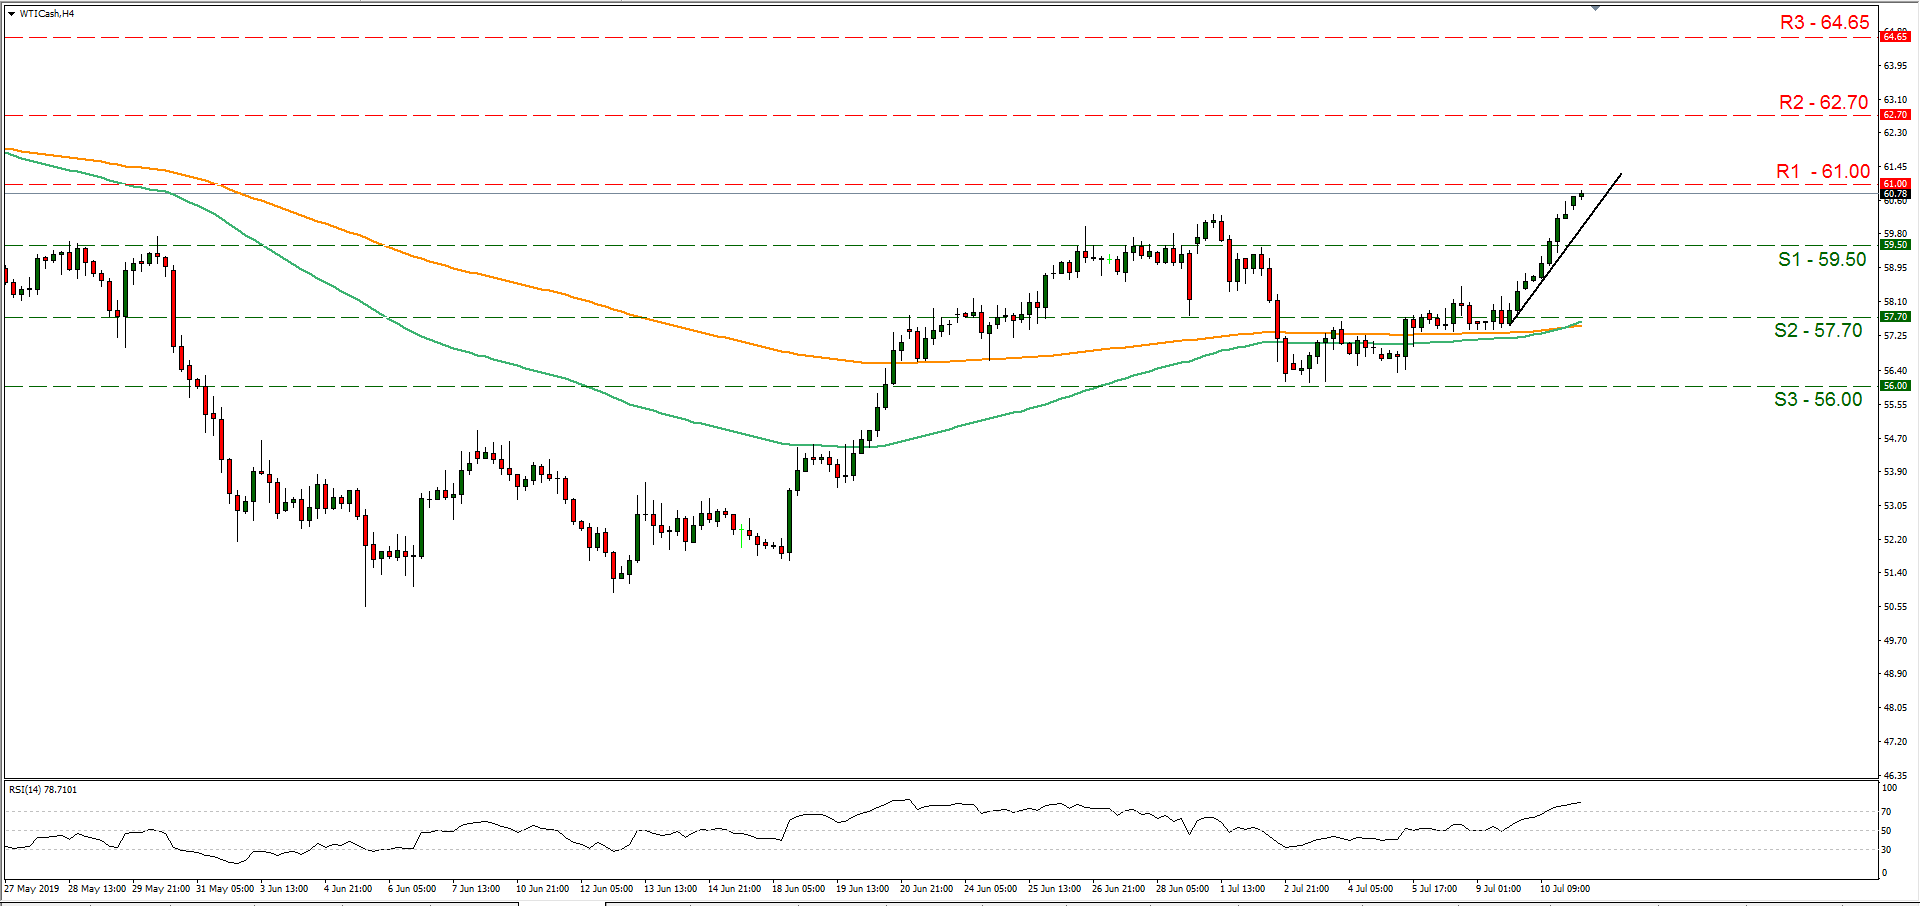
Support: 59.50 (S1), 57.70 (S2), 56.00 (S3)
Resistance: 61.00 (R1), 62.70 (R2), 64.65 (R3)
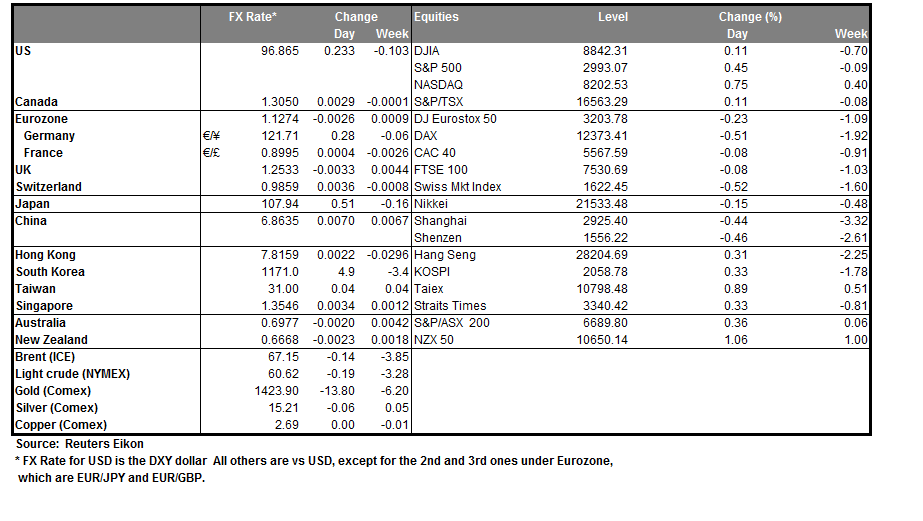
Markets, Powell, Gold, Bitcoin, Oil
It's safe to say that investors were pleased with Jerome Powell's first day of testimony on Wednesday, with equity markets jumping on his dovish assessment.
The Fed Chairman doesn't typically provide strong and direct messages on policy direction, which makes predicting future rate movements all the more difficult. But Wednesday's message was clear, the data is softening - particularly on the inflation side - and downside risks are significant. What was very notable was his view that a strong jobs report is only one of a large batch of indicators that the Fed monitors, despite the widely held belief of its importance.
It was also very notable that he did not attempt to pare back expectations for an interest rate cut later this month. He and the rest of the committee will be very aware of how markets are positioned right now and yesterday would have been the perfect opportunity to address that but he didn't. There is still a question lingering over how many we'll see this year but I guess we'll have to be patient on that one, although markets are still expecting aggressive cuts.
The second day of testimony is often largely a rerun of the first, from a monetary policy perspective. That won't stop traders keenly watching for signals though, particularly around the prospect for more cuts this year.
Gold buoyed by Powell but still short of recent highs
Gold was certainly buoyed by Powell's comments which knocked the dollar and spurred the rally. The yellow metal held firm above the key $1,380 support level before jumping back above $1,400 where it continues to trade today. We're still a little below the recent peaks just shy of $1,450 though and another failure to break above here may signal exhaustion for the rally.
One thing that will be interesting today is how traders respond to Powell's dovish comments. I can't imagine he'll stray too far from yesterday's delivery but will that be enough to weaken the dollar further, price in more aggressive easing and lift gold back to those highs? I'm not convinced but continued weakness in the data and a disappointing earnings season may in the coming weeks.
Bitcoin tumbles on Powell's Libra comments
Jerome Powell's testimony had a big impact on bitcoin on Wednesday, putting further focus on today's appearance in front of the Senate Banking Committee. The cryptocurrency tumbled as Powell was questioned about the Fed's approach to Facebook's recent announced Libra coin, something that could have direct consequences for the entire space in the years to come.
Ultimately, there was nothing shocking in the testimony and anyone that is surprised by how much work lies ahead and how long it may take was kidding themselves. This is actually good news as regulation has long been something that's held the space back and the Fed taking a serious, thorough and long-term approach is positive. But obviously, this is a very volatile and emotional market and perhaps this is not what traders wanted to hear, especially after such a good run of price gains.
The drop off hasn't been too severe though after price once again stumbled around $13,000 so I think there's probably an element of profit taking to this and beyond today, unless Powell says something outrageous, may not hold it back too much. That said, this is a very volatile market and violent swings in either direction wouldn't come as a surprise to anyone.
Oil buoyed by inventory data
Oil is trading higher again on Thursday, buoyed by a combination of positive market sentiment and the inventory data we've seen over the last couple of days. EIA didn't only back up the API release but exceeded it, continuing a recent trend of large drawdowns. With the US back in talks with China, OPEC+ extension confirms and drawdowns been recorded, it's looking quite a bullish environment again for oil, with the only concern being demand growth and the economy.
WTI is trading back above $60 though which is significant as this had looked an interesting resistance level. If it can hold onto these gains to the end of the week, it could be a strong bullish signal in the coming weeks.
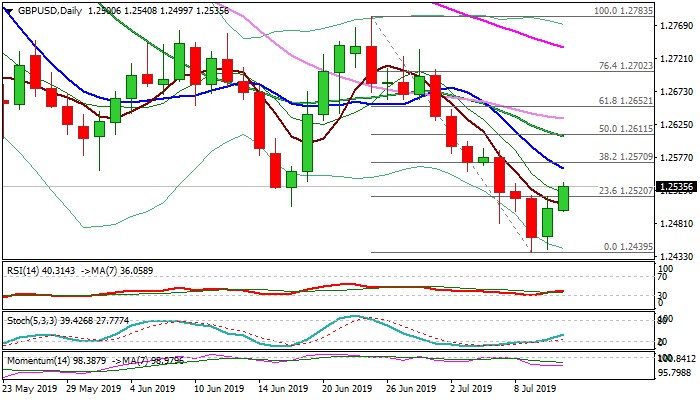
GBP/USD Outlook: Limited Recovery Is Likely To Precede Fresh Weakness
Cable extends bounce from 1.2440 zone double-bottom, inflated by weaker dollar on dovish comments from Fed Chairman Powell.
Signals that the US central bank may opt for more aggressive rate cut in policy meeting at the end of the month, could spark further recovery of British pound, which hit its lowest levels in seven months in past two days.
Overall picture remains bearish as pound is under strong pressure from rising fears of no-deal Brexit and current bounce is so far seen as positioning for fresh downside, as bears eye 2019 spike low at 1.2397 (3 Jan).
Initial barriers lay at 1.2561/70 (10DMA/Fibo 38.2% of 1.2783/1.2439 bear-leg) and break here would signal stronger correction and expose barriers at 1.2608 (20DMA) and 1.2634 (30DMA). Caution on strong bearish momentum and daily MA's still in full bearish setup that may limit recovery.
Res: 1.2540, 1.2570, 1.2608, 1.2634
Sup: 1.2500, 1.2481, 1.2440, 1.2397
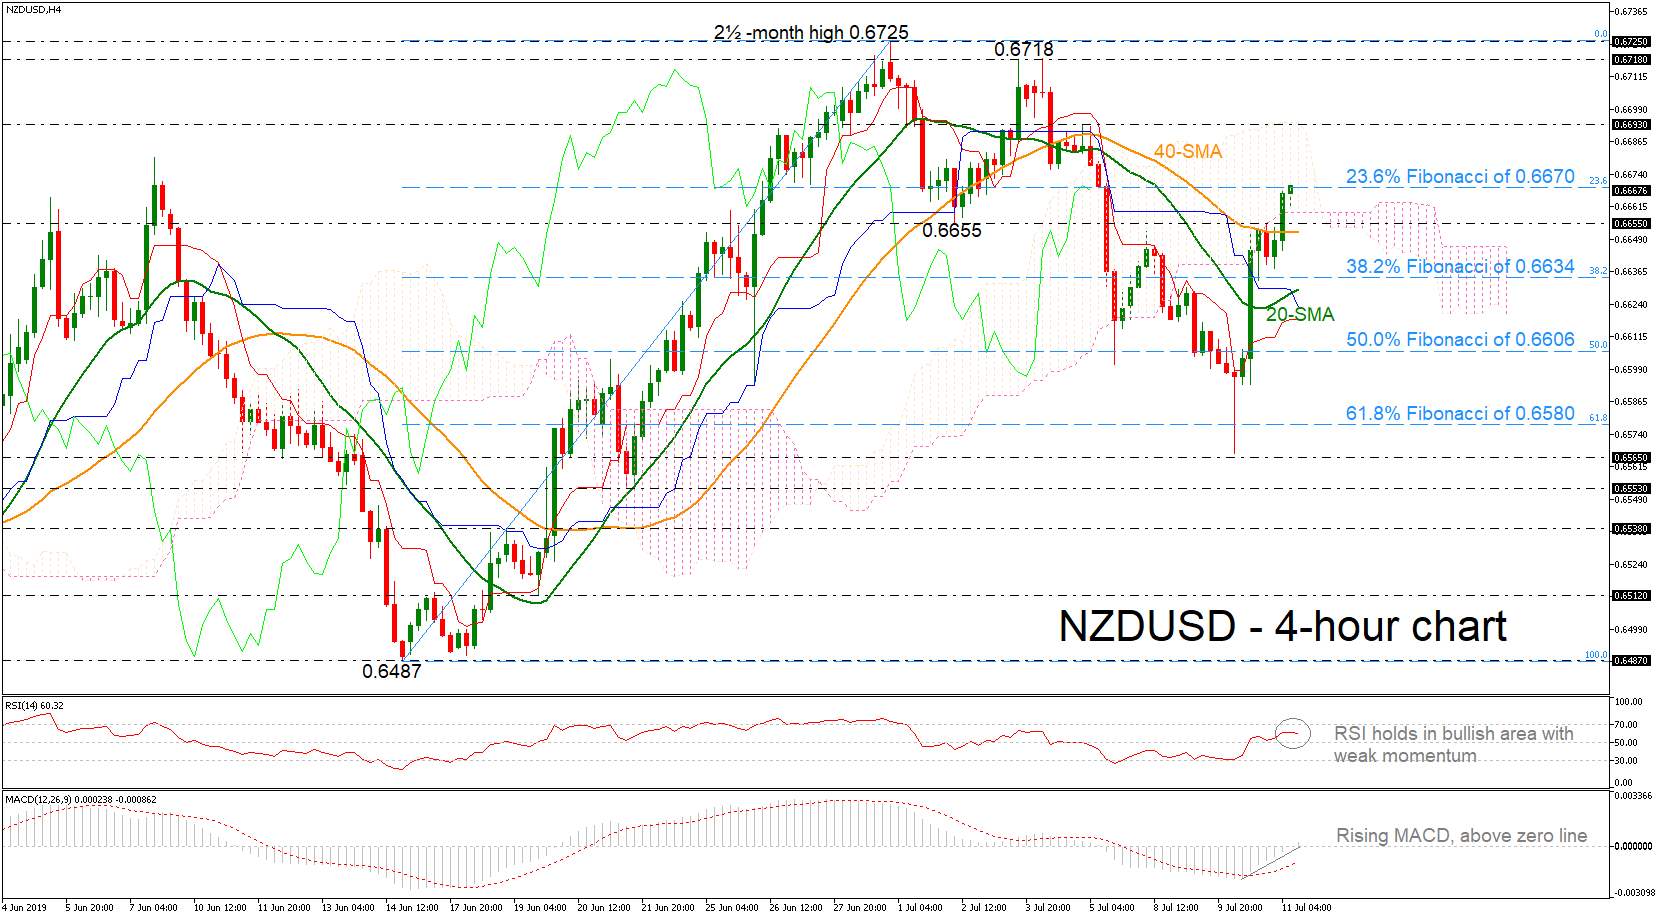
NZDUSD Rallies Near 23.6% Fibonacci, Remains Inside Ichimoku Cloud
NZDUSD continues to rise above the short-term moving averages, remaining inside the Ichimoku cloud, stretching its upward movement near the 23.6% Fibonacci retracement level of the upward wave from 0.6487 to 0.6725.
According to the MACD, positive momentum could stretch into the short-term as the indicator picks up steam above its trigger line. The RSI is also hovering in the positive area but is flattening.
In the positive scenario, where the price peaks above today’s high of 0.6670, a new top could be formed around the 0.6693 resistance level, which coincides with the upper surface of the Ichimoku cloud. If the market manages to overcome that area, traders could look for obstacle near the 0.6718 – 0.6725 zone.
A reversal to the downside, could immediately stop around the 40-simple moving average (SMA) currently at 0.6655. Further down, the 38.2% Fibo of 0.6634 could also provide support.
To sum up, the short-term risk is looking bullish at the moment.
Forex Technical Analysis: EUR/USD, USD/JPY, GBP/USD
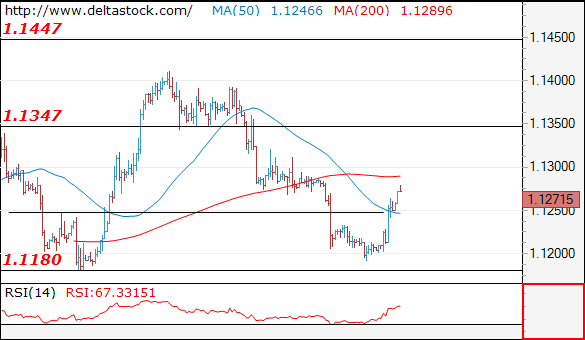
EUR/USD
Current level - 1.1271
The recent rise signals a reversal of the downtrend since 1.1410 high and the bias is positive, for a rise towards 1.1350, en route to 1.1450.
| Resistance | Support | ||
| intraday | intraweek | intraday | intraweek |
| 1.1320 | 1.1570 | 1.1250 | 1.1110 |
| 1.1410 | 1.1820 | 1.1180 | 1.1010 |
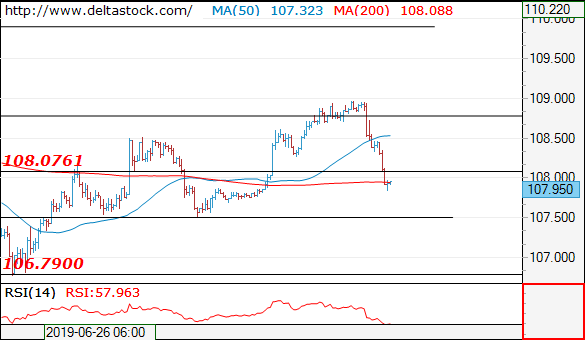
USD/JPY
Current level - 107.95
The uptrend is intact heading towards 109.80 hurdle. Crucial on the downside is 108.25 low. Initial intraday support lies at 108.60.
| Resistance | Support | ||
| intraday | intraweek | intraday | intraweek |
| 109.80 | 109.80 | 108.25 | 106.70 |
| 109.80 | 112.40 | 107.50 | 104.50 |
GBP/USD
Current level - 1.2527
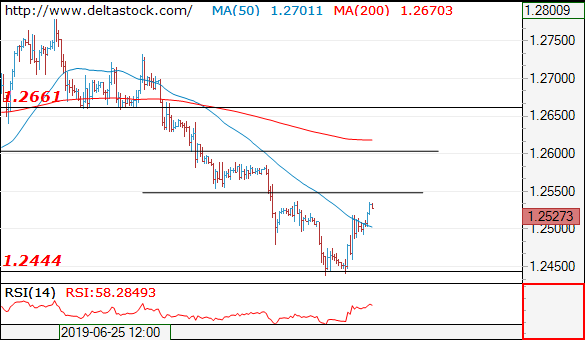
A reversal has been confirmed at 1.2440 and the bias is positive, for a rise through 1.2550, towards 1.2660.
| Resistance | Support | ||
| intraday | intraweek | intraday | intraweek |
| 1.2550 | 1.2890 | 1.2480 | 1.2440 |
| 1.2660 | 1.3170 | 1.2440 | 1.2360 |