

Sample Category Title
USD/JPY Tests Combined Resistance
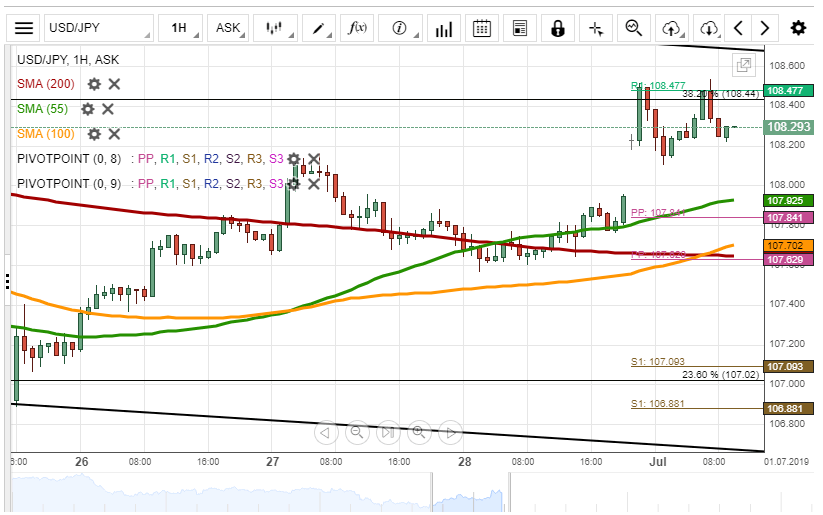
At the end of previous week, the JPY/USD currency pair skyrocketed to the resistance level formed by the weekly PP and the Fibonacci 38.20% retracement at 108.44. During today's morning, the pair was testing the given resistance.
Note, that the exchange rate was trading near the upper boundary of the medium-term descending channel, thus, it is likely, that some downside potential could prevail in the market.
However, it is unlikely, that the exchange rate could drop lower than 107.63/107.91 range due to the support cluster formed by the 55-, 100– and 200-hour SMAs, as well the weekly and monthly PPs.
On the other hand, the rate could trade sideways in the short run, trying to surpass the given resistance.
XAU/USD Might Reverse North
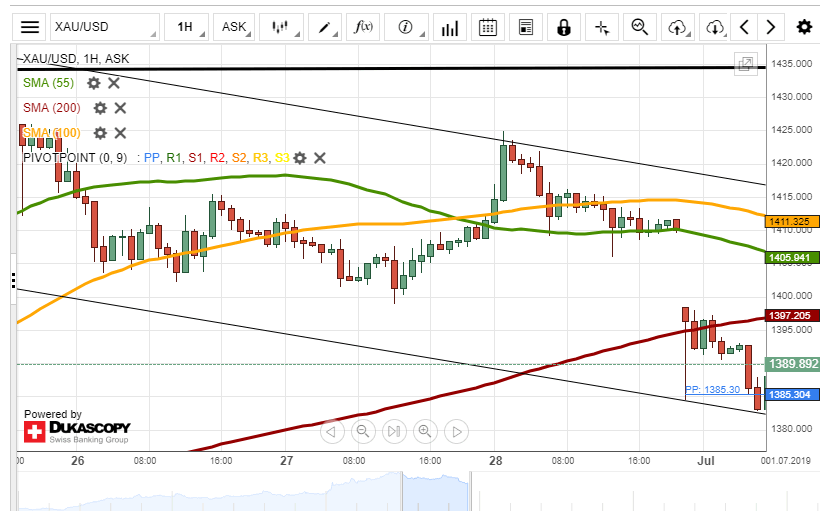
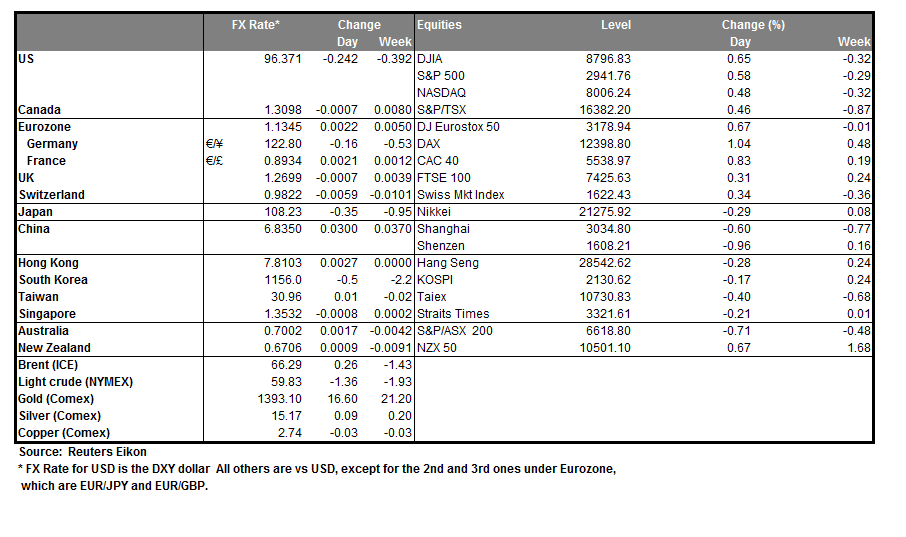
During Friday, the price for gold tumbled to the support level formed by the monthly PP at the 1,385.30 mark.
During Monday's morning, the XAU/USD rate was testing the given support. If it holds, it is expected, that gold could remain to appreciate against the US Dollar. However, note, that the rate has to surpass the 200-hour SMA at 1,397.20.
If the given resistance and support level hold, it is likely, that the exchange rate could trade sideways in the short term.
It is unlikely, that the price for gold could surpass the 1,374.77 mark due to the support level formed by the Fibonacci 23.60% retracement.
EUR/JPY Testing 50-Hour SMA
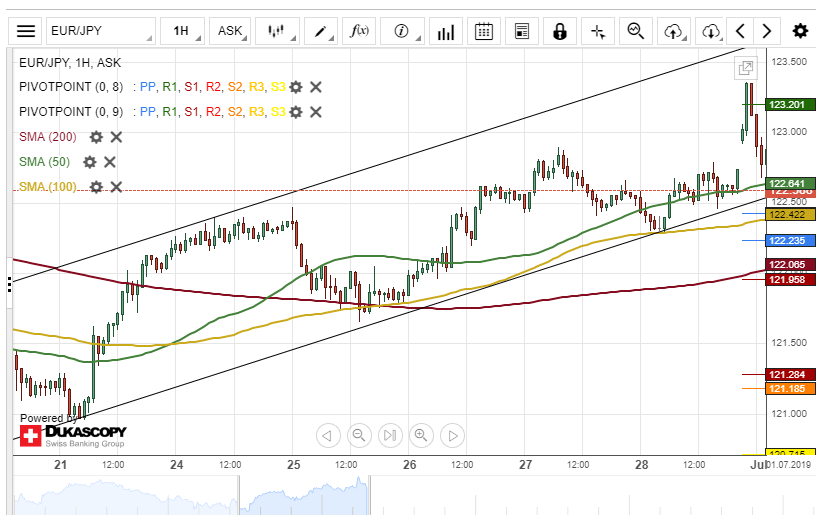
During the previous trading session, the Eurozone single currency rose by 0.85% in value against the Japanese Yen. The currency pair breached the weekly R1 at 123.20.
The EUR/JPY exchange rate is currently testing a support level formed by the 50-hour simple moving average at 122.64.
If this support level holds, the currency exchange rate will continue its upside movement within this session.
Though, if the pair passes the 50-hour SMA, a breakout through the bottom border of an ascending channel pattern could occur in a short while.
AUD/USD Breakout Occurs
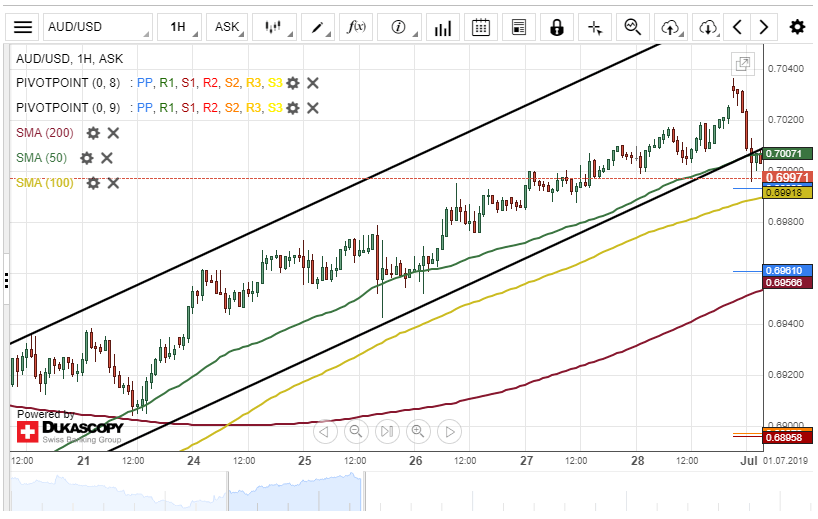
On Friday, the AUD/USD currency pair surged by 37 base points. The exchange rate reached a two-week high at 0.7020. However, today's trading session began with a bearish sentiment.
By the middle of the session, a breakout through the lower boundary of an ascending channel pattern at o.7006 had occurred.
Most likely, the US Dollar will continue to gain strength against the Aussie within this session.
The currency exchange rate might aim for a support cluster formed by the weekly S1 and the 200-hour simple moving average at 0.6954 today.
USD/CAD Remains Near 50-Hour SMA
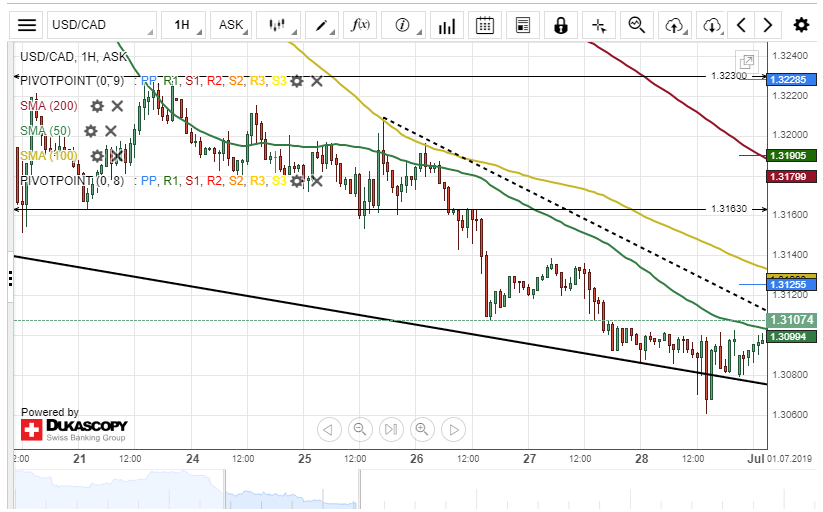
The USD/CAD currency pair bounced off the lower boundary of a falling wedge pattern at the end of Friday's trading session. The US Dollar tried to surpass a resistance level formed by the 50-hour simple moving average at 1.3100 during the Asian session on Monday.
If the Greenback versus the Loonie breaks the 50-hour SMA resistance level, a surge towards the 1.3163 could be the next target.
However, if the 50-hour SMA and the upper boundary of the falling wedge pattern holds, the currency exchange rate will continue its decline during the following trading session.
NZD/USD Might Slide Lower
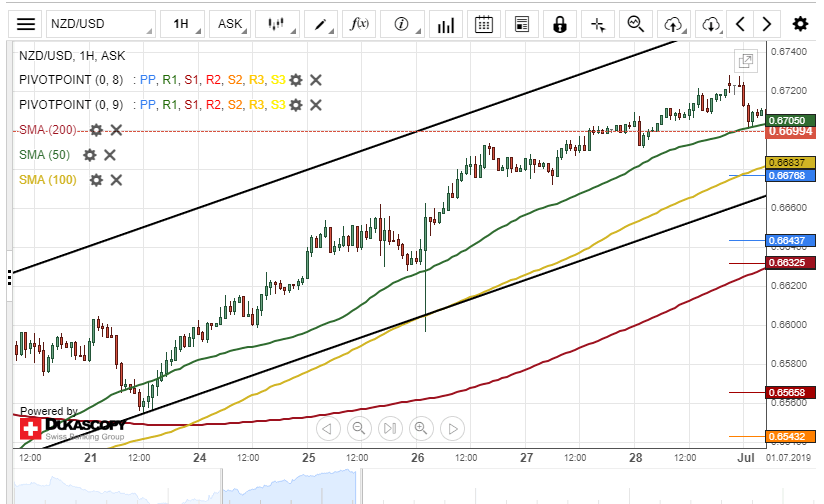
The NZD/USD exchange rate continued to trade with low volatility on Friday. The pair made about 28 base points movement during Friday's trading session.
As for the near future, most likely, the US Dollar will become stronger during the following trading session. The currency pair could aim for the lower boundary of an ascending channel pattern at 0.6678 today.
However, technical indicators demonstrate that the currency exchange rate could continue its upside movement within this session.
Meanwhile, the US ISM Manufacturing PMI macroeconomic data releases could provide more liquidity in the market today.
Eurozone unemployment rate dropped to record low, EUR/CHF steady
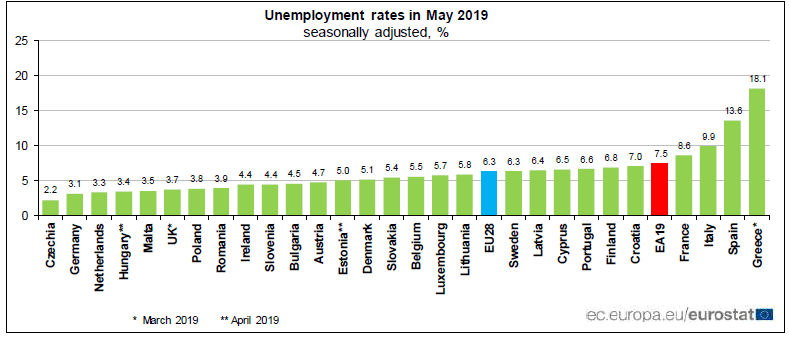
Eurozone unemployment rate dropped -0.1% to 7.5% in May, beat expectation of 7.6%. That's also the lowest level since July 2008. EU 28 unemployment rate also dropped -0.1% to 6.3%. Among the Member States, the lowest unemployment rates in May 2019 were recorded in Czechia (2.2%), Germany (3.1%) and the Netherlands (3.3%). The highest unemployment rates were observed in Greece (18.1% in March 2019), Spain (13.6%) and Italy (9.9%).
Also from Eurozone, M3 money supply rose 4.8% yoy in May, above expectation of 4.6%. PMI manufacturing was finalized at 47.6 in June, revised down from 47.8. From Germany, unemployment dropped -1k in June versus expectation of 0.0%. Unemployment rate was unchanged at 5.0% in June, matched expectations.
Economic data from Swiss posted bigger downside surprises. Swiss PMI manufacturing dropped to 47.7 in June, down from 48.6 and missed expectation of 49.0. Retail sales dropped -1.7% yoy in May, much worse than expectation of 0.6% yoy.
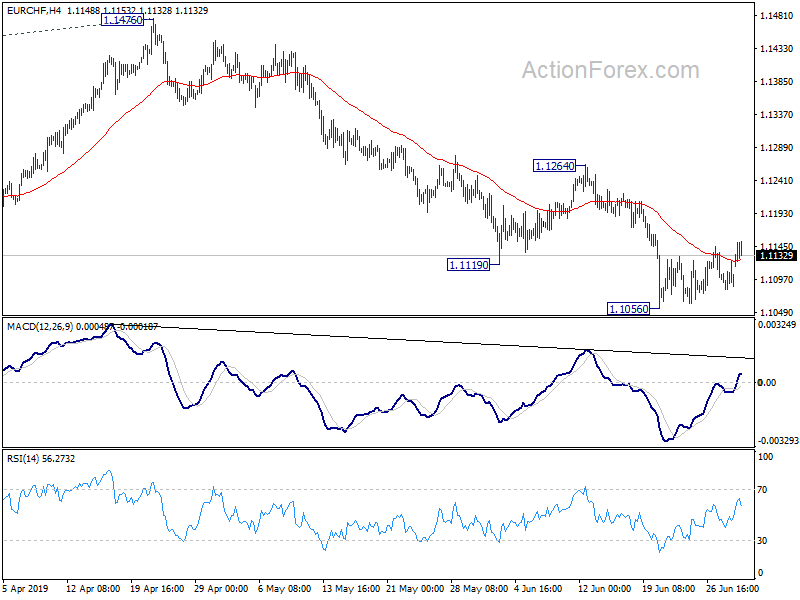
EUR/CHF is staying in consolidation from 1.1056 today despite volatility elsewhere.
US And China Agree A Trade Ceasefire At G20 Meeting
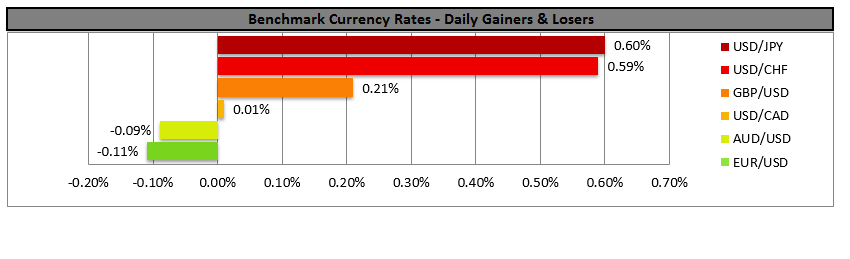
The presidents of the two largest economies struck a ceasefire in their trade wars on the G20 meeting, in Osaka, on Saturday. The ceasefire is according to reports, open-ended, providing some breathing space for diplomacy to get to work. Also according to news media, Trump is willing to let US companies sell products to Chinese tech company Huawei. It should be noted that the Osaka meeting marked an improvement also in the US-Turkish relationships. A side effect of the US-Sino ceasefire worth mentioning would be the possible curtailing of the Fed’s dovishness, as the outlook for the US economy may alter. We could see the USD gaining especially against safe havens such as the Yen and CHF, should the risk on sentiment return to the markets. USD/JPY opened with a positive gap during today’s Asian session, aiming for the 108.60 (R1) resistance line, yet retreated somewhat, later on. We maintain a bullish outlook for the pair, yet one should note that in the 4-hour chart the pair’s RSI indicator approaches the reading of 70, implying that the pair may be nearing an overbought position. Should the pair find fresh buying orders along its path, we could see it breaking the 108.60 (R1) resistance line and aim for the 109.15 (R2) resistance level. Should the pair come under the selling interest of the market, we could see it aiming if not breaking the 107.90 (S1) support line.
WTI prices jump ahead of OPEC meeting
Oil prices jumped early during the Asian session today ahead of the OPEC meeting, which is to take place today and tomorrow in Vienna, Austria. Media tend to note that Saudi Arabia, Russia and Iraq backed an extension of the supply cuts for another six to nine months ahead of the meeting. Saudi Energy Minister Khalid al-Falih said the deal would most likely be extended by nine months and no deeper reductions were needed. Given also the recent a ceasefire agreement between the US and China, we expect the need for further, deeper cuts in oil production to be subdued. Never the less, we continue to expect some support for oil prices should the extension of the current production levels be extended. Despite WTI prices dropping late on Friday aiming for the 57.70 (S2) support line, they opened with a positive gap during today’s Asian morning, breaking the 59.00 (S1) resistance line, now turned to support. We could see the commodity’s prices rise even further, should investors anticipate an oil market tightness ahead. Should the bulls dictate the pairs’ direction, we could see its prices, breaking the 61.00 (R1) resistance line. Should the bears take over, we could see WTI prices, dropping, breaking the 59.00 (S1) support line and aiming for the 57.70 (S2) support level.
Other economic highlights, today and early tomorrow
Today during the European session, we get Germany’s final manufacturing PMI and employment data, both for June, as well as UK’s manufacturing PMI for June. In the American session, we get the US ISM manufacturing PMI for June. During tomorrow’s Asian session, we get from Australia RBA’s interest rate decision, which could weaken the Aussie should another rate cut be decided
As for the rest of the week:
On Tuesday, we get from the UK the construction PMI for June. On Wednesday, we get from Sweden Riksbank’s interest rate decision, form the UK the Services PMI for June, from Canada May’s trade balance for May and from the US the factory orders growth rate for May and the same ISM Non-Mfg PMI for June. On Thursday, we get from Australia the retail sales for May. On Friday, we get from the US the employment report for June and from Canada the employment data for June and the Ivey PMI also for June.
WTI H4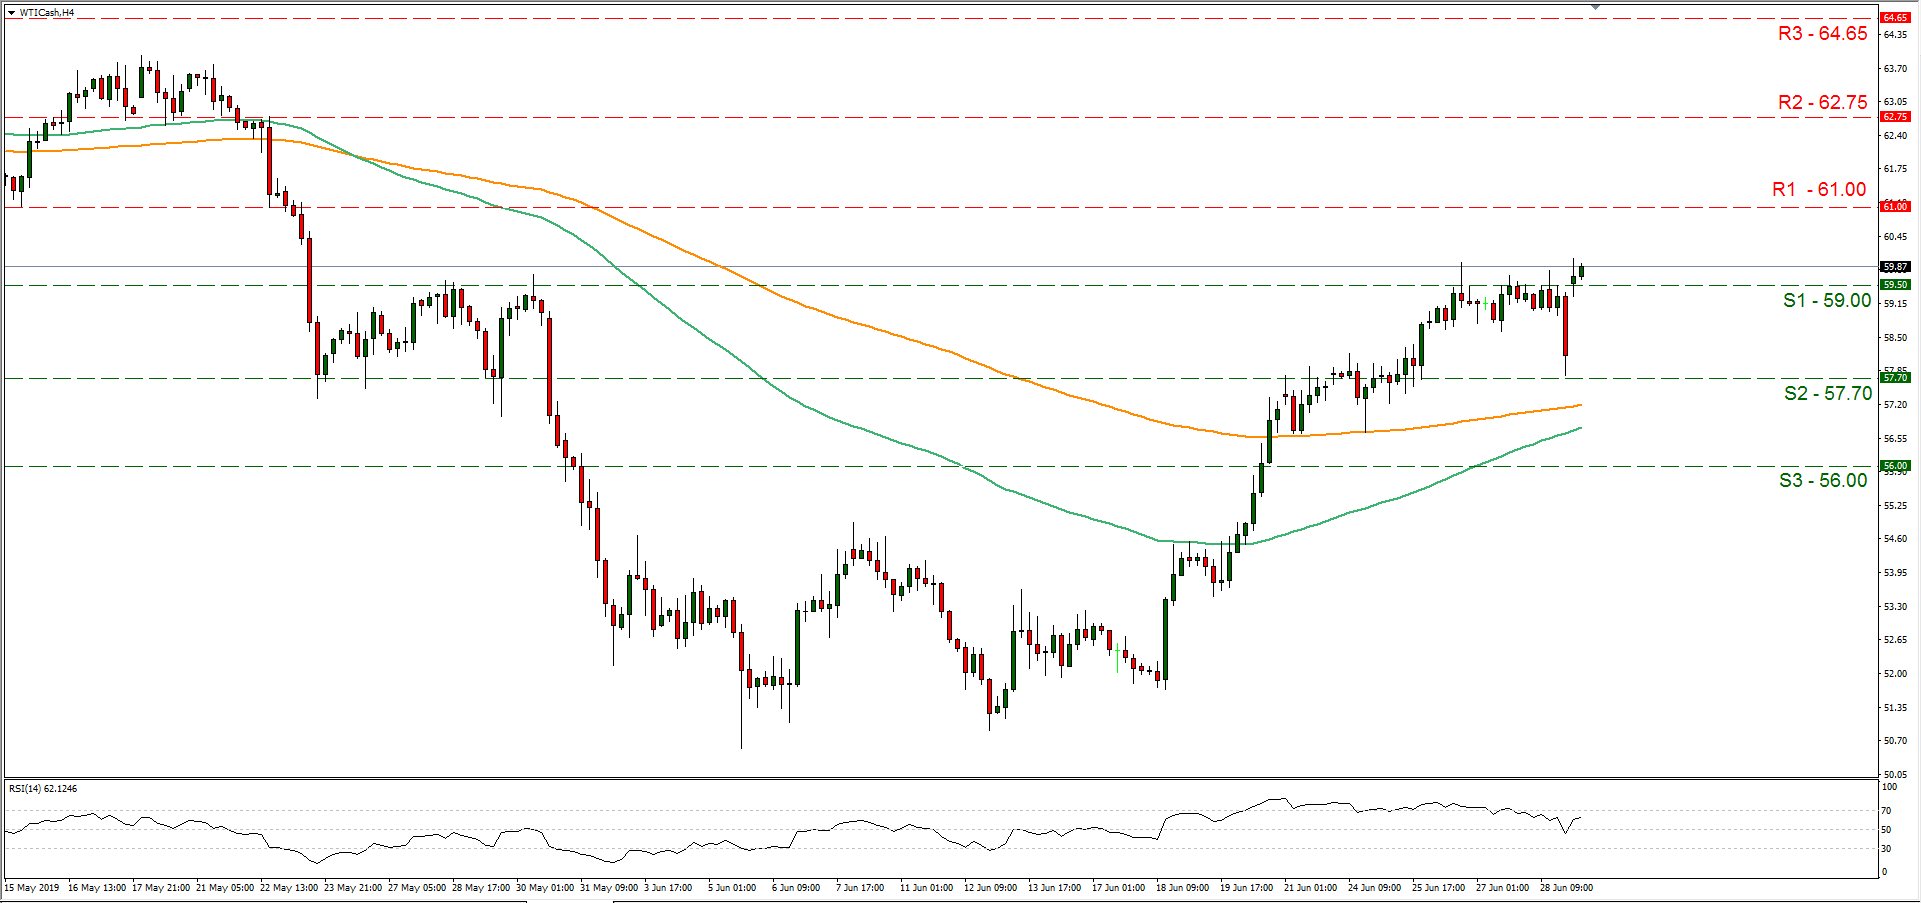
Support: 59.00 (S1), 57.70 (S2), 56.00 (S3)
Resistance: 61.00 (R1), 62.75 (R2), 64.65 (R3)
USD/JPY H4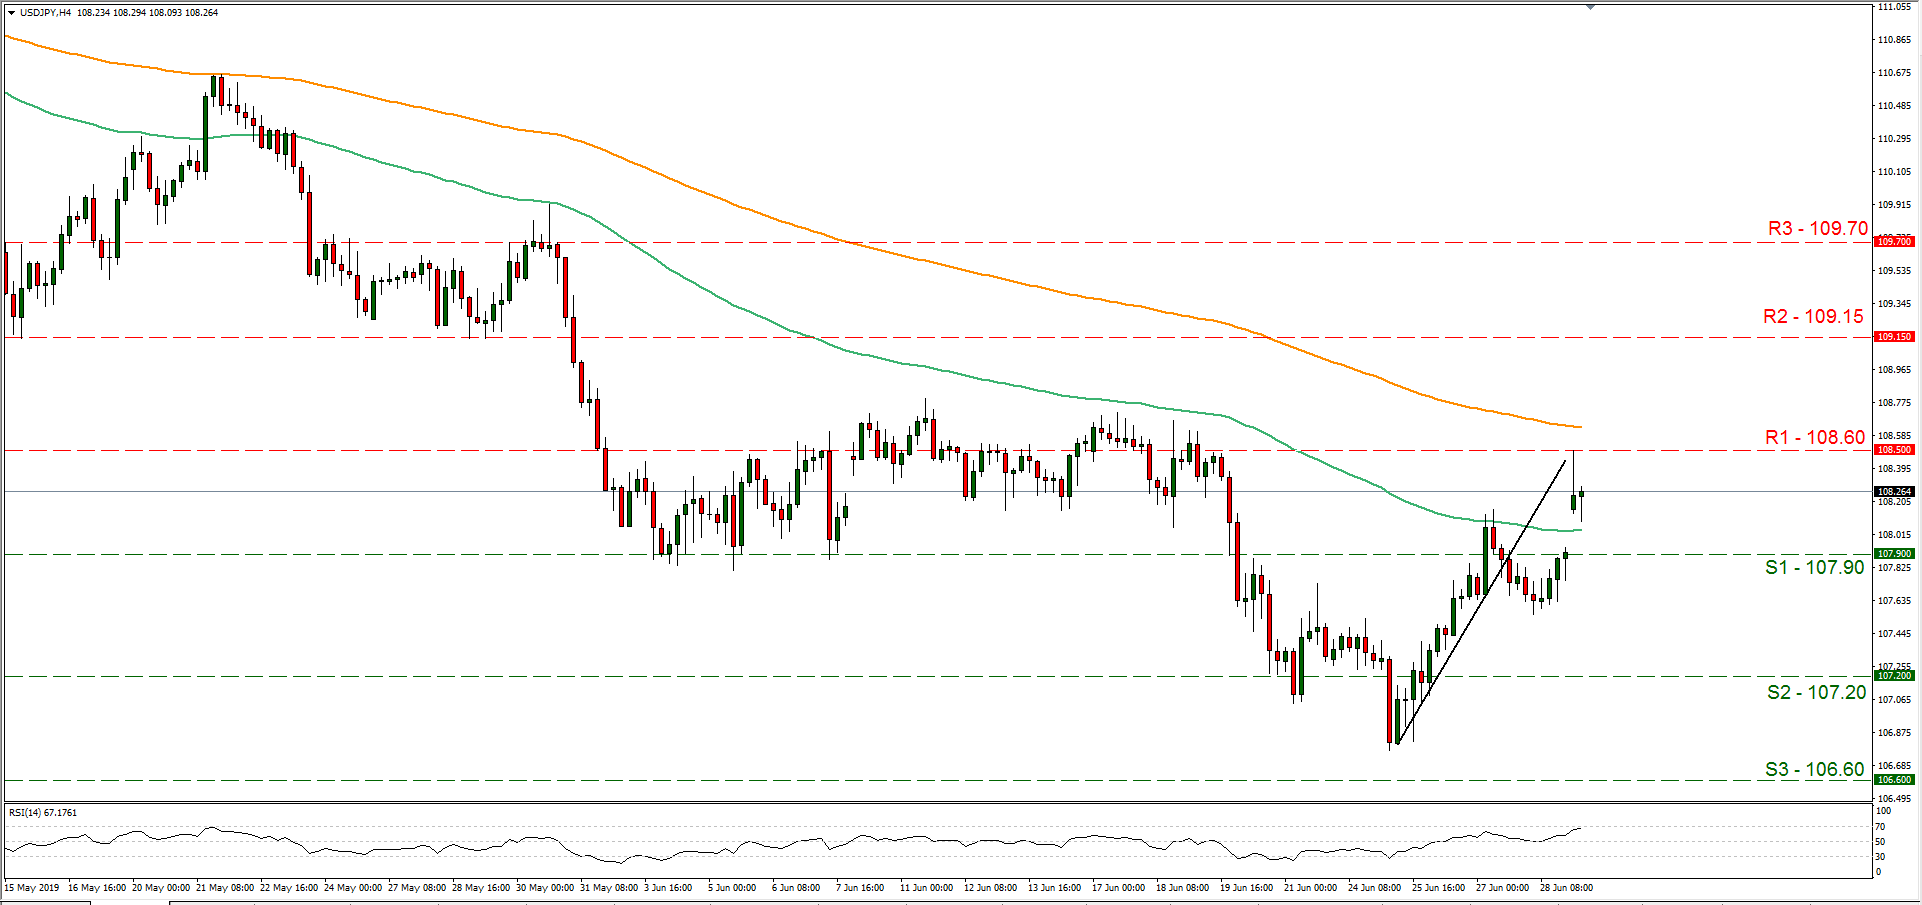
Support: 107.90 (S1), 107.20 (S2), 106.60 (S3)
Resistance: 108.60 (R1), 109.15 (R2), 109.70 (R3)
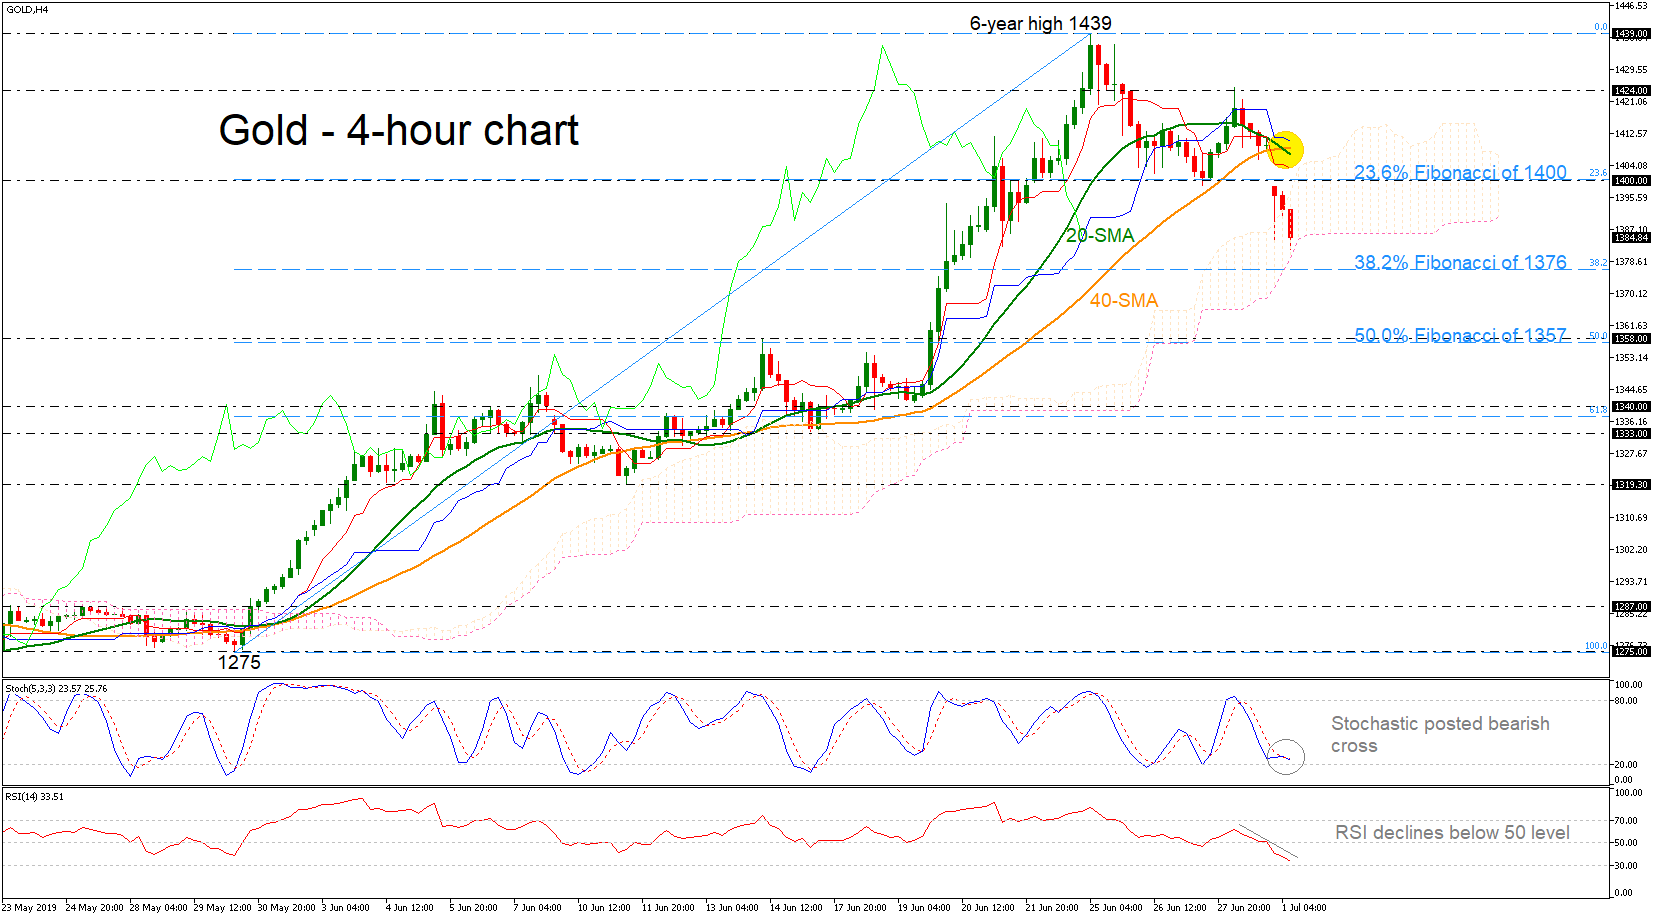
Gold Tumbles Inside Ichimoku Cloud, Bearish In Short-Term
Gold prices have reversed back down again after finding resistance at the six-year high of 1439 at the end of the preceding month.
Currently, prices are developing within the Ichimoku cloud and the red Tenkan-sen and the blue Kijun-sen lines are pointing down, suggesting more losses. The 20- and 40-simple moving averages (SMAs) posted a bearish crossover in the 4-hour chart, while the stochastic oscillator and the RSI are heading towards the oversold zone.
Further losses should see the 38.2% Fibonacci retracement level of the upward movement from 1275 to 1439 near 1376. A drop below this level would reinforce the short-term bearish sentiment and open the way towards the 50.0% Fibo region near 1357.
In the event of an upside reversal, the 1400 handle, which overlaps with the 23.6% Fibonacci mark could act as significant resistance before touching the bearish cross of the SMAs around 1408. A run above these levels would drive the yellow metal towards the 1424 hurdle, taken from the latest highs.
However, for a resumption of the last month’s bullish rally, gold prices would need to beat the six-year high of 1439.
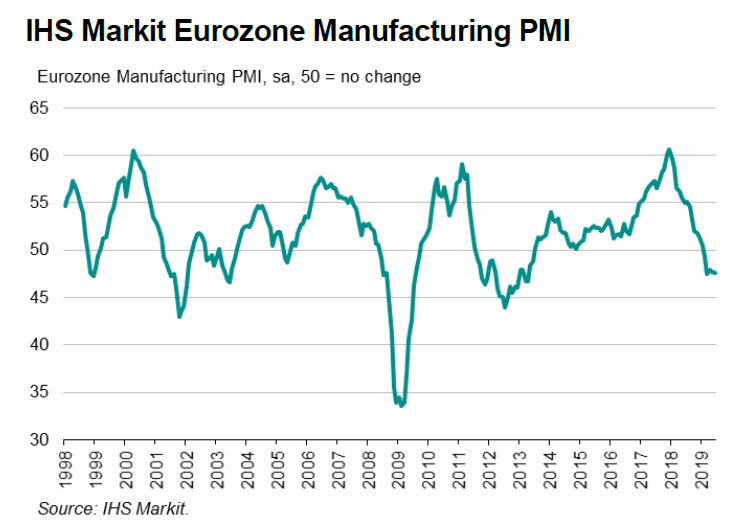
Eurozone PMI manufacturing finalized at 47.6, remained stuck firmly in a steep downturn
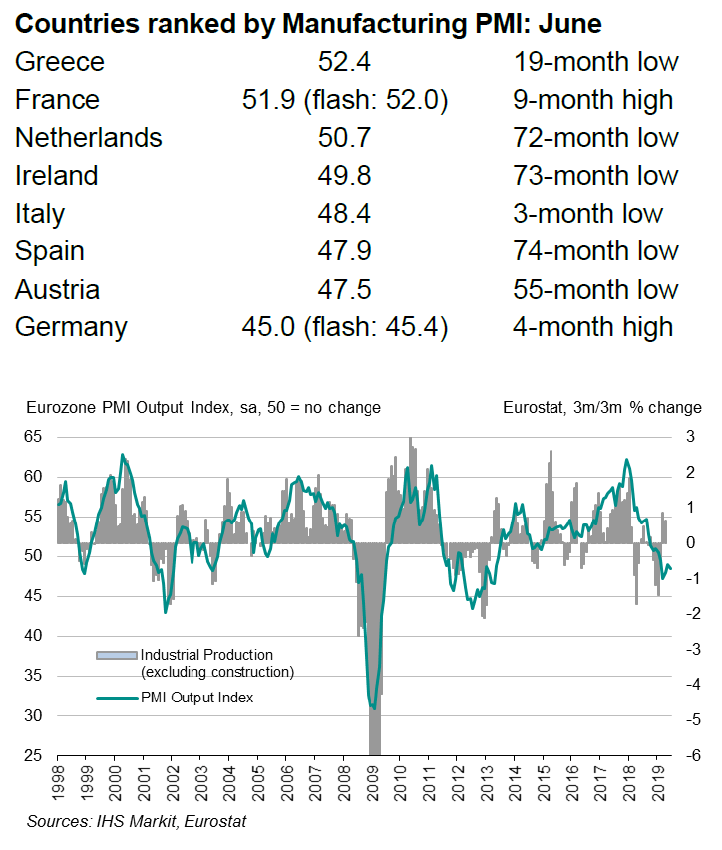
Eurozone PMI Manufacturing was finalized at 47.6 in June, revised down from 47.8, versus May's 47.7. Among the member states, Germany reading was revised down to 45.0, but that was a 4-month high. Austria dropped to 55-month low at 47.5. Spain dropped to 74-month low at 47.9. Italy dropped to 3-month also at 48.4. Ireland dropped to 72-month low at 49.8. All these readings are contractionary.
Expansionary reading including Netherlands at 50.7, but that's still at 73-month low. France was revised down from 52.0 to 51.9, a high month high. Greece dropped to 19-month low at 52.4.
 Commenting on the final Manufacturing PMI data, Chris Williamson, Chief Business Economist at IHS Markit said:
"Eurozone manufacturing remained stuck firmly in a steep downturn in June, continuing to contract at one of the steepest rates seen for over six years. The disappointing survey rounds off a second quarter in which the average PMI reading was the lowest since the opening months of 2013, consistent with the official measure of output falling at a quarterly rate of approximately 0.7% and acting as a major drag on GDP.
"Deteriorating inflows of new work meanwhile meant manufacturers increasingly focused on keeping costs down, notably by cutting staff numbers and warehouse stocks.
"The downturn is also increasingly feeding through to lower inflationary pressures, as producers and their suppliers compete on price to retain customers and generate sales. In stark contrast to the steep rise in producers' costs and charges seen at the start of the year, raw material prices are now falling for the first time in three years and selling prices are barely rising.
"The downturn is also showing no signs of any imminent end. The survey's forward-looking indicators remained worryingly subdued in June, adding to concerns about the economy in the second half of the year."