Sample Category Title
Countries that Profit from the Trade War with China
Who Gains From China's Pain? Mostly Vietnam, Mexico and Eurozone
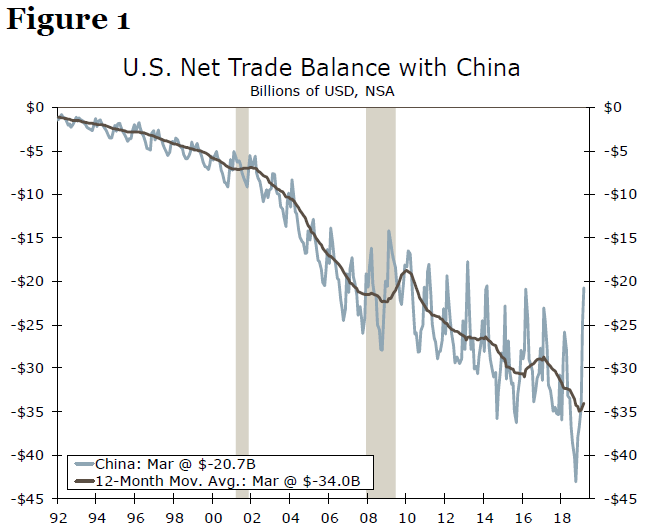
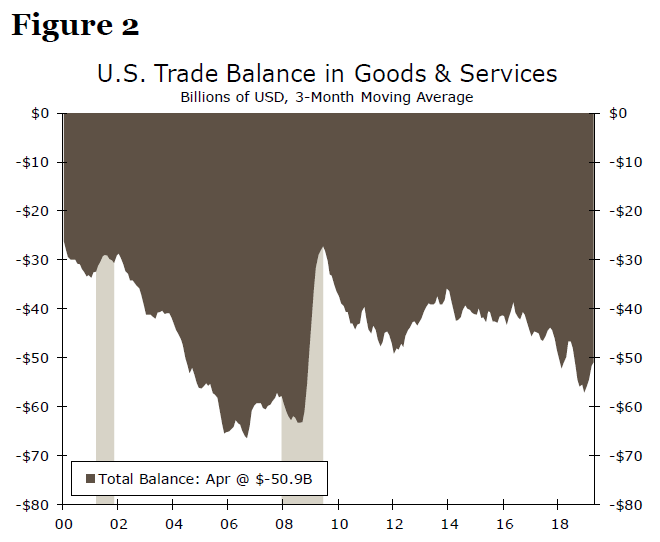
Tariffs have reduced imports into the United States from China and reversed (at least temporarily) a decades-long expansion of the U.S. trade deficit with that country (Figure 1). Yet the trade war has not reduced total imports nor has it made a dent in the overall trade deficit (Figure 2). In fact, since the start of 2017, the trade deficit has widened 16.8%. Perhaps eventually production will shift back to the United States, but so far, there is not much evidence to support that supposition.1 Instead, domestic importers are re-routing foreign supply chains. In this special report we look at how this global shift has impacted U.S. trade and which economies have benefitted. It is early days yet, but not too early to glean insights from what the data are telling us about who is benefiting from the trade war. The winners vary by industry, but the key benefactors appear to be Vietnam, Mexico and the Eurozone.
How Do You Measure Something Like That?
The first step in our analysis is to identify the largest categories of imports from China, to capture a snapshot prior to the trade war. The tariffs on $200 billion of various Chinese goods went into effect in September 2018, although steel and aluminum tariffs went into effect in June of last year and other tariffs impacting China (on solar panels and washing machines) date back to the start of 2018. On that basis, we selected 2017, the year prior to the introduction of the various tariffs.
In 2017, the three biggest U.S. import categories from China were computers, electronics and machinery & other manufacturing2. Taken together, these three categories comprised 60% of all U.S. imports from China in 2017.
The next step is to look at how trade with other foreign economies changed in the first four months of this year compared to 2017.3 We analyzed U.S. trade data with the rest of the world to identify countries from which the United States sources goods of those same four categories to determine which foreign economies have benefitted the most from the imposition of tariffs on China.
How we do it: For each of the three identified import categories, we divided U.S. imports during the first four months of 2019 for every country in the world by the total U.S. imports in that category. This gives us a "global share of U.S. imports" for each country. We then compare that global share of imports for the first four months of 2019 to the comparable share from 2017. By subtracting the 2017 share from the 2019 share, we are able to identify which foreign economies have seen the most growth in its respective share of imports for that category.
R2-D2, You Know Better than to Trust a Strange Computer
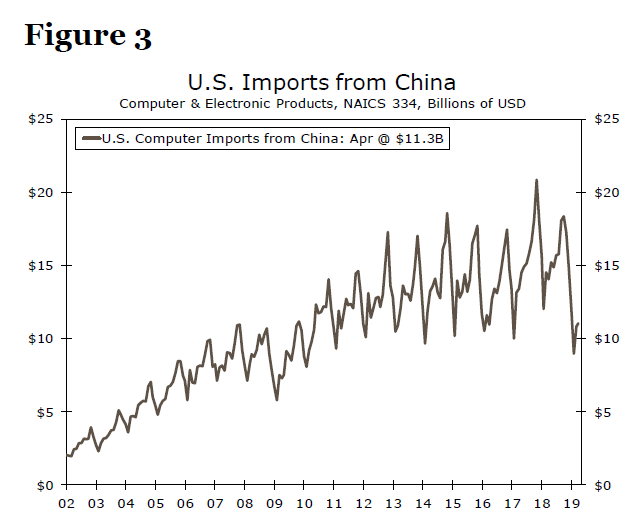
No category is more essential in the U.S. trade relationship with China than computer and peripheral equipment. In 2017, this category alone accounted for more than a third of all imports from China. But further, look at imports from China as a share of the total U.S. imports in this category and we see that China is America's most vital import source providing 46% of all imports and comprising (by far) the largest share of imports globally for computers.
Even in the face of tariffs and the well-publicized battle with Chinese company Huawei, a maker of diversified technology and consumer electronics products, China remains the top foreign source for this category. That said, the share has fallen to just 35.8% through the first four months of 2019.
So while China's role as a foreign source of computer products is still significant, it is clearly wilting under the pressure of tariffs. So as supply chains shift, what foreign economies are taking up the slack?
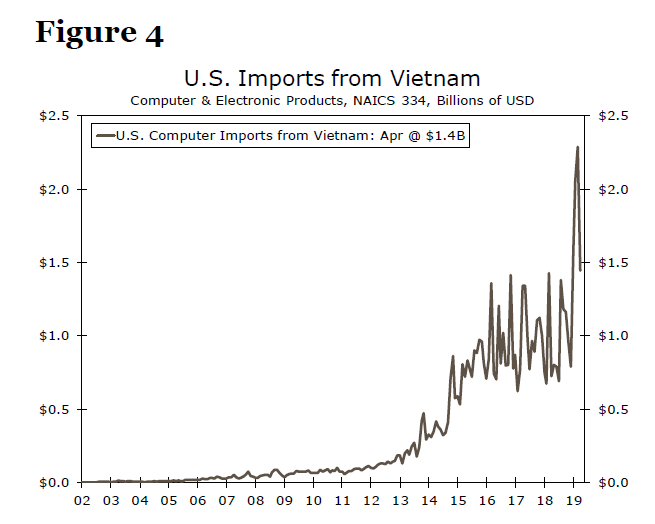
Vietnam more than doubled its share of U.S. computer imports to 6.2% share in the first four months of 2019 from a 2.9% share in 2017. The doubling of exports overnight has been met with skepticism and doubts about the authenticity of Vietnam as the genuine, bonafide manufacturer of all of these new imports. The net increase of 3.2 percentage points was the largest pick-up of any country. Taiwan, a global leader in semiconductors, saw the second largest share increase, adding 2.1 percentage points to its proportion of computer-related U.S. imports.
Mexico, South Korea and the Eurozone rounded out the top five economies that have picked up the slack as China's share of U.S. computer imports has shrunk.
Electrical Products: 220, 221…Whatever It Takes
The category of electrical products includes a number of consumer durable goods categories like washers, dryers and refrigerators as well as smaller household appliances. This is the second largest category that China supplied to the United States in 2017. However, by virtue of the fact that this category includes washing machines, it was subject to tariffs in January 2018, eight months earlier than the broader basket of Chinese goods that went into effect in September 2018. So at least a portion of this category has some more history of being subject to the tariffs.
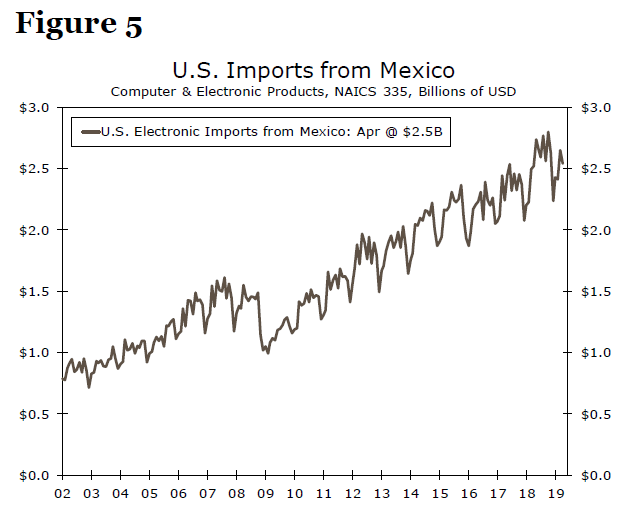
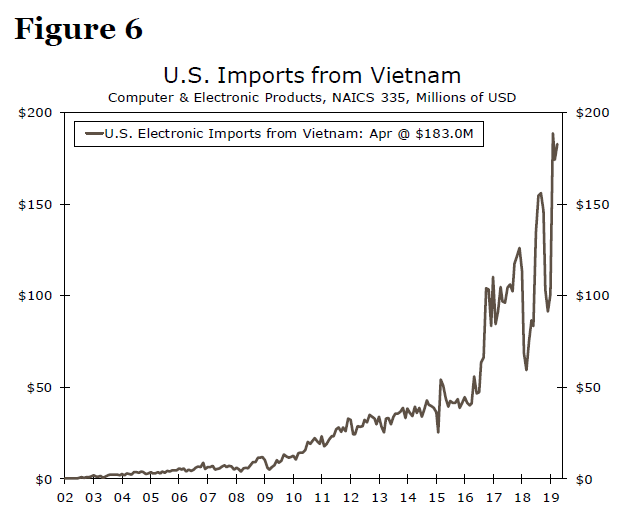
When we look at how importers are shifting supply chains for this category, we find that Mexico is the largest beneficiary. That said, even before the tariffs went into effect, Mexico was already the second largest foreign supplier of electronic equipment to the United States. The tariffs may have helped cement Mexico's role as a U.S. supplier of electronic products even though it has seen trend improvement for the past decade (Figure 5). For more of a "pure-play" tariff substitution, Vietnam offers another eyebrow-raising spike in shipments of electronic equipment destined for the United States (Figure 6). The Eurozone, Malaysia and Thailand have also all seen an increase in their share of U.S. imports of electronics.
Industrial Evolution
Our third and final category combines miscellaneous manufacturing with the much larger equipment manufacturing. This category include agricultural equipment, general-purpose machinery, lawn and garden equipment, HVAC components and construction equipment among many other categories. As China's share of the U.S. equipment market has been cut amid the ongoing trade war, where has America turned to make up the shortfall?
Japan has long been a key import partner in this category and the island nation has seen its share increase to 9.8% in the first four months of 2019 from 9.0% of U.S. machinery manufacturing imports; that is enough to take the top spot in terms of largest growth since 2017. Mexico and the Eurozone are tied for second in terms of growth in the share of U.S. machinery imports. Machinery imports from Mexico and Japan are about the same size; both have roughly a 10% share of overall U.S. machinery imports. The Eurozone supplies about as much as both Mexico and Japan combined; 21.3% in the first four months of 2019. China's share for the same period was 22.2% and falling fast from the 26.3% share it commanded back in 2017. Without a quick resolution to the trade war, it is likely that the Eurozone will displace China as the largest foreign source for U.S. machinery imports.
Conclusion
When China joined the World Trade Organization in 2001, the U.S. trade deficit with China was about $83 billion. That deficit ballooned to more than four and-a-half times that amount over the 16 years to $375 billion in 2017. The tariffs imposed on Chinese imports have turned that trend around as the United States has imported less from China in the first four months of this year.
But the United States is not importing less overall. In fact, since the start of 2017, the trade deficit has widened 16.8%. With no demonstrable evidence that U.S. domestic production is making up for the drop-off in Chinese goods imports, the trade data tell us where U.S. importers are turning.
The winners vary by industry as we have endeavored to describe in this report, but the key benefactors are Vietnam, Mexico and the Eurozone. Whether or not the overnight shift to Vietnam for a number of key categories is a genuine transition or just a shell game is beyond the scope of this report. Perhaps the larger point here however is rather than spurring domestic production, the tariffs are instead shifting global supply chains to other foreign trading partners.
1 We analyzed U.S. domestic production by NAICS code for the four industries in our analysis, which together comprise 60% of Chinese imports. None of these categories have yet demonstrated a discernable departure from trend-growth since the implementation of tariffs.
2 For categories we are using North American Industry Classification codes, specifically: (334) computer & peripheral equipment manufacturing, which we call "computers", (335) electrical equipment, appliance, & component manufacturing, which we call "electronics." We combine (339) miscellaneous manufacturing and (333) machinery manufacturing and for the purposes of this report refer to both as simply "machinery & other manufacturing". Note: the category (315) apparel would be in the top five, but we left it out as the tariffs do not yet apply to apparel from China.
3 In the absence of readily available seasonally adjusted data, we compare the first four months of 2019 to full-year 2017 on a non-seasonally adjusted basis. In reviewing the prior year's data, share allocations for the first four months are indicative of full-year trends.
As the OPEC Meeting Concludes, What’s Next for Oil?
The Organization of Petroleum Exporting Countries (OPEC) is meeting in Vienna, and the latest headlines suggest a nine-month extension of the existing production cuts is nearly certain. With OPEC’s output plans now clear, oil prices will take their cue from how the US-China trade talks and the situation with Iran unfold. Trade optimism may keep crude supported for now, with the risk of a corrective pullback increasing drastically if the talks show no real signs of progress later in the summer.
Oil prices started the week on a strong footing, with WTI briefly crossing above the psychological $60/barrel handle, following encouraging news on both the demand and supply fronts. First and foremost, the US and China agreed to restart trade negotiations, painting a brighter picture for future oil consumption. On the supply side, Russian President Vladimir Putin confirmed that he reached an accord with the Saudi Crown Prince to extend the OPEC+ production cuts.
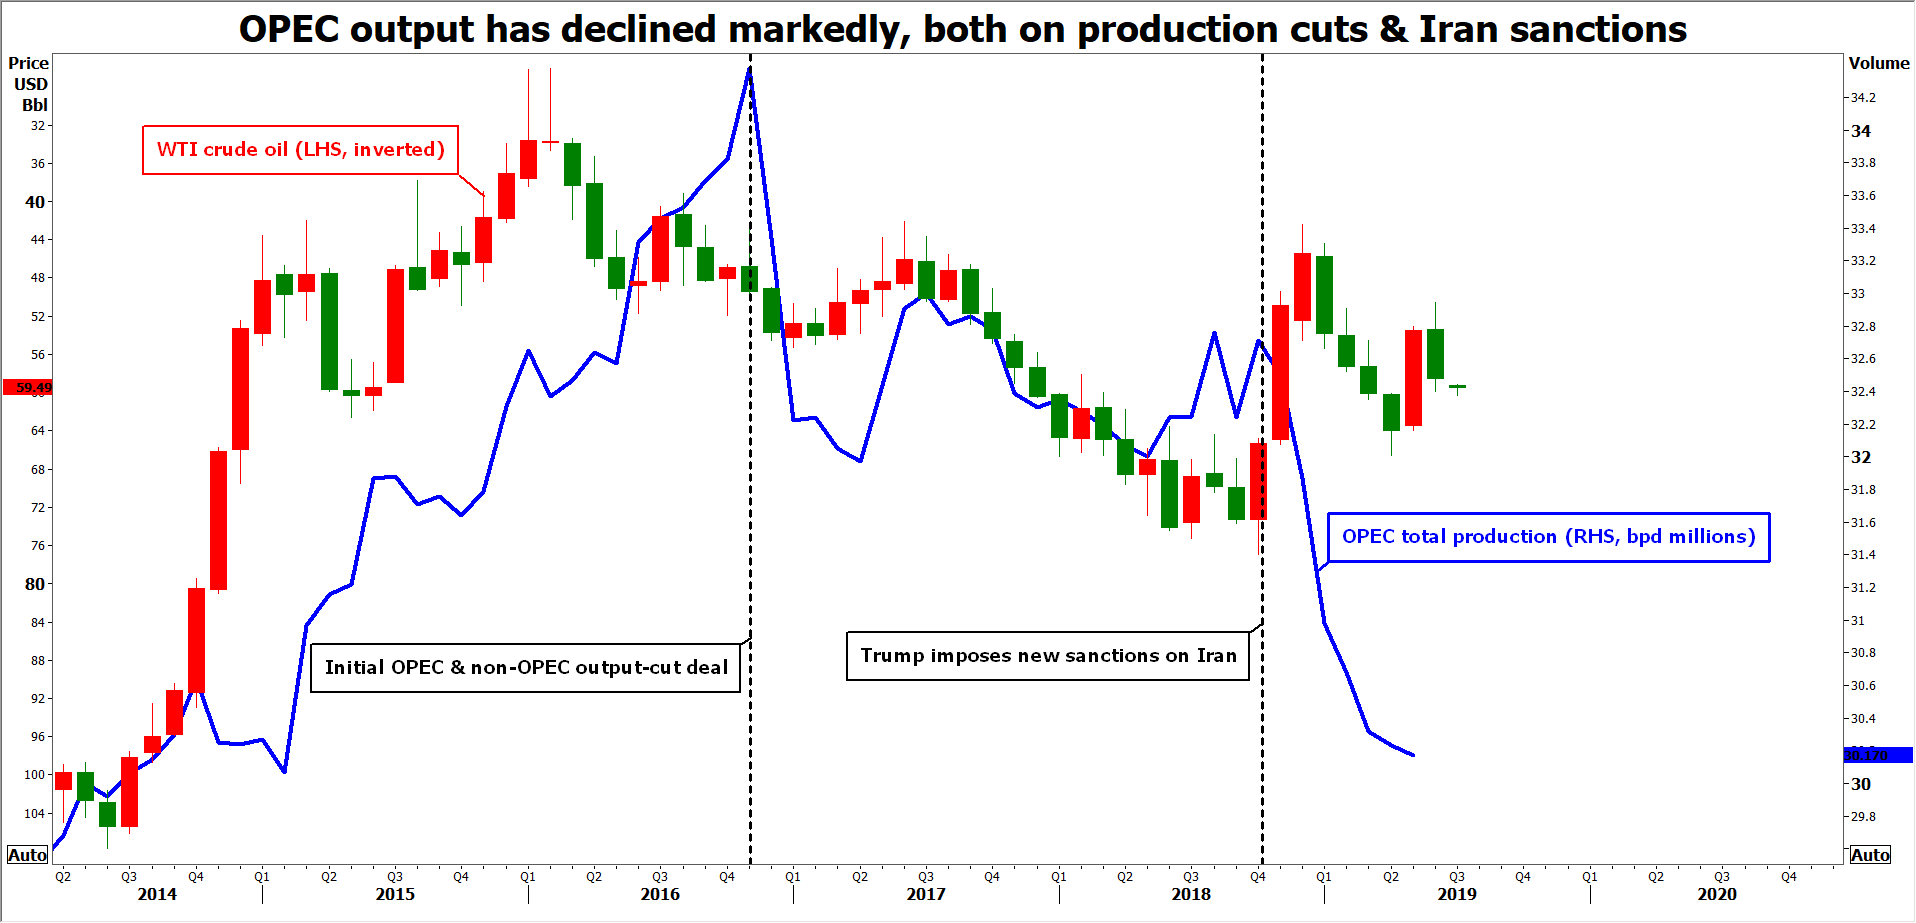
The latter headline took the spotlight off the OPEC meeting that is currently underway in Vienna, as the only thing left to decide seems to be how long this extension will be. The latest headlines suggest the producers are leaning towards a nine-month extension, which if officially confirmed could provide a small boost to oil as the longer these output restrictions are in place, the better for prices from a supply perspective.
All about demand
Looking past this week though, what will probably matter most for crude’s overall direction is how the US-China trade talks unfold. In that sense, while the resumption of negotiations is clearly a positive sign, it’s still doubtful whether a comprehensive accord can be reached. The two sides remain far apart on some crucial issues, for example on intellectual property protection and a mechanism to enforce any agreement. Hence, the road to any deal is likely to be rocky and full of twists, if one is even possible that is.
For oil, that means that prices can still climb from here as the negotiations commence again and optimism runs high – but that the likelihood of a corrective pullback increases significantly from there on out. Not least due to the risk of another round of escalation later in the year, if Trump thinks China’s concessions are not big enough or that Beijing is stalling for time until next year’s US elections.
Iran is the wildcard
With OPEC’s near-term production plans now more or less clear, the biggest uncertainty on the supply side is Iran. Once OPEC’s second-largest exporter, the nation’s oil production has fallen drastically in recent months, as the US sanctions started to bite.
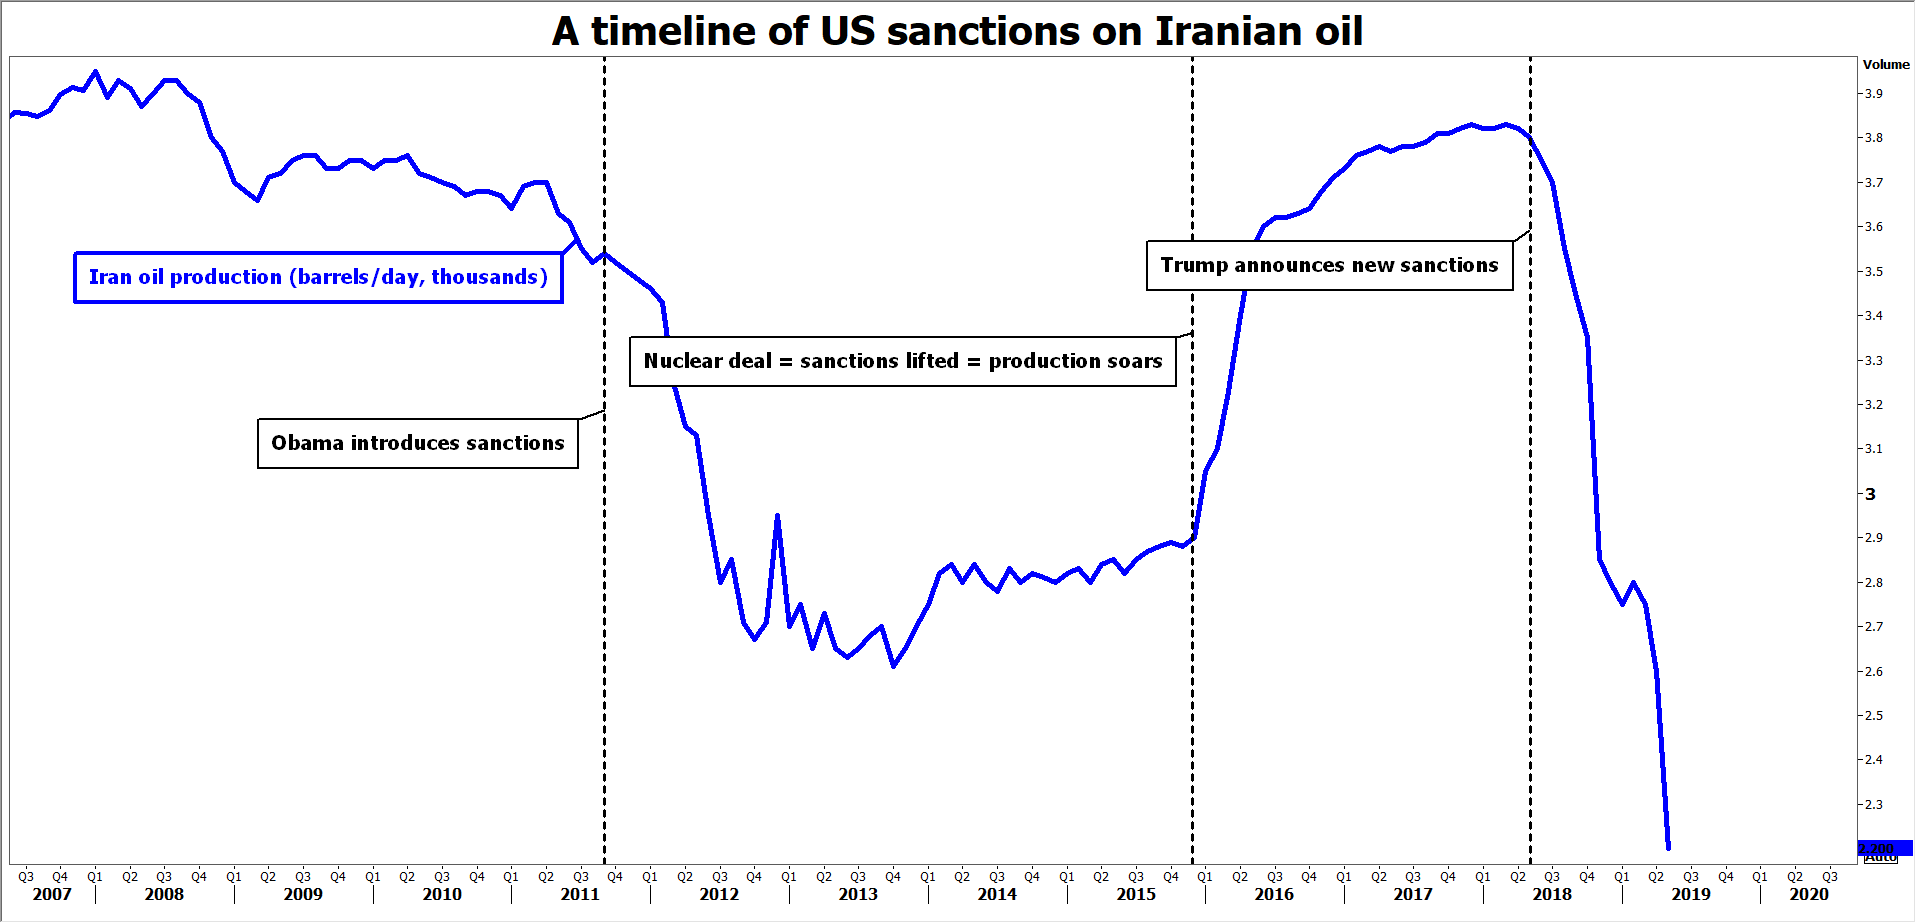
Tensions are near a boiling point, with recent reports suggesting that President Trump called off a military strike on Iran ‘at the last minute’, after Tehran shot down a US drone. The bottom line is that it’s difficult to see a diplomatic solution, so Iran’s output may still have room to fall if tensions escalate any further. This presents a ‘low-probability-but-high-impact’ upside risk for oil.
The technical outlook
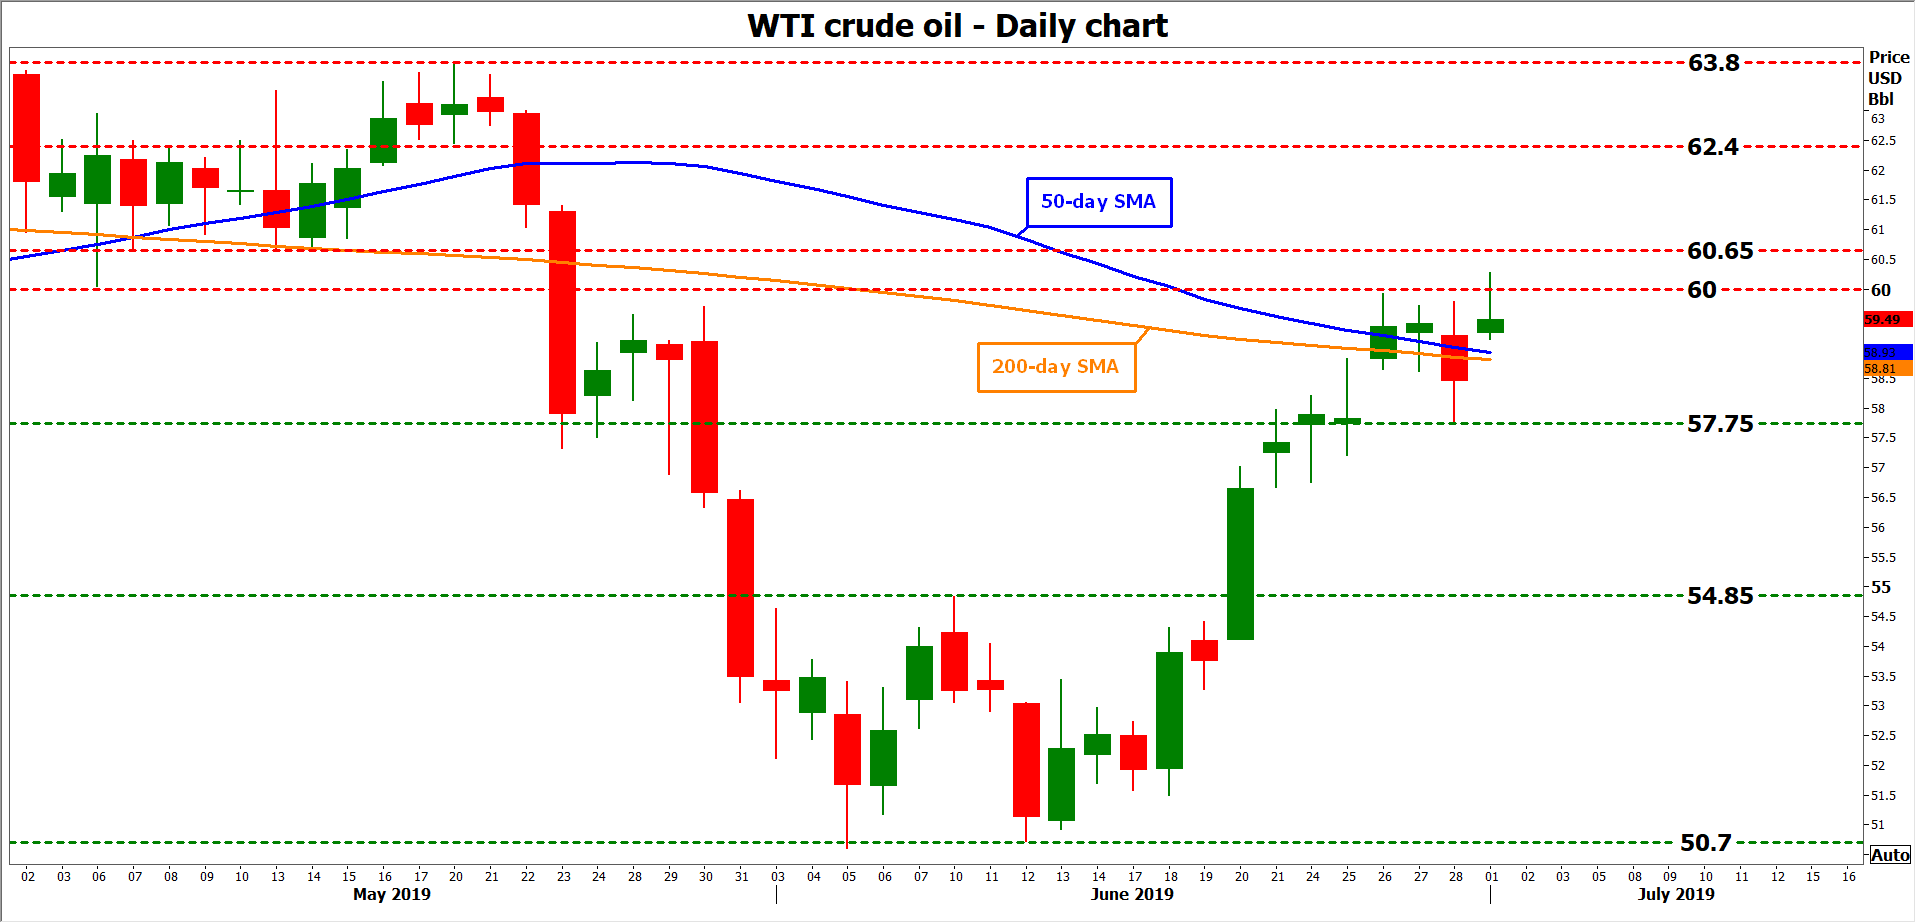
Taking a technical look at WTI, another wave of advances could stall initially near the psychological 60.00 mark, with an upside violation seeing scope for a test of the 60.65 region – marked by the lows of May 13.
On the other hand, a pullback in the market may meet support around the June 28 lows at 57.75, where a bearish break may open the door for the 54.85 territory.
Sunset Market Commentary
Markets
Global core bonds marginally lose ground today with German Bunds outperforming US Treasuries. The bond market initially faced bigger losses in the wake of the renewed US/Sino trade truce while equities were (and still are) well bid. This classic risk on correlation did not hold throughout the session however as markets realized the trade thaw won’t alter the Fed’s assessment anytime soon (read: rate cuts are still considered all but a done deal). A series of disappointing (final) European PMI’s (Spain, Italy, Germany, EMU wide …) also took their toll on (German) bond yields. Core yields slipped even further at the start of US dealings, eventually erasing all US yield gains (+ 3 bps) during the Asian session. The US yield curve is virtually unchanged vs. last Friday. German yields decline with the belly of the curve outperforming (5-yr: -1.5 bps, 10-yr: -2 bps). Peripheral spreads narrow significantly with Greece (-10 bps) and Italy (-9 bps) outperforming. Italy’s 10y yield touches 2% for the first time since May 2018 despite having the manufacturing PMI sink deeper into contraction territory (48.7).
EUR/USD dropped from the mid 1.13 area to fill bids just below 1.1320 early this morning. The move was at least partially due to USD strength. US yields rose after the truce in the US-China trade conflict, gave the dollar some, albeit modest, additional interest rate support. EMU eco data were mixed. The June EMU manufacturing PMI was slightly downwardly revised (47.6), but the EMU unemployment rate dropped to 7.5%. The political stalemate in the negotiations to fill several European top jobs, including the job of head of EU commission, maybe was a slight euro negative too, but we assume it was only of second tier significance. In the run-up to the US trading session, EUR/USD was even captured by an intraday short-squeeze reversing the loss from this morning. US yields also reversed the intraday uptick. US investors are apparently not convinced the trade truce will profoundly change the prospect of Fed rate cuts further out this year. EUR/USD is trading in the 1.1350 area. USD/JPY hovers around 108.30, awaiting the release of the US manufacturing ISM.
At the end of last week and this morning, it looked that a test of the EUR/GBP 0.90 barrier was one step too high to be cleared short-term. Sterling apparently entered calmer waters. EUR/GBP filled bids in the 0.8925 area early this morning. However, soon it appeared that there was enough reason for investors to stay cautious on sterling. Candidate UK PM Hunt was said to embrace the idea of tax cuts and other fiscal stimulus to support the economy in case of a no deal Brexit. So, it looks that both contenders in the race to become UK PM still see a decent chance of the scenario finally becoming true. At the same time, UK June manufacturing PMI dropped further into contraction territory. UK May money supply and credit data were also unconvincing. The case for a BoE rate hike looks ever smaller. EUR/GBP reversed its earlier decline and is again trading in the 0.8960 area. Cable hovers in the 1.2660 area, off the intraday low, as the dollar is losing some momentum intraday.
News Headlines
After meeting with his Turkish counterpart Erdogan, president Trump hinted he might reconsider his threats to sanction the country over its military purchases from Russia. The Turkish lira advanced + 3% to EUR/TRY 6.4 amid a general risk on environment.
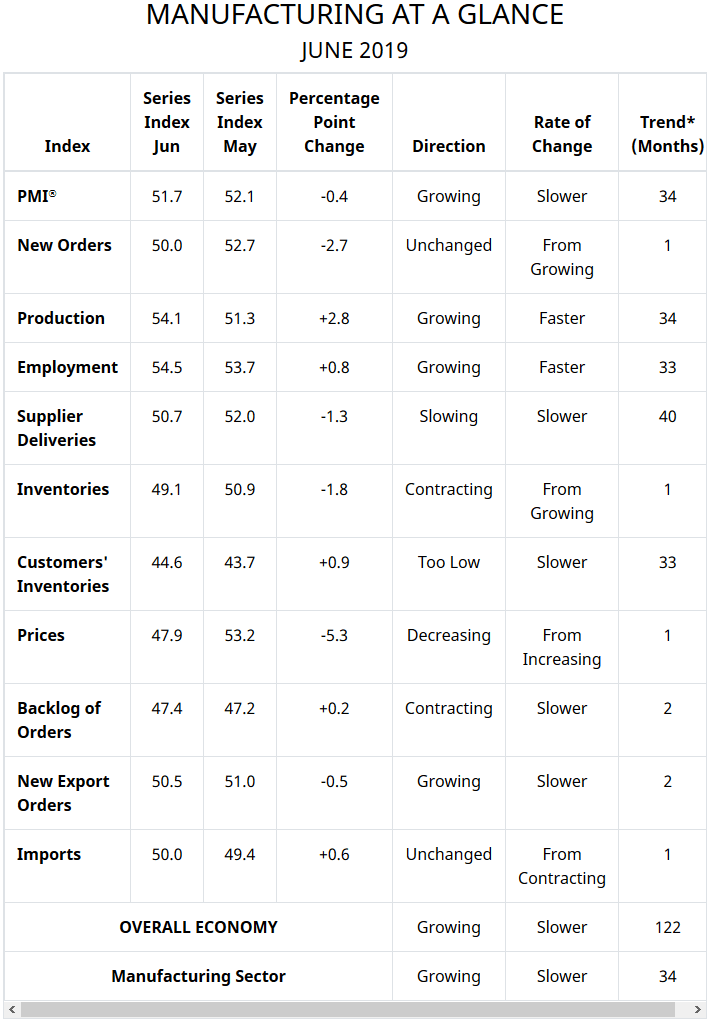
The US manufacturing ISM declined less than expected from 52.1 to 51.7 in June. The employment component edged higher to 54.5 but the new (export) orders subseries showed orders basically flatlining. Production (54.1) ticked up from last month poor reading (51.3).
AUD/USD Outlook: Aussie Pulls Back from New Two-Month High ahead of Expected RBA Rate Cut
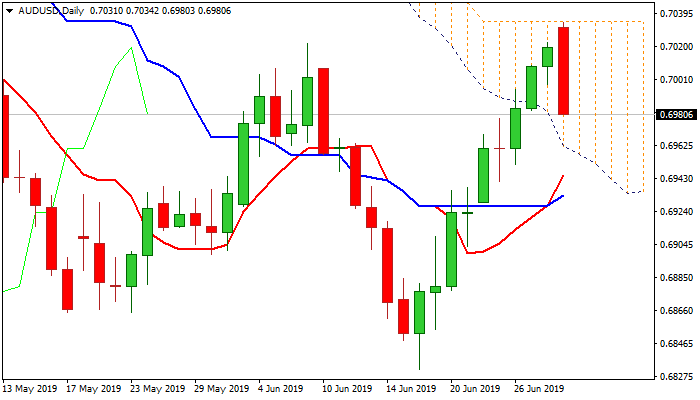
The Australian dollar pulls back after rallying in past nine days, as advance was capped by daily cloud top/100DMA (0.7035) and sentiment changes ahead of RBA rate decision, due early Tuesday. Majority of economists tip for 0.25% rate cut to a record low at 1%, with rising expectations for more cuts this year, with Australian unemployment seen as key driver. The Aussie was initially pressured by weaker than expected China's Manufacturing data which offset positive impact from US/China agreement of not imposing new tariffs and continuation of trade talks. Overbought conditions also added to fresh pressure on Aussie dollar. The pair is on track for daily close in red, which is on track to for bearish outside day and generate initial reversal signal. Rate cut and dovish steer from the RBA would put Australian dollar under increased pressure which would generate stronger signal of reversal. Falling 55SMA (0.6975) marks initial support, with extension below 0.6956 (Fibo 38.2% of 0.6831/0.7034) needed to confirm reversal and spark stronger correction.
Res: 0.7000; 0.7035; 0.7048; 0.7062
Sup: 0.6975; 0.6956; 0.6976; 0.6936
USD/JPY Mid-Day Outlook
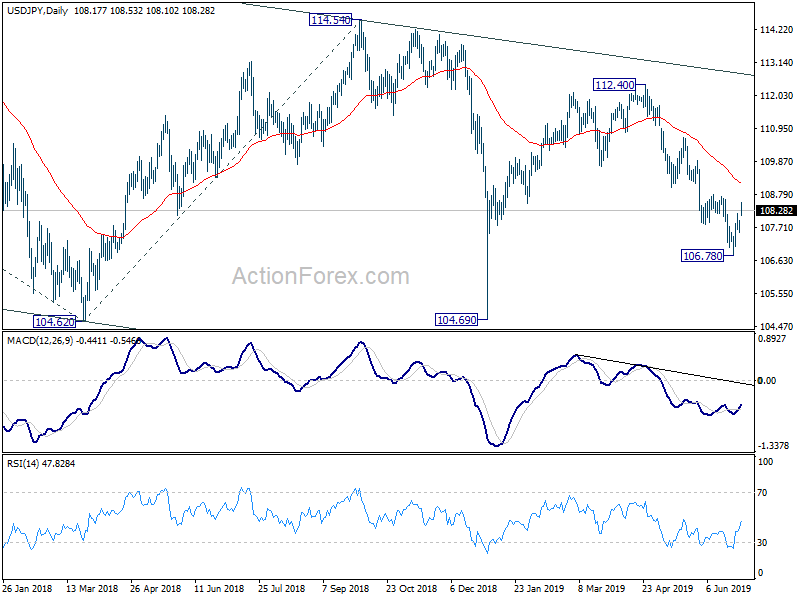
Daily Pivots: (S1) 107.68; (P) 107.81; (R1) 108.06; More...
Intraday bias in USD/JPY remains neutral with focus on 108.80 resistance. Considering bullish convergence condition in 4 hour MACD, firm break of 108.80 will confirm short term bottoming at 106.78. In this case, stronger rise should be seen back to 110.67 resistance. On the other hand, rejection by 108.80, followed by break of 107.56 will retain near term bearishness. Intraday bias will be turned back to the downside for 106.78 support instead.
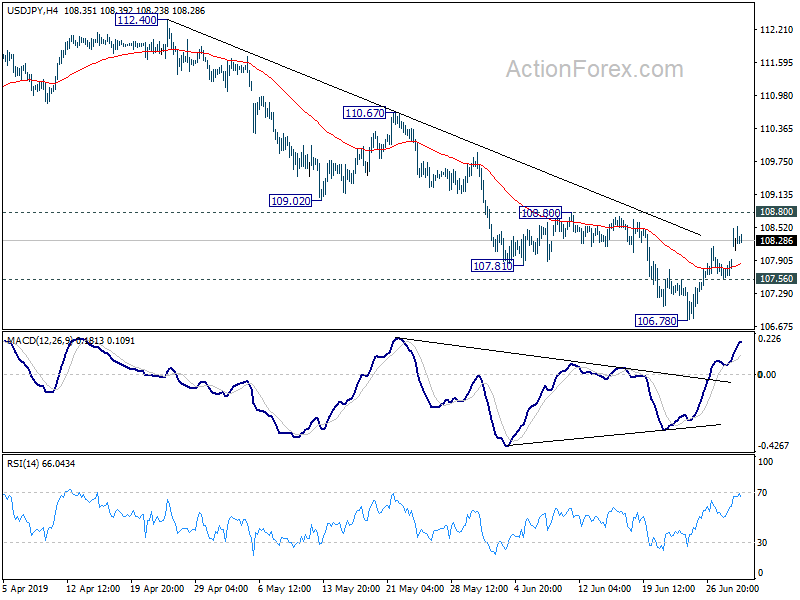
In the bigger picture, decline from 118.65 (Dec 2016) is still in progress, with the pair staying inside long term falling channel. Break of 104.62 will target 100% projection of 118.65 to 104.62 from 114.54 at 100.51. For now, we'd expect strong support above 98.97 (2016 low) to contain downside to bring rebound. In any case, break of 112.40 is needed to the first serious sign of medium term bullishness. Otherwise, further decline will remain in favor in case of rebound.
USD/CHF Mid-Day Outlook
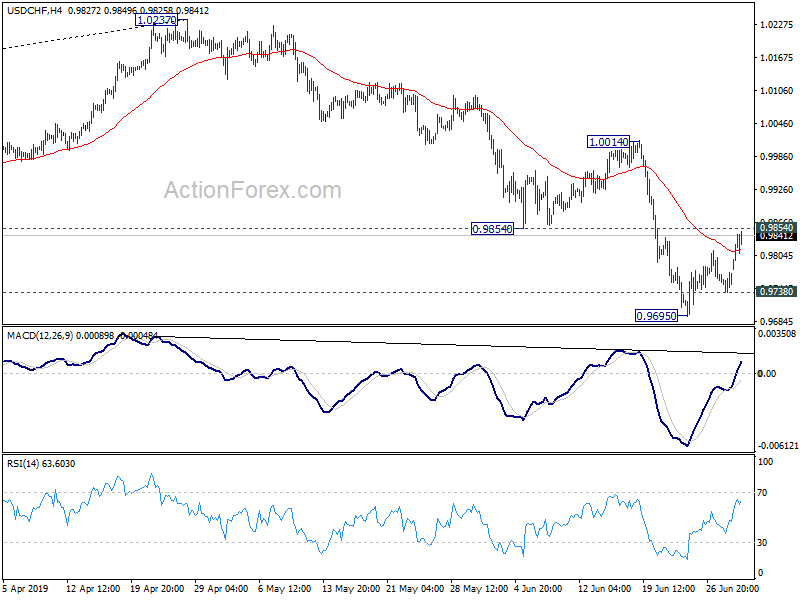
Daily Pivots: (S1) 0.9743; (P) 0.9759; (R1) 0.9779; More...
Intraday bias in USD/CHF remains neutral with focus on 0.9854 support turned resistance. On the upside, firm break of 0.9854 will confirm short term bottoming. Stronger rebound should be seen back to 1.0014 resistance next. However, rejection by 0.9854 will retain near term bearishness. Break of 0.9738 will turn bias back to the downside to retest 0.9695 low.
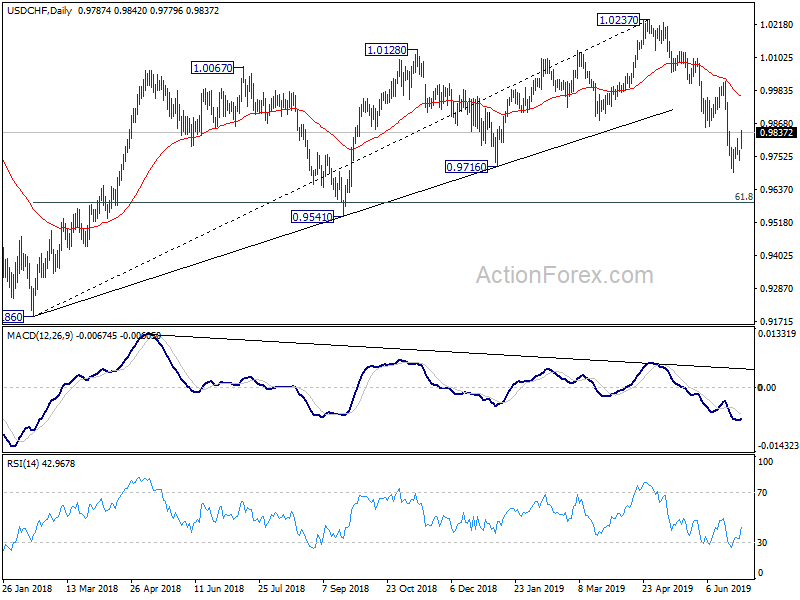
In the bigger picture, current development suggests that up trend from 0.9186 (2018 low) has completed at 1.0237 already. Deeper decline would be seen to 61.8% retracement of 0.9186 to 1.0237 at 0.9587 and below. For now, USD/CHF is seen as in long term range pattern between 0.9186 and 1.0342. Hence, we'd pay attention to bottoming signal below 0.9587.
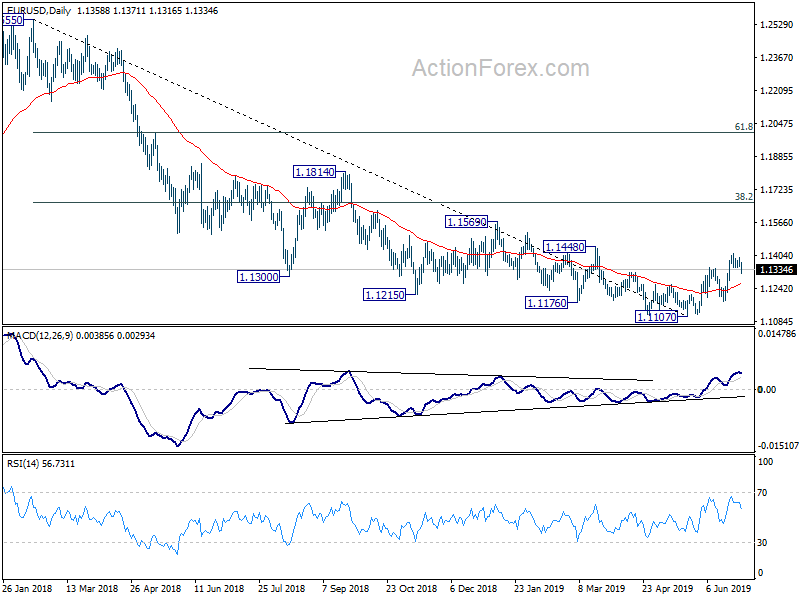
EUR/USD Mid-Day Outlook
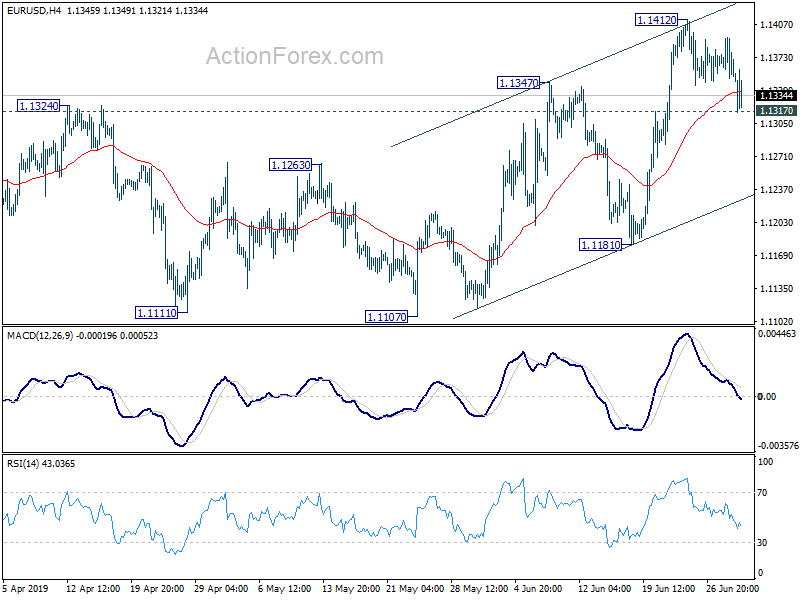
Daily Pivots: (S1) 1.1350; (P) 1.1371; (R1) 1.1392; More...
Intraday bias in EUR/USD remains neutral with focus on 1.1317 minor support. Firm break there will will be an early sign of completion of rise from 1.1107. Intraday bias will be turned back to the downside for 1.1181 support. Though, rebound from 1.1317 will retain near term bullishness. Break of 1.1412 will resume the rebound from 1.1107 low.
In the bigger picture, considering bullish convergence condition in daily and weekly MACD, a medium term bottom should be in place at 1.1107 after hitting 61.8% retracement of 1.0339 (2016 low) to 1.2555 (2018 high) at 1.1186. Further rise should be seen to 38.2% retracement of 1.2555 to 1.1107 at 1.1660. Reactions from there could indicate whether rebound from 1.1107 is a corrective rise or reversing medium term trend.
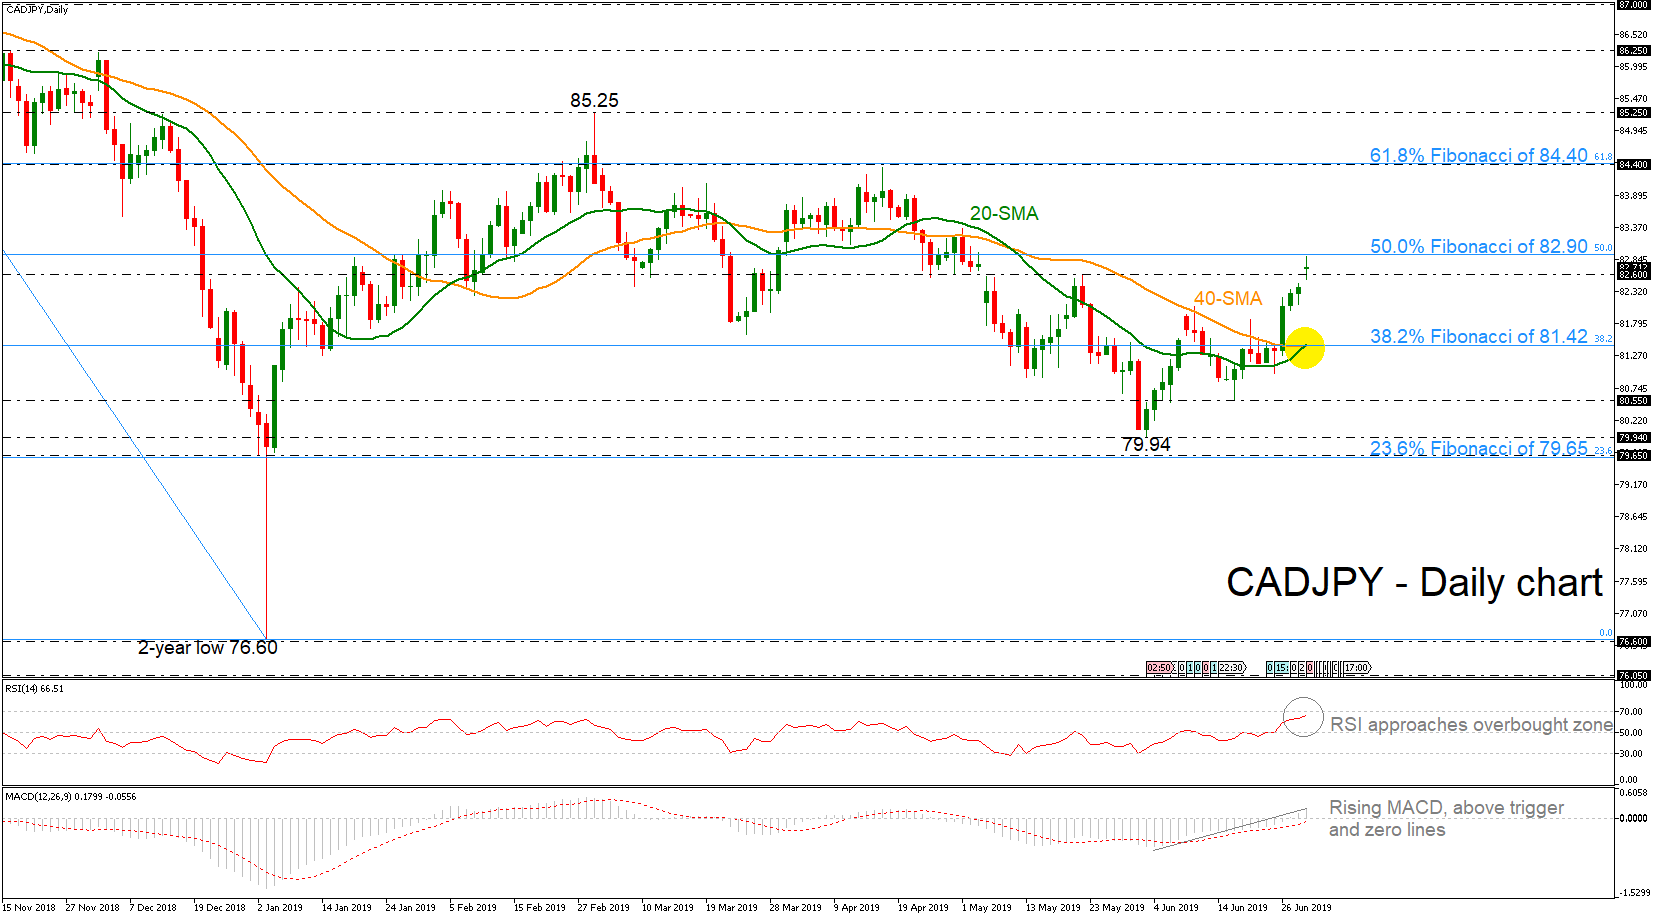
CADJPY Opens with Positive Gap; Bullish Cross within SMAs
CADJPY opened a gap up today, climbing above the 82.60 barrier and meeting the 50.0% Fibonacci retracement level of the downfall from 89.25 to 76.60 near 82.90.
Having a look at the momentum indicators, the RSI is sloping up near the overbought threshold and the MACD is strengthening its momentum above trigger and zero lines.
An advance above the 50.0% Fibonacci (82.90) could open the door for bullish actions until the 61.8% Fibonacci region, which overlaps with the 84.40 resistance level, registered on April 17.
A step lower could find support at the bullish cross within the 20- and 40-simple moving averages (SMAs) currently near the 38.2% Fibo of 81.42. More downside pressures could drive the pair towards the 80.55 barrier, taken from the latest lows.
In brief, a break above the 61.8% Fibo of 84.40 in the near term could change the bearish outlook to bullish, however, in case of a pullback below the 23.6% Fibonacci, this could confirm the long-term negative momentum.
ISM manufacturing dropped less than expected to 51.7, employment rose to 54.7
Dollar stays firm after ISM Manufacturing Index showed less than expected decline in June. Most importantly, principle concerns of US-China trade and US-Mexico trade are now eased, arguing that there might be a rebound in sentiments ahead.
ISM Manufacturing Index dropped to 51.7 in June, down slightly from 52.1 but beat expectation of 51.0. On the negative side, New Orders dropped -2.7 to 50.0. Prices dropped sharply by -5.3 to 47.9. However, Production rose 2.8 to 54.1. Employment also rose 0.8 to 54.7.
Timothy Fiore, Chair of the ISM Manufacturing Business Survey Committee: "Respondents expressed concern about U.S.-China trade turbulence, potential Mexico trade actions and the global economy. Overall, sentiment this month is evenly mixed."
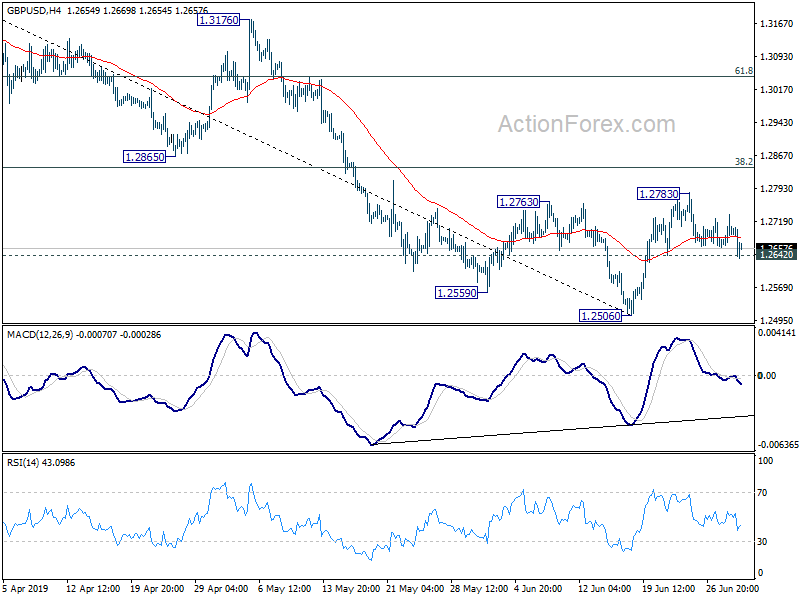
GBP/USD Mid-Day Outlook
Daily Pivots: (S1) 1.2662; (P) 1.2699; (R1) 1.2733; More....
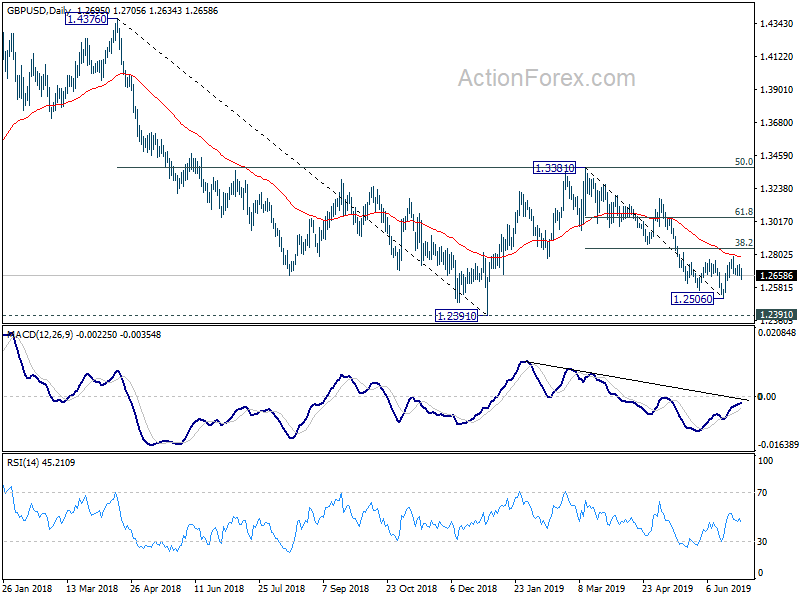
GBP/USD breached 1.2642 minor support but quickly recovered. Intraday bias stays neutral first. On the downside, firm break of 1.2642 will confirm completion of corrective rebound from 1.2506. Intraday bias will be turned back to the downside for retesting 1.2506 low. In case of another rise, upside should be limited by 38.2% retracement of 1.3381 to 1.2506 at 1.2840 to complete the corrective rise from 1.2506. However, sustained break of 1.2840 will bring stronger rise to 61.8% retracement at 1.3047 next.
In the bigger picture, down trend from 1.4376 (2018 high) is still in progress. Break of 1.2391 would target a test on 1.1946 long term bottom (2016 low). For now, we don't expect a firm break there yet. Hence, focus will be on bottoming signal as it approaches 1.1946. In any case, medium term outlook will stay bearish as long as 1.3381 resistance holds, in case of strong rebound.