Sample Category Title
Yuan Surges, Asian Assets Enjoy Time In The Sun On US-China Trade Truce
Asian equities and currencies are benefitting from the feel-good mood in the markets after US President Donald Trump and Chinese President Xi Jinping agreed to reignite trade talks. The Offshore Yuan is Asia’s best performer on Monday morning, climbing 0.6 percent against the US Dollar at the time of writing. Meanwhile, safe haven assets are losing ground on the ebbing risk aversion, with Gold falling below the psychological $1400 level, while the Japanese Yen weakened by some 0.3 percent to go back above the 108 level versus the Greenback.
The US-China truce announcement reduces the probability of more tariffs being imposed over the immediate term on shipments between the world’s two largest economies, giving markets the go-ahead to push further into risk-on territory for the time being.
Will US-China trade talks ultimately lead to a concrete deal?
The resumption of US-China trade talks doesn’t necessarily mean a trade deal is imminent. While an immediate deterioration in US-China relations has been averted, for now at least, the tariffs already imposed on global trade are still in effect and are expected to continue weighing on global growth.
This US-China truce may merely offer markets a temporary high, as the announcement by both governments appears to kick the can down the road. The path towards a lasting US-China trade deal remains unclear, in light of the complexities and sensitivities encountered during negotiations from earlier this year. The risk of talks falling apart, or another flare-up in tensions, could still rear its ugly head at some point in the future, blindsiding investors yet again.
The trepidatious investor will be tempted to ponder whether the same script will play out again over the coming months. In the meantime, risk assets are expected to enjoy their time in the sun, until the storm clouds of US-led tensions darken market sentiment once again.
Oil leaps at prospects of OPEC+ supply cuts extension
Brent and WTI crude are on the verge of gaining two percent respectively at the time of writing, after Russia and Saudi Arabia agreed to restrain Oil supplies through the end of 2019 at least. The pact between two of the biggest producers within OPEC+ should pave the way for an official stance by the alliance to extend the output cuts campaign, as the group’s meeting in Vienna begins today.
Oil prices should enjoy some immediate relief given expectations of the OPEC+ production cuts extension, along with the positive sentiment accompanying the revival of US-China trade talks. While an official extension should strengthen the floor under Oil prices, the lingering concerns over slowing global demand growth may cap Oil’s upside, unless existing US-China tariffs are lifted to brighten the global economic outlook.
Markets will also be assessing whether OPEC+ efforts to rebalance the global Oil markets may be enough, in light of record US crude output, along with the risk of another flare-up in the US-China trade conflict which could drag global growth lowe
RBA Expected To Cut Rates Again As Aussie Hits 2-Month High
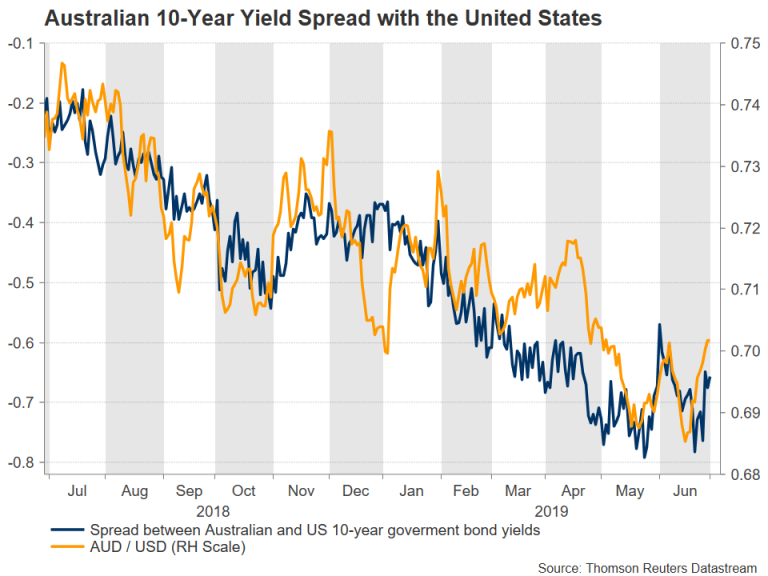
The Reserve Bank of Australia is widely anticipated to lower its cash rate for the second straight meeting when it announces its next policy decision at 0430 GMT on Tuesday. After cutting rates for the first time in nearly three years in June, the RBA is expected to ease policy again amid a cooling global economy and increased uncertainties stemming from trade and geopolitical tensions. But despite strong signals from policymakers that more rate cuts are likely, the Australian dollar has been on the up on narrowing yield differentials between Australian and US yields.
Lowe says another rate cut “not unrealistic”
RBA Governor, Philip Lowe, couldn’t be clearer in flagging another rate cut when he said “it is not unrealistic to expect a further reduction in the cash rate” in a speech on June 20. Lowe has become increasingly concerned about the slowdown in GDP and jobs growth, pointing to the spare capacity in the economy, especially in the labour market.
The RBA had been relying on the tightening labour market to spur wage growth, which in turn would lift inflation. But the annual CPI rate fell to 1.3% in the first quarter, well below the Bank’s 2-3% target band and Australia’s jobless rate has been ticking higher in recent months, meaning wage growth isn’t likely to accelerate anytime soon to provide the much-needed boost to consumer prices.
Market expectations for July rate cut running high
Market expectations of a rate cut at the July meeting soared after Lowe’s comments and investors have priced in about an 81% probability that the RBA will lower the cash rate to a new record low of 1.00% from 1.25%. Those odds may seem a little high given that the United States and China – Australia’s biggest trading partner – just agreed to resume trade talks and delay any additional tariffs for the time being.
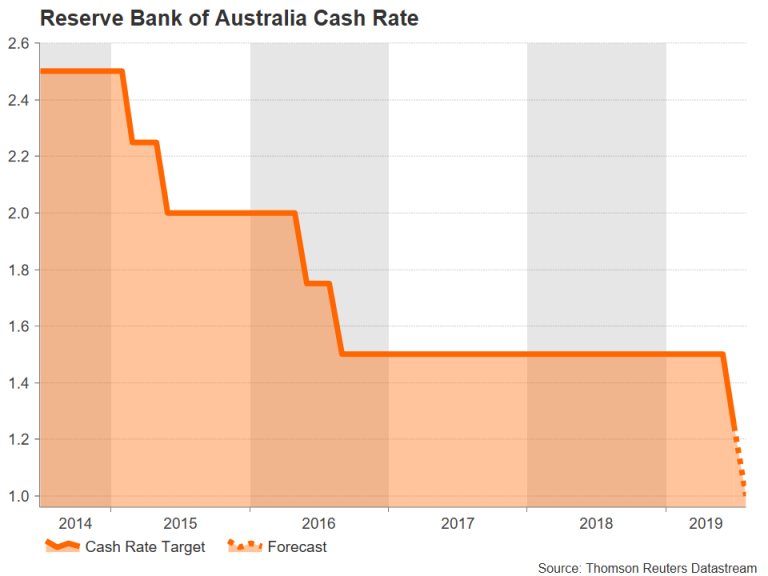
However, with no deadline set for a trade deal, an agreement could be months away and disappointing manufacturing PMI data out of China today reinforced the view that the year-long trade dispute has already started to hurt the country’s growth prospects. So unless the global growth outlook was to shift to a significantly more positive one, the Bank will struggle to meet its objectives of price stability and full employment.
Aussie turns bullish as greenback loses shine
But the gloomy outlook and dovish stance by the RBA haven’t been enough to place the aussie firmly on a downpath. The aussie had slid to a 5½-month low of $0.6829 in the days after the RBA’s June cut but following the US Federal Reserve’s dovish turn at its meeting on June 18-19, the Australian currency has been unable to overcome the bearish bets made against the US dollar.
Expectations that the Fed will cut rates more than the RBA lifted the aussie to a near 2-month high of $0.7036 earlier today. But while a bearish dollar means the aussie may not find much downside unless the Fed was to become less dovish, further positive momentum is likely to be limited.
Risk of RBA delaying rate cut until August
Immediate resistance for additional gains could come at the 38.2% Fibonacci retracement of the upleg from $0.6743 to $0.7295, which falls around $0.7084. A break above this level is possible if the Bank surprises with no rate reduction in July. Such an outcome shouldn’t be discounted as the RBA may decide to wait for its updated economic projections, to be published in its August Monetary Policy Statement, before making another cut. The $0.71 handle, near the 200-day moving average could be a target if the RBA signals it’s not in as much hurry to lower rates as investors have perceived
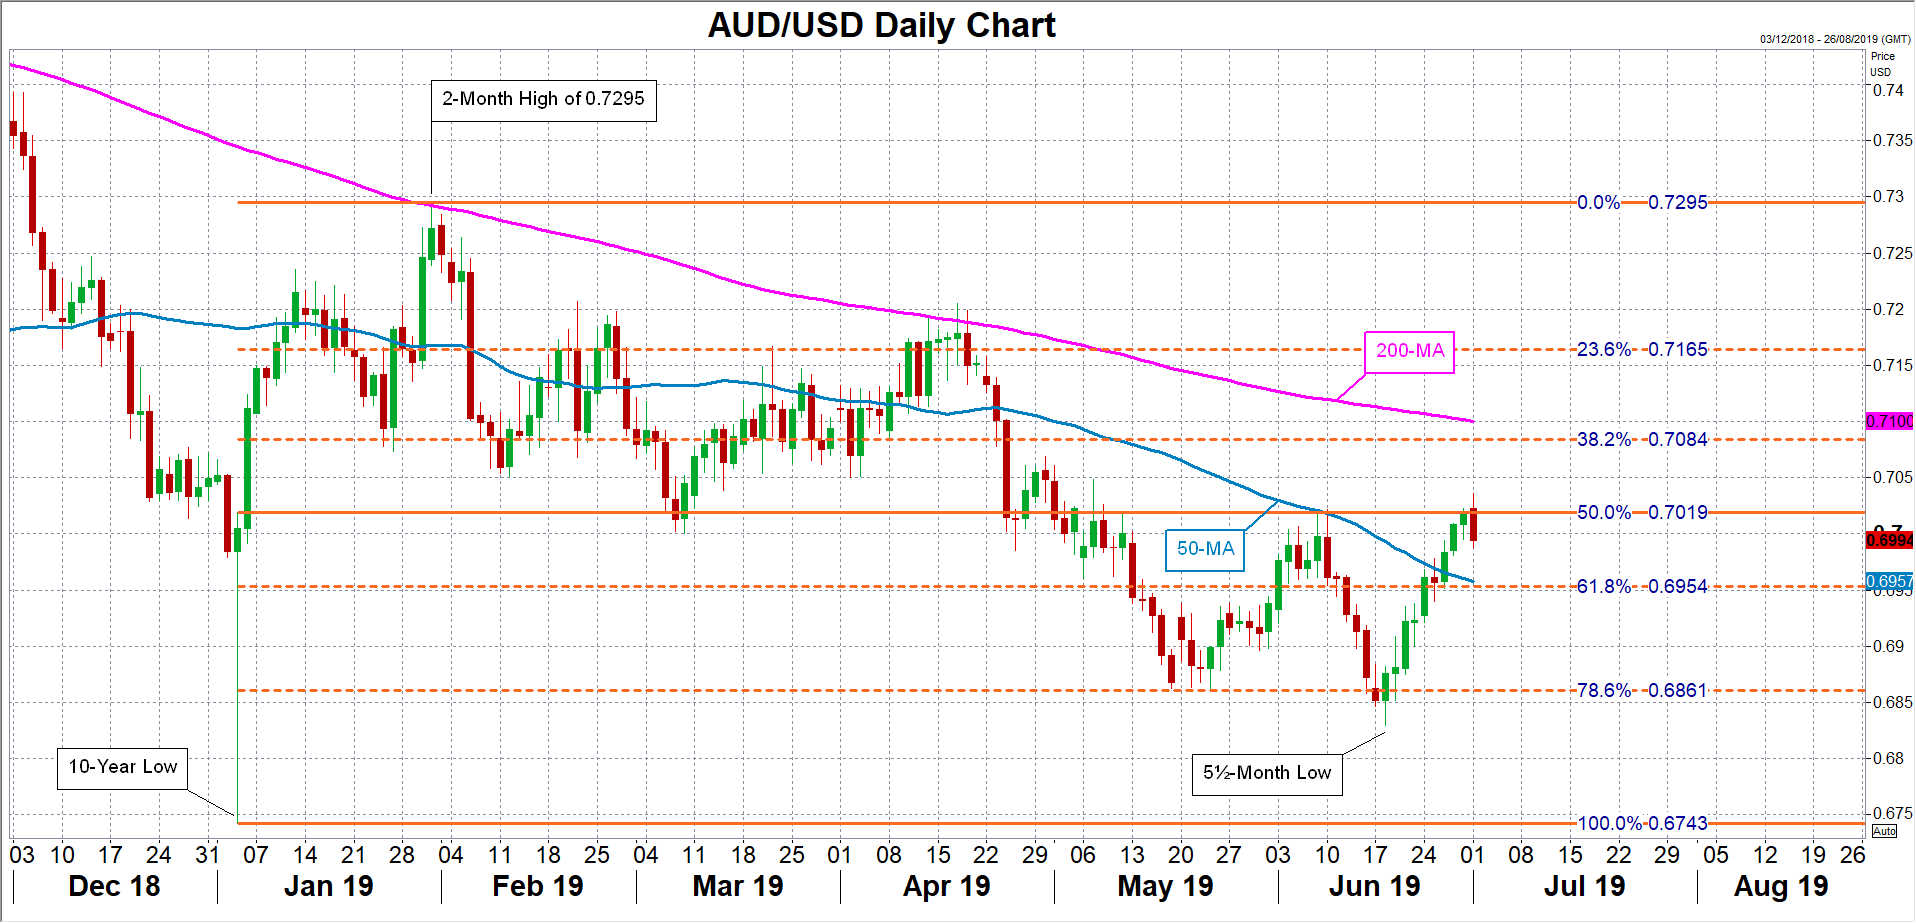
However, if the Bank proceeds with a 25-basis point rate cut on Tuesday and indicates further easing in the coming months, the aussie is likely to come under some short-term selling pressure and ease towards the 61.8% Fibonacci at $0.6954, just below the 50-day moving average.
Investors Are Focused On The US-China Trade Relations
On Friday, the US dollar declined slightly against a basket of major currencies in expectation of a meeting between the US President and the Chinese President at a summit in Japan. The US dollar index (#DX) closed in the negative zone (-0.08%). On Saturday, there was a meeting between Donald Trump and Xi Jinping, which they thought was pretty good. The US President made concessions to China and refused to further duties increase in order to reduce tensions with Beijing. China, in turn, agreed to make new purchases of US agricultural products and return to the negotiating table. We recommend following current information regarding the US-China trade relations.
On Friday, data on the GDP of the UK and Canada were also published. Thus, the UK GDP (q/q) grew by 0.5%, as experts expected. The UK GDP (y/y) grew by 1.8%, which matched the forecasts. Canada GDP (m/m) increased by 0.3%, which turned out to be better than the forecasted growth by 0.1%. This week, economic reports from the United States will be in the focus of attention.
Today, during the Asian trading session, ambiguous data from Japan have been published. Thus, Tankan large manufacturers index (Q2) counted to 7 and was worse than the forecasted value of 9. Meanwhile, Tankan large non-manufacturers index (Q2) counted to 23 instead of the expected value of 20. Also, Chinese Caixin manufacturing PMI was published, which counted to 49.4 and was worse than the expected value of 50.0.
The "black gold" prices have increased by more than 2% in expectation of the OPEC+ deal extension. At the moment, futures for the WTI crude oil are testing the mark of $60.00 per barrel.
Market Indicators
On Friday, the bullish sentiment was observed in the US stock market: #SPY (+0.51%), #DIA (+0.26%), #QQQ (+0.13%).
The 10-year US government bonds yield has been growing. Currently, the indicator is at the level of 2.01-2.02%.
The news feed on 2019.07.01:
- German manufacturing PMI at 10:55 (GMT+3:00);
- Report on the labor market in Germany at 10:55 (GMT+3:00);
- The index of economic activity in the UK manufacturing sector at 11:30 (GMT+3:00);
- ISM manufacturing PMI at 17:00 (GMT+3:00).
USD In Demand Amid Constructive G20 Meeting
G20 meeting in Osaka prompted optimism all over the place. Major Asian stock markets closed above 2% across the board while European open is set for a rise as well. The greenback, as well as CNY are also gaining traction amid Trump – Xi meeting while the loonie is supported by surging oil prices. The recent up-move in USD is therefore suggesting that expectations of Fed rate cuts are not that certain anymore according to certain investors, as the key reason remained dragging trade issues with China. There is however good reasons to consider that an abrupt change in Fed forward guidance is less likely as issues like inflation, Trump political pressure on Fed or pending trade discords with trade partners stay.
US and China final call at G20 came as expected, as both presidents confirmed that trade discussions are about to resume this week, US tariffs on USD 300 billion worth of Chinese goods is suspended while sanctions on tech giant Huawei, including the authorization to buy US products are removed. Yet the situation is not much different from December 2018 G20 meeting in Argentina when both trading partners confirmed that trade talks would resume, confirming that the recent euphoria should be short-lived. Although relations between US and EU looked positive during the summit, there are good reasons to think that Trump's battle against trade deficit should finally knock on the EU's door after a pause in February 2019 when US President Donald Trump promised European Commission President Jean-Claude Juncker not to impose additional tariffs on EU industries, including the automotive industry. Disruptive consequences would have an impact not only on EU producers, but also on the United States, as supply chains remain strongly linked to each other. Furthermore, the release of June headline and core PCE deflator data at 1.50% (prior: 1.50%) and 1.60% (prior: 1.60%) respectively, largely below Fed’s 2% target, tend to favor that a Fed U-turn is less likely. The release of labor data on Friday will therefore play an important role in the Fed’s economic assessment.
Currently trading at 1.1325, EUR/USD is heading along 1.1315 short-term.
USD/TRY Outlook: Improved Sentiment Pushes Lira Higher Through Important Barriers
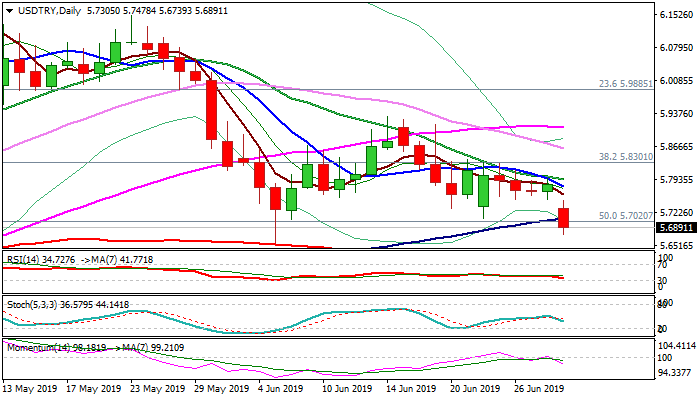
Turkish lira advanced to nearly one-month high against US dollar, following Monday’s opening with five-figure gap and extension through 100DMA (5.7090).
Fresh optimism on comments from President Erdogan that there will be no sanctions on Turkey and plans of CBRT to cut FX reserve requirement upper limit, additionally support lira.
USDTRY eventually made clear break below thick daily cloud and also took out 100DMA support, as improved lira’s sentiment turns focus towards 5 June low at 5.6575, violation of which would signal extension of downtrend from 6.2445 (2019 high) and expose key supports at 5.5981 (200DMA) and 5.5740 (Fibo 61.8% of 2019 rally from 5.1595 to 6.2445).
Rising bearish momentum on daily chart and MA’s turning to full bearish configuration, support scenario.
Massive daily cloud produces additional pressure, with broken cloud base (5.7736) marking solid barrier which is expected to keep the upside protected.
Res: 5.7090, 5.7611, 5.7736, 5.7939
Sup: 5.6731, 5.6575, 5.5981, 5.5740
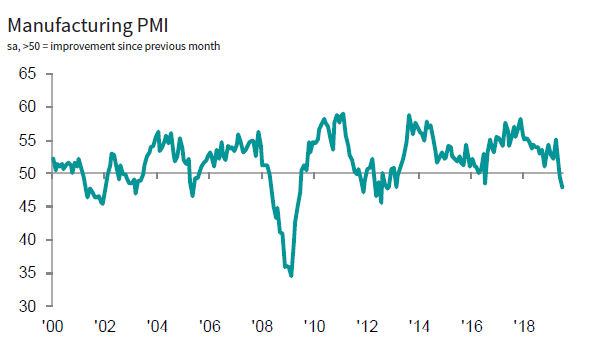
UK PMI manufacturing dropped to 48.0, lowest since Feb 2013
UK PMI Manufacturing dropped to 48.0 in June, down from 49.4 and missed expectation of 49.5. That's also the lowest level since February 2013. Looking at some details, manufacturing production contracted at fastest pace since October 2012. New export orders dropped for the third straight month. Business optimism dropped to third lowest level on record. Employment fell for the third straight month.
Rob Dobson, Director at IHS Markit, which compiles the survey:
"The downturn in UK manufacturing deepened during June, as the impact of firms unwinding stockpiles built before the original Brexit date continued to reverberate through the sector and exacerbate weak demand. This led to solid decreases in both production and new orders, which sank the headline PMI to its lowest in almost six-and-a-half years.
"Demand from the domestic market weakened, while the additional constraint of slower global economic growth meant new export business fell at one of the fastest rates since late-2014.
"Although the consumer goods sector was able to eke out further output growth, the rate of expansion slowed sharply. Solid contractions at intermediate and investment goods producers also suggested that businesses were cutting back on both day-to-day and capital spending in increasing numbers.
"The stranglehold of sustained Brexit-related uncertainty and disruption also weighed heavily on business confidence and employment, as optimism ebbed to one of its lowest levels in the survey history and staff headcounts were reduced for the third straight month.
"There will need to be a substantial improvement in economic conditions at home and overseas, alongside reductions in both Brexit and domestic political uncertainties, if manufacturing is to see a sustained revival in the coming quarters."
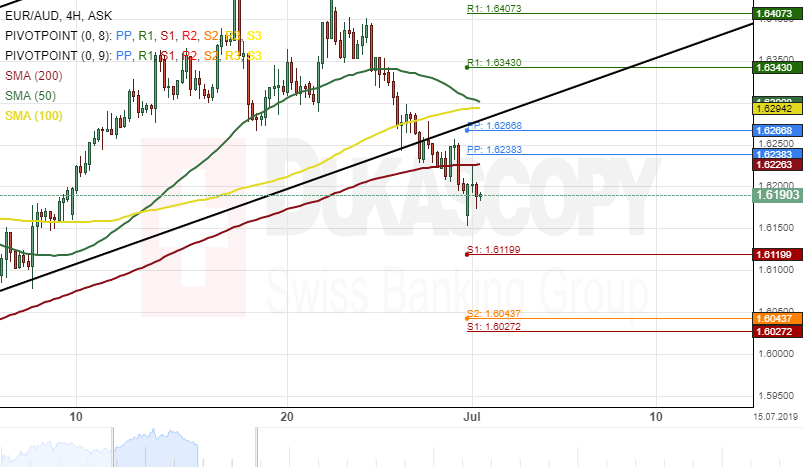
EUR/AUD 4H Chart: Decline Likely To Continue
The single European currency has depreciated about 1.72% in value against the Australian Dollar since June 17. A breakout occurred through the lower boundary of an ascending channel pattern at 1.6266 on Friday.
Given that a breakout had occurred, it is likely that the EUR/AUD currency pair will continue to lose strength during the following trading sessions. Bears could drag the exchange rate towards a swing low at 1.6043.
A potential upside reversal from the swing low as mentioned above could follow in the short term.
Meanwhile, technical indicators flash buy signals on the weekly time-frame chart.
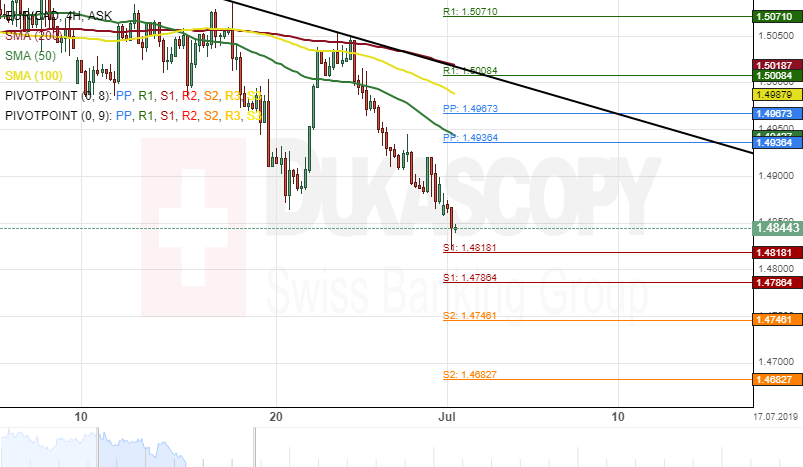
EUR/CAD 4H Chart: Potential Upside Reversal Likely
The Eurozone single currency has edged lower by 1.59% in value against the Canadian Dollar since June 17. The currency pair was pressured south by the 50-, 100 and 200-hour SMAs.
Most likely, the exchange rate might continue its southern movement within this week's trading sessions. Bearish traders could aim for a support level formed by the monthly S2 at 1.4784.
On the other hand, the currency exchange rate could make a U-turn from the current price level at 1.4841 and aim for the upper border of a downtrend line at 1.5021 during the following trading sessions.
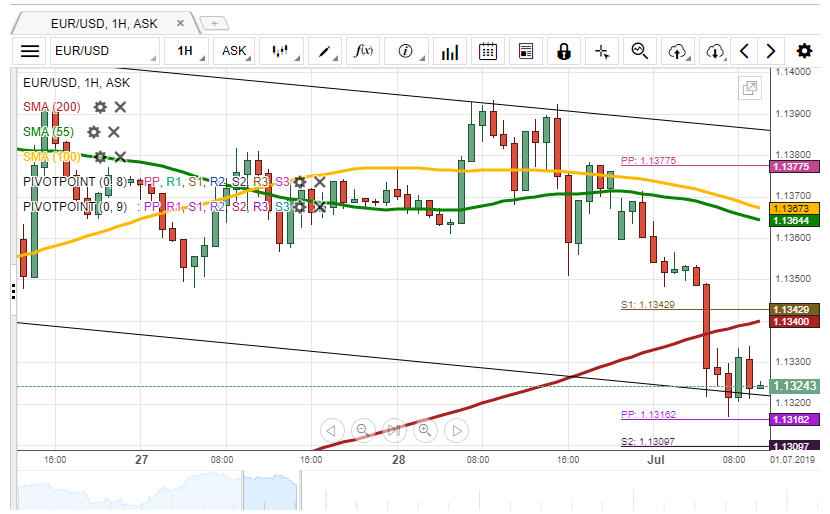
EUR/USD Revealed Short-Term Descending Channel
On Friday, the EUR/USD currency pair dropped to the weekly S1 at the 1.1343 mark. During today's morning, the pair was testing the lower boundary of the short-term descending channel at 1.1320.
From a theoretical perspective, it is expected, that reversal north could occur within the following trading hours. Note, that the exchange rate would have to surpass the given S1, as well the 200-hour SMA at 1.1339.
From a technical point of view, it is unlikely, that a breakout south could occur in the nearest future, as the rate is supported by the monthly PP and the weekly S2, located at 1.1316 and 1.1310 respectively
GBP/USD Likely To Trade Down
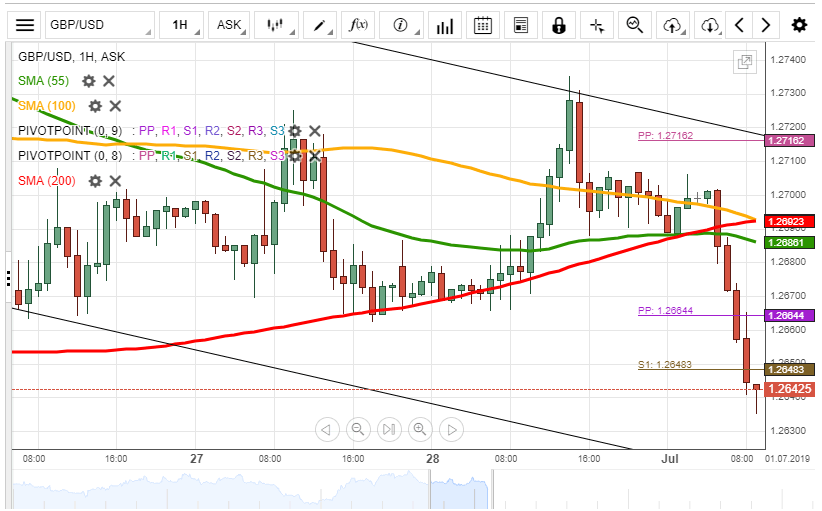
During the previous trading session, the GBP/USD exchange rate reversed south from the upper boundary of the short-term descending channel at 1.2730. During Monday's morning, the rate was testing the support formed by the weekly PP at 1.2648.
If the given support level holds, it is likely, that a reversal north could occur in the nearest future. However, it is unlikely, that the British Pound could exceed the 1.2700 level due to the resistance formed by the 55-, 100– and 200-hour SMAs.
Otherwise, it is expected, that the currency pair could maintain its decline. A possible downside target is the lower channel line located in the 1.2600/1.2620 range