

Sample Category Title
Euro Weakens As PMI Revisions Miss Estimates
Euro-zone PMI revised lower
The Markit manufacturing PMI readings for June both missed economists’ projections, and this helped push EUR/USD to the lowest in 10 days in early trading in the European session. Germany’s manufacturing PMI was actually revised higher from the flash reading, from 44.3 to 45.0, bit missed analysts forecasts of a jump to 45.4. The European reading was not so buoyant, revised down to 47.6 from 47.7, and also below economists’ forecasts.
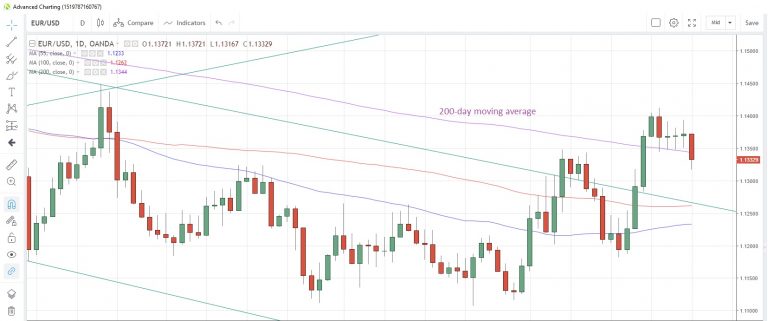
EUR/USD slumped to 1.1316, the lowest since June 21, while EUR/JPY gave back Asia’s gains to a near-six week high of 123.36 to sit currently unchanged at 123.70. EUR/USD has again breached support at the 200-day moving average of 1.1344 after spending the last five days above it, on a closing basis.
EUR/USD Daily Chart
China PMIs also disappoint
June manufacturing PMIs out of China were also disappointing. While the official reading, which was released on Sunday, was unchanged from May’s 49.4, expectations were a little bit more optimistic of a rebound. In addition, today’s release of the Caixin equivalent saw the index drop to 49.4 from 50.2, with expectations of a slide to just 50.0. The hefty miss saw the index in contraction territory for the first time since February and hitting the lowest level since January.
But trade truce trumps PMIs
However, the announcement at the weekend of a truce in the US-China tariff wars, and a return to the negotiating table, helped risk appetite overcome any weakness from the PMIs.
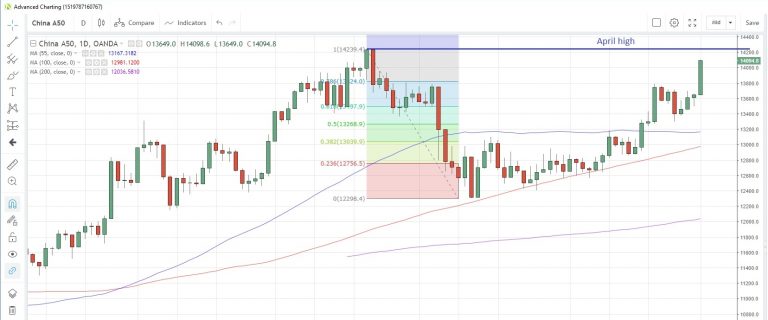
Equity indices have outperformed currencies, with US indices up between 0.76% and 1.30%, with the NAS100 index outperforming. The Japan index is now up 1.71% but China shares exploded higher after the truce announcement, rising on the day to close 3.27% higher. The index looks poised to test the April high of 14,240.
China50 Daily Chart
US PMIs expected to conform to trend
The major event on the calendar for the rest of the day will likely be the release of the US ISM manufacturing PMI for June. The Markit flash PMI for June disappointed with a bigger-than-expected drop to 50.1 and the ISM reading is expected to show the same trend, with the slide to 51.0 anticipated from 52.1 in May. This would echo the softer trend seen in Europe.
ECB Rehn: Stands ready to adjust all instruments to lift inflation
ECB Governing Council member Olli Rehn, a potential successor to chairman Mario Draghi, said the central bank stands ready to use all its tools to lift inflation. Rehn said in a conference in Helsinki, "the Governing Council stands ready to adjust all of its instruments, as appropriate, so that inflation continues to converge towards our inflation aim in a sustained manner."
However, he also noted that "the ECB – much like other central banks – operates in a new environment where long-run trends, such as population aging, lower long-term interest rates and climate change have become key policy issues." Those make case for a policy review that requires a deeper assessment.
Fed Clarida: Baseline outlook positive, with growth at or slightly above trend
Fed Vice Chair Richard Clarida maintained his view that the US economy is "in a good place in terms of lower unemployment rate and the inflation rate a little bit below our 2% objective". Also, the baseline outlook "continues to be a positive one". That is, the committee "sees growth at or slightly above trend, sees the unemployment rate remaining low and the inflation rate rising gradually toward 2%."
Though, he also noted that with the Beige Book survey, "we are hearing increasing references and mentions of uncertainty about policy, and particularly uncertainty about the outlook for trade negotiations, having a potential impact on business investments".
Clarida also noted uncertainties from trade, global growth and business investments. Also, his fellow central banks saw stronger case for policy easing relative to just two months again. He reiterated Fed's stance that "we will certainly act as appropriate to put in place policies that sustain the economic expansion, and the strong labor market and price stability."
Forex Technical Analysis: EUR/USD, USD/JPY, GBP/USD
EUR/USD
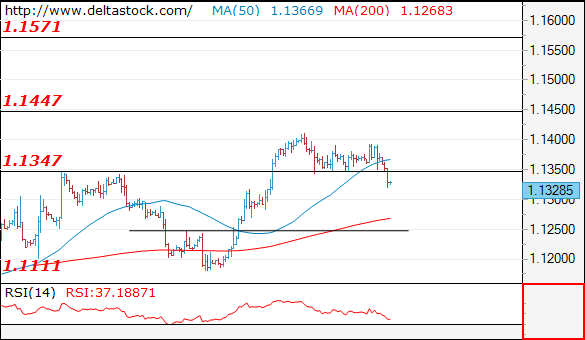
Current level - 1.1328
Finally, the pair broke through 1.1350 support and the intraday bias is bearish, but that slide should be considered the final leg of the consolidation pattern after 1.1410, thus preceding an advance towards 1.1450 and 1.1570 later on.
| Resistance | Support | ||
| intraday | intraweek | intraday | intraweek |
| 1.1350 | 1.1570 | 1.1280 | 1.1110 |
| 1.1410 | 1.1820 | 1.1250 | 1.1010 |
USD/JPY
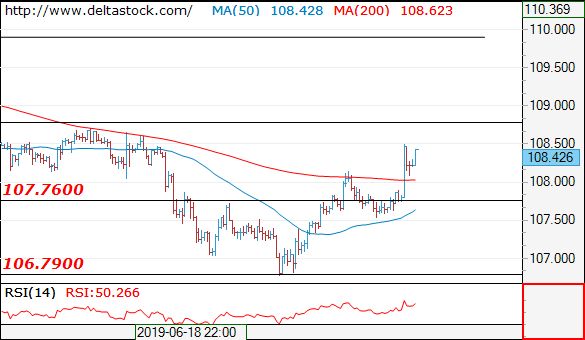
Current level - 108.42
The bias is bullish, for a break through 108.80, en route to 109.80 zone. Initial minor support lies at 108.10, followed by the crucial 107.50.
| Resistance | Support | ||
| intraday | intraweek | intraday | intraweek |
| 108.80 | 109.80 | 108.10 | 106.70 |
| 109.80 | 112.40 | 107.50 | 104.50 |
GBP/USD
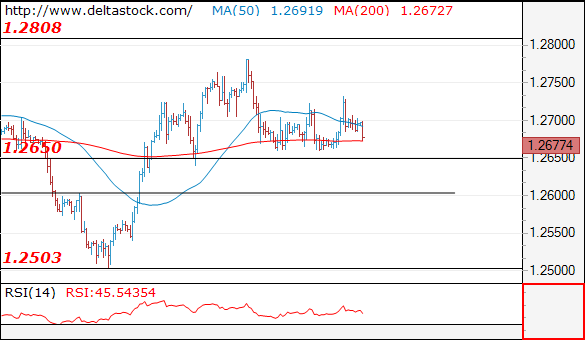
Current level - 1.2677
The intraday bias is bearish, for a dip through 1.2650, towards 1.2600 static area. The latter should provide a reliable base for another upswing on the senior frames, towards 1.2810.
| Resistance | Support | ||
| intraday | intraweek | intraday | intraweek |
| 1.2720 | 1.2890 | 1.2650 | 1.2503 |
| 1.2810 | 1.3170 | 1.2600 | 1.2420 |
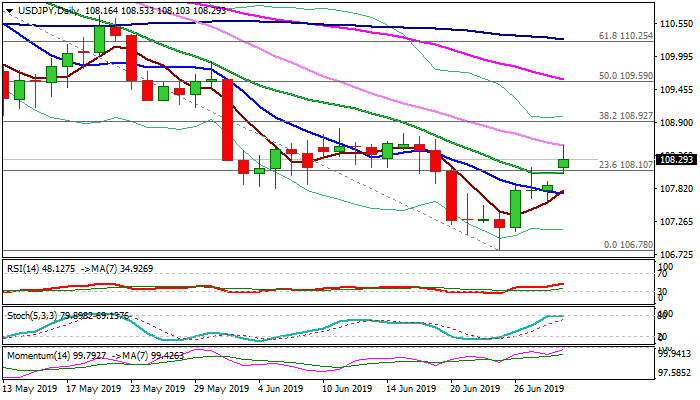
USD/JPY Outlook: Fresh Bulls Lack Momentum For Break Through Pivotal Barriers
The pair opened with gap-higher on Monday, boosted by US/China deal and developments in talks with North Korea that boosted risk appetite.
Fresh bulls hit two-week high at 108.53, where falling 30SMA capped advance for now.
Improved sentiment underpins, however, risk of stall exists, as overall picture is bearish and lacks momentum, daily 10/20/30DMA’s are mixed, while stochastic is entering overbought zone.
Bulls require sustained break above 30 DMA and pivotal barriers at 108.80/92 (11 June lower top / Fibo 38.2% of 112.40/106.78) to generate reversal signal, with bullish bias expected above initial support at 108.07 (20DMA).
Break here would soften near-term structure, while extension and return below 10DMA (107.73) would generate bearish signal and shift near-term focus lower.
Res: 108.53, 108.80, 108.92, 109.60
Sup: 108.07, 107.73, 107.56, 107.39
US And China Agree To Ceasefire, Stocks & Dollar Cheer
- Trade ceasefire propels stocks and dollar higher, sends safe havens lower
- Oil rejoices on trade truce and OPEC agreement
- ISM manufacturing PMI today may be crucial for Fed expectations
Risk sentiment lifted as Trump & Xi decide to restart trade talks
The pivotal meeting between the American and Chinese leaders concluded with a market-friendly outcome, with the two sides agreeing to restart trade negotiations and hold off on imposing any new tariffs ‘for the time being’. What stood out was that the US also agreed to roll back some of its restrictions on tech giant Huawei, in what seems to have been the ‘price’ for getting Beijing back to the negotiating table.
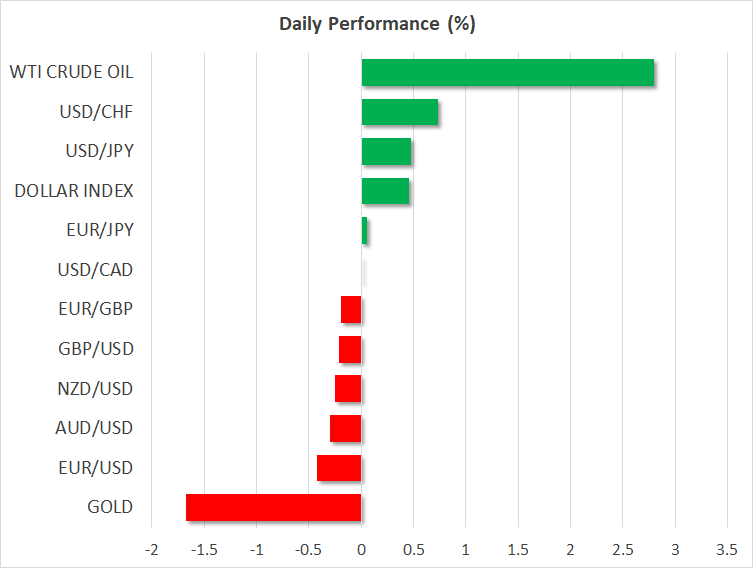
The result was a classic risk-on reaction in markets, with futures tracking the major US stock indices pointing to a ~1.0% higher open today, something that would bring the likes of the S&P 500 and the Dow Jones to fresh all-time highs. Beyond equities, the other major winner has been the US dollar, as the trade truce was seen as lowering the odds for the Fed to cut rates aggressively in the coming months. On the opposite side of the ‘risk spectrum’, safe-haven assets like the Japanese yen and gold are on the retreat.
Overall, while the resumption of negotiations is clearly a positive step, the big picture hasn’t changed. The two nations remain far apart on key issues, including intellectual property protection and an enforcement mechanism, implying that the road to any deal will probably be full of twists. Hence, while this ceasefire may keep risk sentiment and the dollar supported for now, but it’s unlikely to be enough to ‘turn the tide’ and reverse the bigger trends that have developed in recent weeks – for instance, that of a stronger yen.
Oil celebrates trade truce, looks to OPEC summit
Crude oil opened higher on Monday, with WTI crossing above the crucial $60/barrel handle as investors reassessed the demand outlook following the optimistic trade signals over the weekend. That wasn’t all though, as the latest headlines suggest that Russia and Saudi Arabia agreed to extend the OPEC production cuts, painting a brighter supply picture as well.
Russian President Putin said he agreed with the Saudi Crown Prince, adding that the length of the extension hasn’t been decided yet, but will probably be six or nine months. Attention now turns to the OPEC meeting that will commence today in Vienna. A nine-month extension of the current output cuts is likely needed to push oil prices higher from here.
Manufacturing PMIs coming up
As for the economic data today, the most important releases left on the calendar will come from the UK and the US.
In Britain, the manufacturing PMI for June is due. As usual though, the pound is likely to respond more to politics than economics. In that sense, the focus remains on the Tory leadership race, and any Brexit-related comments from either of the two remaining candidates.
In the US, the ISM manufacturing survey will be among the final major pieces of data ahead of the Fed’s July meeting, and could therefore be crucial for the dollar. Traders have scaled back some of the Fed easing bets following the trade truce, with the implied probability for an aggressive 50bps cut this month having declined to ~15%. A solid ISM print could add more credence to the narrative that the Fed won’t cut so aggressively, and thereby help extend the current recovery in the dollar.
The Analytical Overview Of The Main Currency Pairs
The EUR/USD currency pair
Technical indicators of the currency pair:
Prev Open: 1.13687
Open: 1.13643
% chg. over the last day: -0.09
Day's range: 1.13217 - 1.13712
52 wk range: 1.1111 - 1.2009
The EUR/USD went down and updated the local lows. The key range is 1.13150-1.13550. On Saturday, the leaders of the United States and China were able to negotiate a truce and plan to continue trade negotiations. Keep track of current information on this issue. The key event this week will be the US Labor Market Report for June, which will be published on Friday July 5th. The quotes have the potential for further correction after a protracted rally. We recommend to open positions from key levels.
The Economic News Feed for 01.07.2019:
The business activity index in the manufacturing sector in Germany (EU) – 10:55 (GMT+3:00);
Reports on the German labor market (EU) – 10:55 (GMT+3:00);
The business activity index in the US manufacturing sector from ISM - (EU) – 17:00 (GMT+3:00);
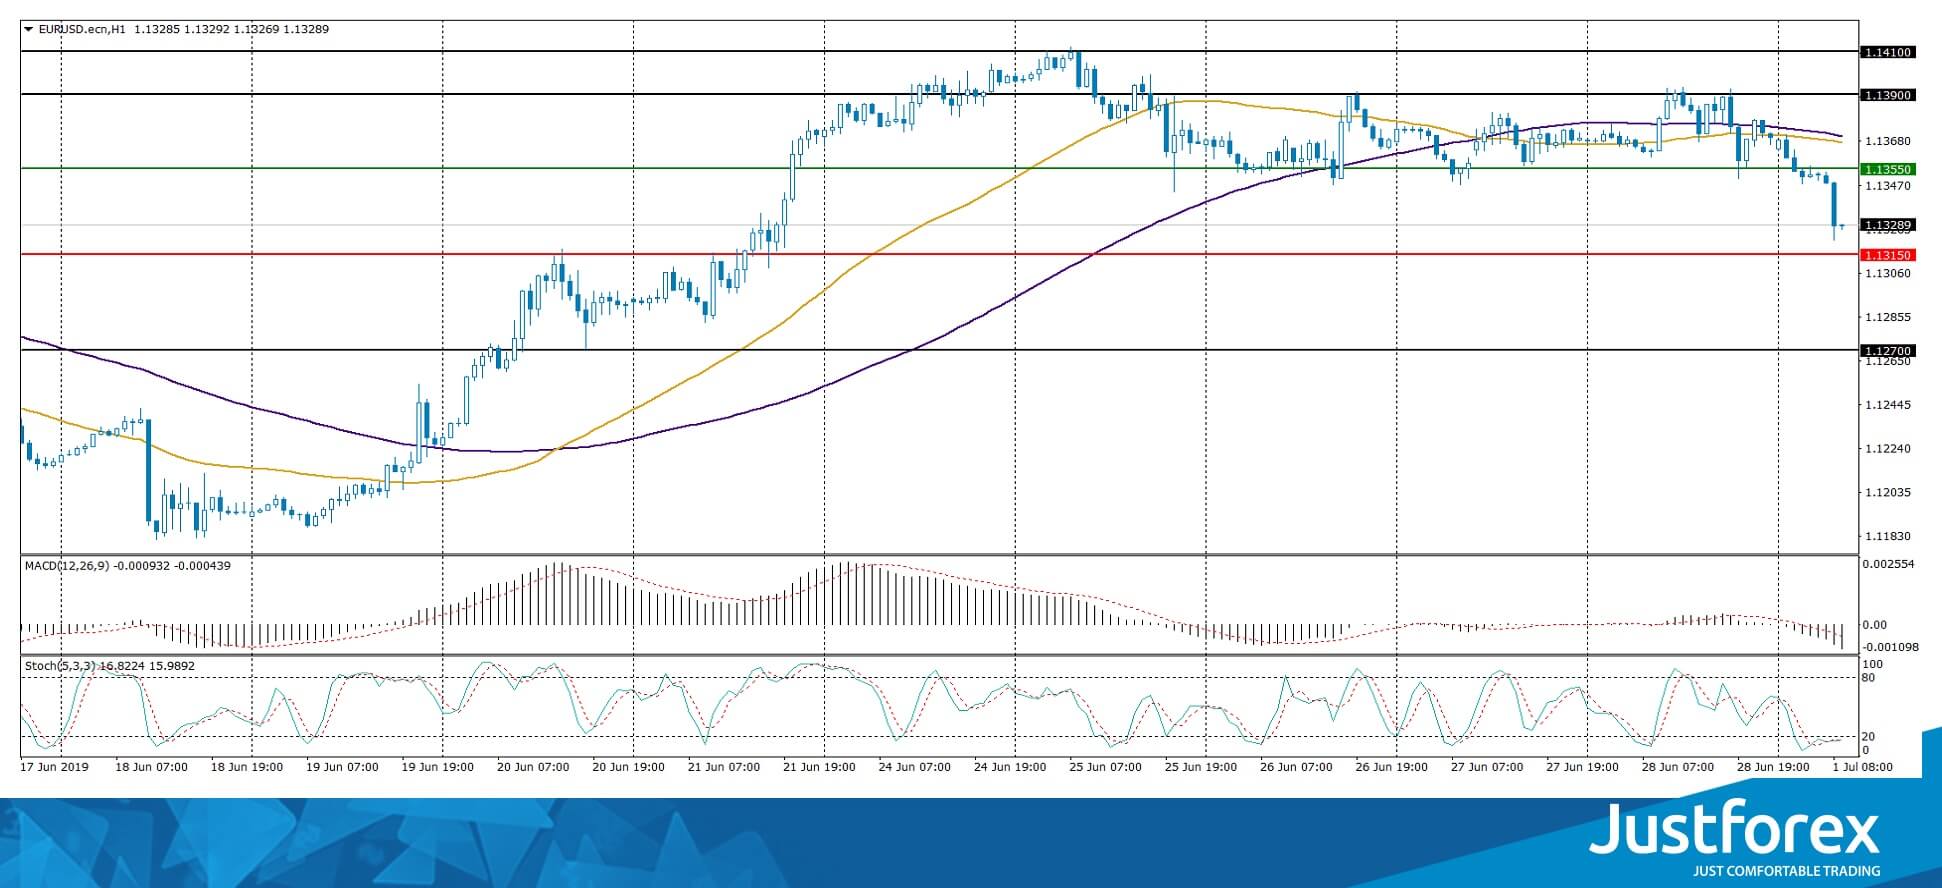
The indicators indicate the power of sellers: the price has fixed below 50 MA and 100 MA.
MACD.
The MACD histogram is in the negative zone and below the signal line, which gives a strong signal to sell EUR/USD.
The Stochastic Oscillator is in the oversold zone, the %K line crossed the %D line. There are no signals at the moment.
Support levels: 1.13150, 1.12700
Resistance levels: 1.13550, 1.13900, 1.14100
If the price consolidates below 1.13150, a further correction of the EUR/USD currency pair is expected towards 1.12800-1.12600.
Alternatively, the quotes can grow towards 1.13800-1.14000.
The GBP/USD currency pair
Technical indicators of the currency pair:
Prev Open: 1.26613
Open: 1.26940
% chg. over the last day: +0.15
Day's range: 1.26779 - 1.27056
52 wk range: 1.2438 - 1.3631
GBP/USD continues to trade in a flat. There is no defined trend. The key support and resistance levels continue to be 1.26650 and 1.27150. The financial market participants expect additional drivers. Today, the investors will evaluate important economic releases from the UK and the USA. We recommend to open positions from key levels.
At 11:30 (GMT + 3: 00) the business activity index in the UK manufacturing sector will be published.
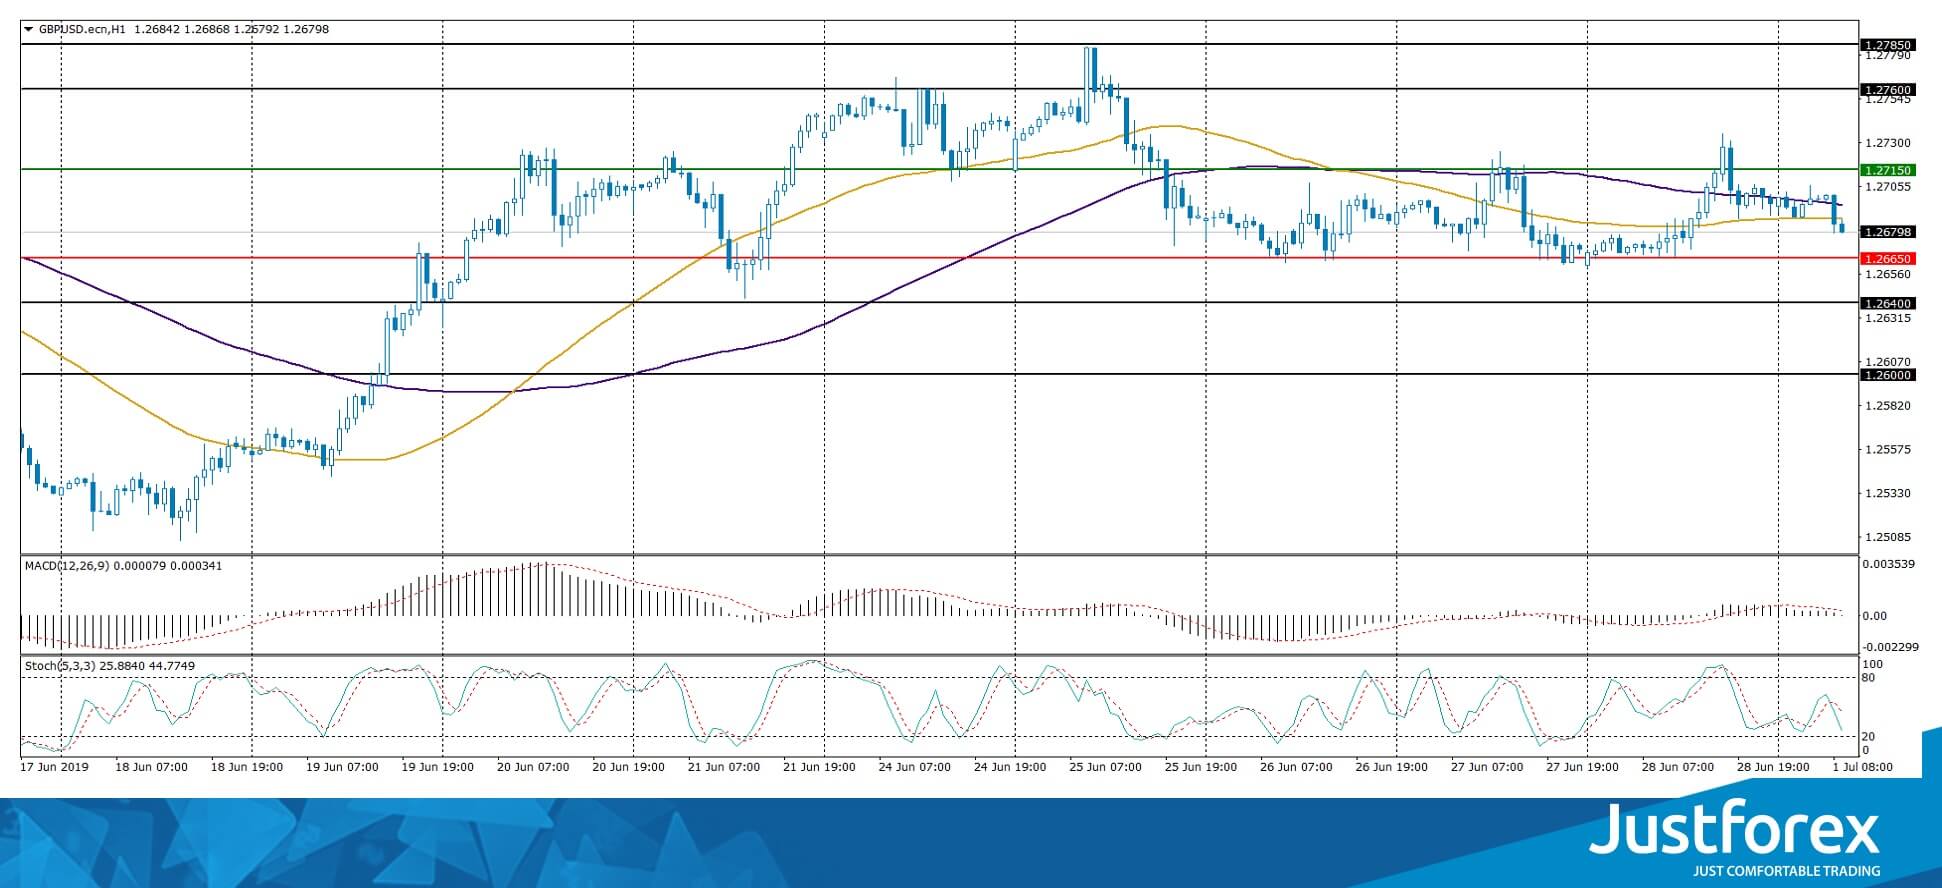
The indicators do not give accurate signals: the price crossed 50 MA and 100 MA.
The MACD histogram is near the 0 mark.
The Stochastic Oscillator is in the neutral zone, the %K line is below the %D line, indicating a bearish mood.
Trading recommendations
Support levels: 1.26650, 1.26400, 1.26000
Resistance levels: 1.27150, 1.27600, 1.27850
If the price consolidates below 1.26650, the quotes will rise towards 1.26300-1.26000.
Alternatively, the quotes could grow towards 1.27500-1.27700.
The USD/CAD currency pair
Technical indicators of the currency pair:
Prev Open: 1.30942
Open: 1.30843
% chg. over the last day: -0.02
Day's range: 1.30814 - 1.31080
52 wk range: 1.2727 - 1.3664
The USD/CAD has stabilized after a significant drop in the past two weeks. At the moment, CAD is consolidating near the round 1.31000. The key support and resistance levels are: 1.30600 and 1.31100. The CAD is supported by the positive dynamics of oil prices. However, in the near future we do not exclude technical correction of the trading instrument. Today we recommend you pay attention to the news background from the United States. Positions must be opened from key levels.
Canada's financial markets are closed due to the holiday.
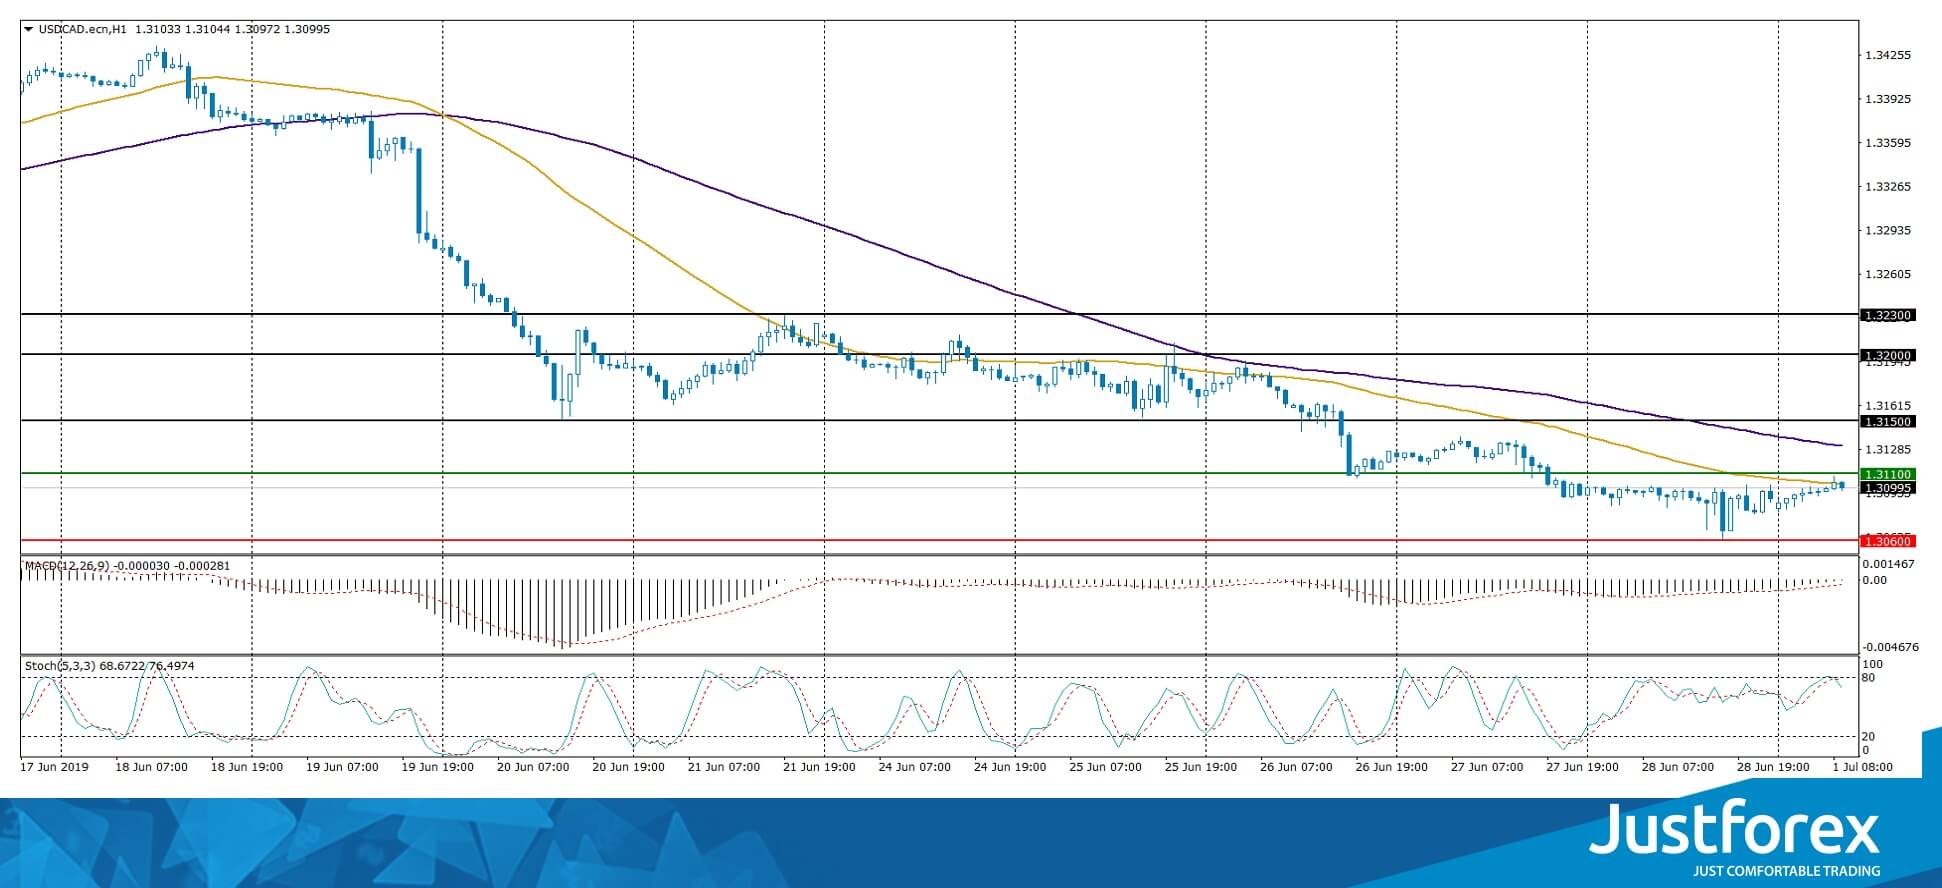
Indicators do not give accurate signals: the price crossed 50 MA.
The MACD histogram is near the 0 mark.
Stochastic Oscillator is in the neutral zone, the% K line crossed the% D line. There are no signals at the moment.
Trading recommendations
Support levels: 1.30600, 1.30300, 1.30000
Resistance levels: 1.31100, 1.31500, 1.32000
If the price consolidates above the level of 1.31100, the quotes will rise towards 1.31500-1.31800.
Alternatively, the quotes can descend towards 1.30400-1.30200.
The USD/JPY currency pair
Technical indicators of the currency pair:
Prev Open: 107.776
Open: 108.288
% chg. over the last day: +0.46
Day's range: 108.102 – 108.510
52 wk range: 104.97 – 114.56
On the USD/JPY bullish sentiment continues to prevail. Today, the trading instrument opened with a gap up of more than 35 points. USD / JPY quotes updated local highs. At the moment, the currency pair is testing the resistance level of 108.500. The mark 108.100 is already a “mirror” support. Do not rule out further weakening of the yen against the US dollar. Positions must be opened from key levels.
Pay attention to economic releases from the USA.
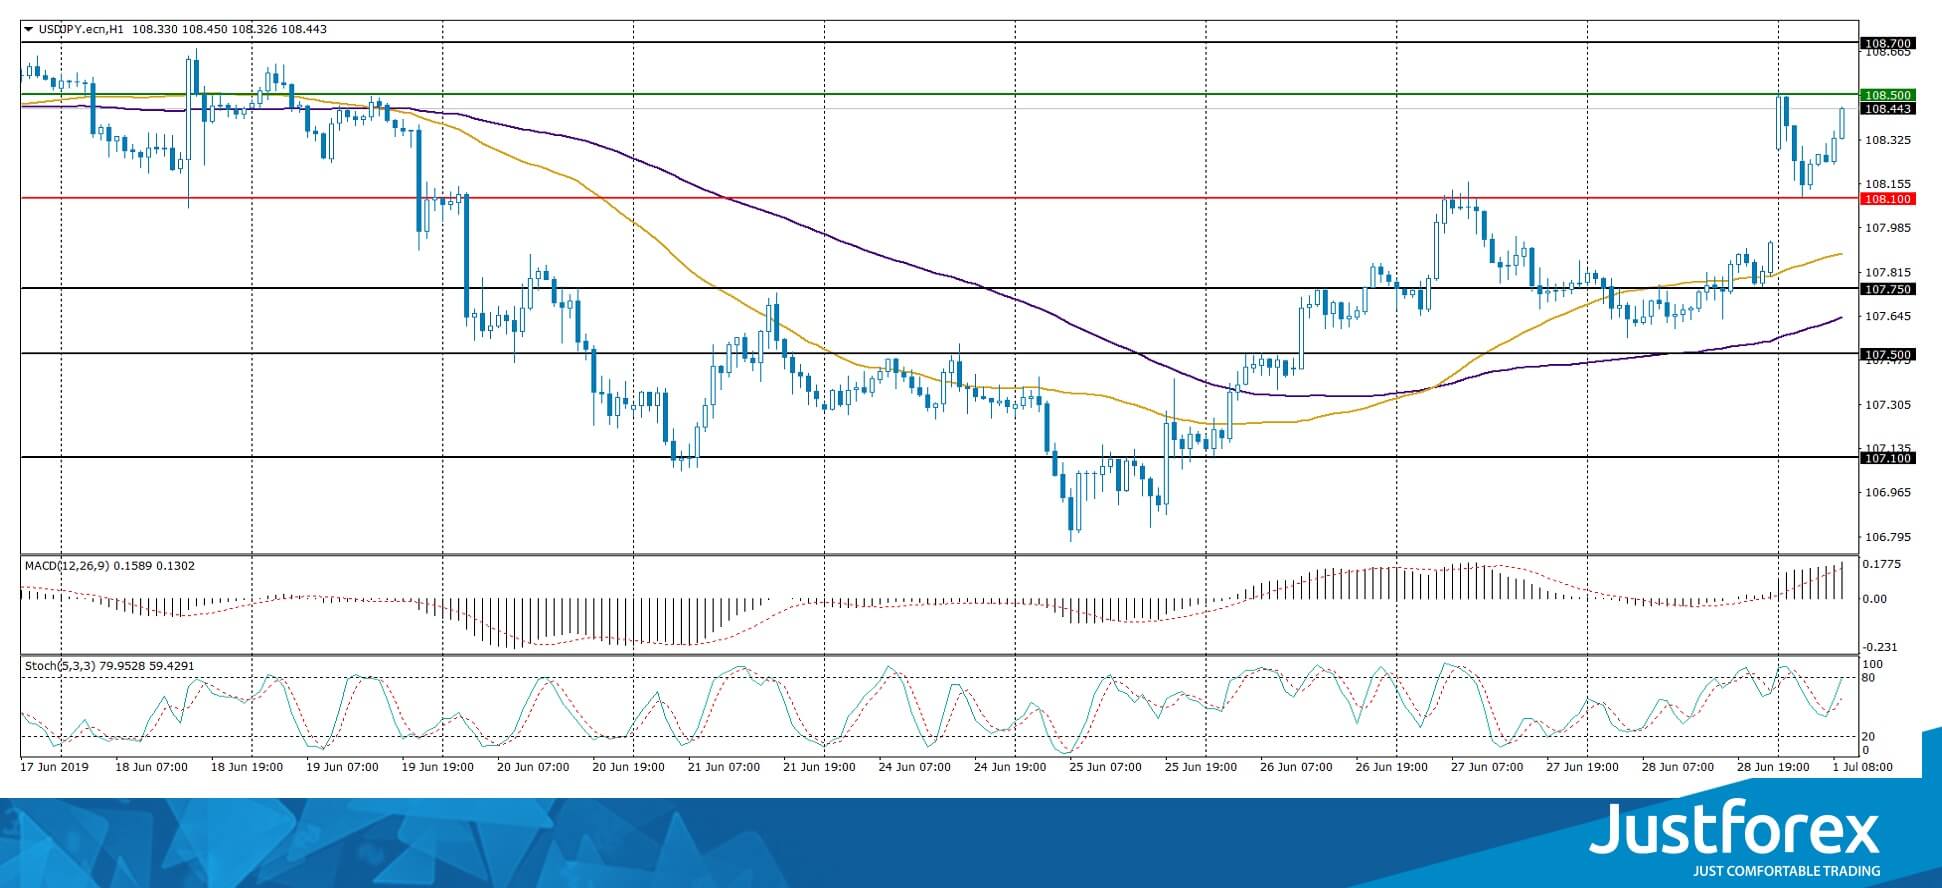
The price has fixed above 50 MA and 100 MA, which indicates the strength of buyers.
The MACD histogram is in the positive zone and above the signal line, which gives a strong signal to buy USD / JPY.
The Stochastic Oscillator is in the neutral zone, the% K line is above the% D line, which also indicates bullish moods.
Trading recommendations
Support levels: 108.100, 107.750, 107.500
Resistance levels: 108.500, 108.700, 109.000
If the price consolidates above the mark of 108.500, further growth of the USD / JPY quotes is expected. The potential movement to 108.700-109.000.
Alternatively the quotes can decrease towards 107.750-107.500.
GBP/JPY Daily Outlook
Daily Pivots: (S1) 136.46; (P) 136.83; (R1) 137.39; More...
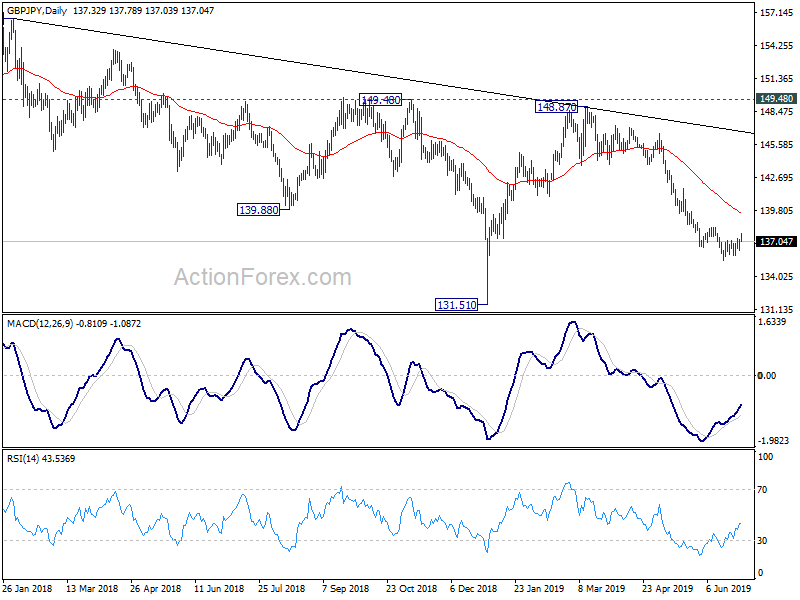
No change in GBP/JPY's outlook despite today's recovery. Price actions from 135.38 are seen as a consolidation pattern. Upside of recovery should be limited by 138.32 resistance to bring fall resumption. On the downside, break of 135.38 will extend recent fall from 148.87 to retest 131.51 low. Though, firm break of 135.38 will confirm short term bottoming and bring stronger rebound to 55 day EMA (now at 139.54) and above.
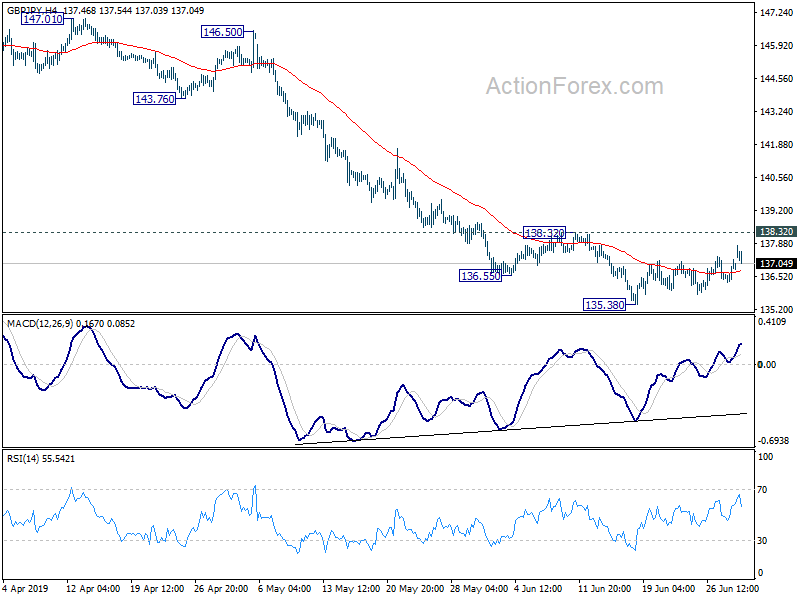
In the bigger picture, current development suggests that GBP/JPY's medium term fall from 156.59 (2018 high) is still in progress. Break of 131.51 will target 122.36 (2016 low). Structure of such decline is corrective looking so far, arguing that it's just the second leg of consolidation from 122.36. Thus, we'd expect strong support from 122.36 to contain downside to bring reversal.
EUR/JPY Daily Outlook
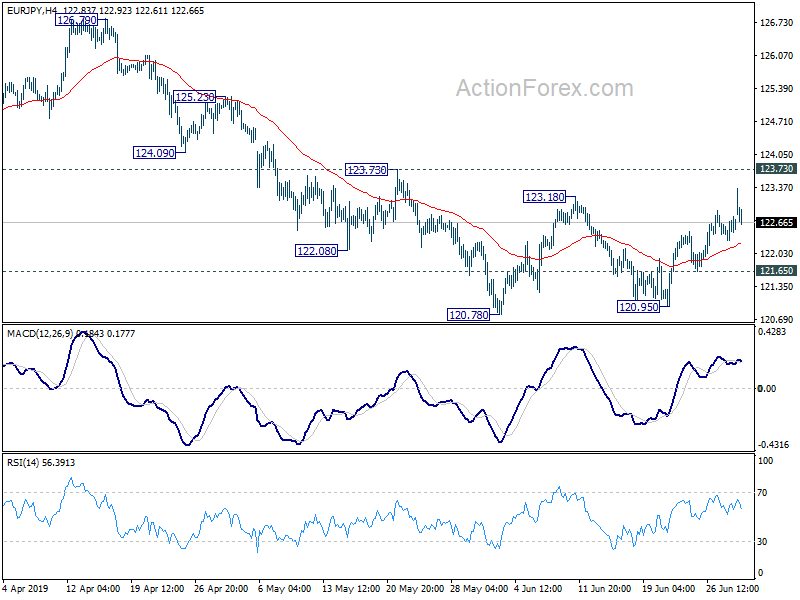
Daily Pivots: (S1) 122.41; (P) 122.60; (R1) 122.91; More....
EUR/JPY edged higher today but overall outlook is unchanged. Price actions from 120.78 are seen as a consolidation pattern. Further rise cannot be ruled out. But upside should be limited by 123.73 resistance to bring larger fall resumption. On the downside, below 121.65 minor support will turn bias to the downside for 120.78 low. Decisive break there will resume the decline from 127.50 and target 118.62 low next.
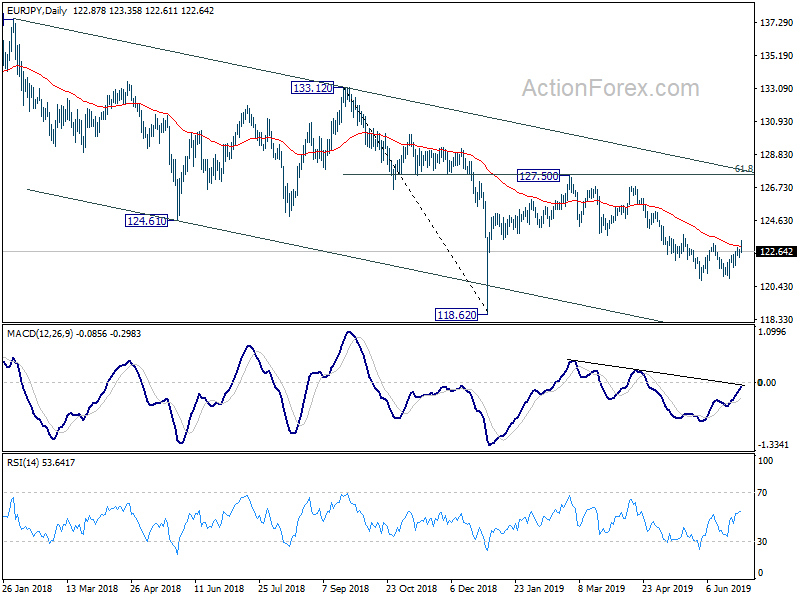
In the bigger picture, down trend from 137.49 is still in progress with the cross staying inside long term falling channel. Break of 118.62 will extend the fall to 109.48 (2016 low). On the upside, break of 127.50 resistance is needed to be the first sign of medium term reversal. Otherwise, outlook will remain bearish in case of strong rebound.
Markets Opened The Week With A Gap Up
On Friday, the markets were waiting for the G20 summit to end, and therefore were in no hurry to grow. So, by the end of the session, the Dow Jones lost 0.45%, the S&P500 sank by 0.30%, and the Nasdaq was in the red by 0.32%.
Formally, the negotiations have already ended but whether the actions of politicians will coincide with promises and agreements, we'll see during the week. Meantime, stock markets are pleased with the positive outcome: no sharp statements on G20 were made, and the United States and China came to a certain consensus on Saturday. The presidents declared that they are resuming the dialogue on the "trade wars" and are considering the possibility of rejecting a new round of strengthening mutual tariffs. Trump also stressed that he was going to loosen sanctions against Huawei – news that was somewhat unexpected, and positively received by the markets as a result.
Furthermore, the China A50 opened the week with a gap up and is now trading at around 13962. The Dow Jones was also in with the similar outcome, showing a jump to 26863 at the beginning of the week.
FxPro analysts point out that there is a wary mood in the markets: investors are not sure that the Saturday dialogue on G20 will be able to stabilise the economic situation and ease the growing tension around the trade wars. But the uncertainty on the part of the Fed, in this case, is becoming a much stronger factor that will influence the US currency throughout the next week, while reducing the appetite for corporate spending.
Thus, the dollar sank on Friday after the Base personal consumption index rose by 0.2%. That confirmed the market's expectations and was a weighty argument for the fact that the Fed will cut the rate from 2.5% to 2.25% in July. With the negative news of the US, the euro showed impressive growth in EURUSD, closing June with the strongest increase in the last 17 months.
Currently, the EURUSD is moderately declining, trading at around 1.1317. Following the positive news from the G20 summit, we are likely to see an upward trend again over the new five days. The course may push the end of June resistance at 1.1400, break through it and rush to 1.1464, or even 1.1527.
It is also worth bearing in mind the results of the negotiations between the President of Russia and the Crown Prince of Saudi Arabia on the oil issue. A preliminary agreement was reached on the extension of the OPEC + deal, which has had a positive impact on Brent on Monday: it has opened the session with a gap up, at $65.67 per barrel. A two-day OPEC+ meeting is now to set to begin, which will dot the i and conclude the final decision to be taken by the parties – including which documents will be signed. In light of this, volatility in the energy market will be increased.