Sample Category Title
Trump Thinks China Wants A Deal
European markets are picking up the momentum from Asian trading session which was primarily weak. Stocks moved lower over in Asia despite the fact that Wall Street broke its four day losing streak yesterday. The focus is on the G-20 meeting and investors are trying to make sense of any new development coming out of Japan with respect to the trade war between the US and China.
Trump needs to understand that it cannot bully its way in, especially not with the second biggest economy of the world. President Xi, has made it clear that he is ready to talk, but the ground needs to be balanced for both sides. US trade representative, Robert Lighthizer, has told China that nothing will be even-handed, because of the violation of intellectual property.
Market participants are hopeful that both countries will resolve their issues and they will use the current opportunity to lay down the frame work of their future talk on trade negotiations. This is because President Trump has said that China wants a deal more than the US. The White House economic advisor Larry Kudlow believes that if the China doesn’t come to their terms, pushing for more tariffs is the only way forward.
Gold Prices To Remain Choppy
Gold price is going to remain very choppy as we go into weekend because of the ongoing G-20 meeting. Traders are going to see if there is optimism around the trade war between the two super powers and if the situation doesn’t show any signs of easing, then it means that the Fed will have to intervene. I am expecting the gold price to hold above the support level of 1370 and as for the upside, the resistance of 1450 is significant. Also, after the G-20 meeting, a factor which is going to be of significant importance is the US NFP data, the Fed’s next move is data dependent.
Oil and G-20 Meeting
As for the oil price, let’s see if other countries can support Iran, clearly the UAE has made its position clear that they are not supporting the US accusing Iran about the recent events. This is a meaningful development. If Iran and US open the door of negotiation about a new deal, we expect the oil price move lower to the level of 54 or even lower. However, if the outcome of the G-20 meeting shows that Iran has lost support of countries like the UK and France, this could push the price higher and WTI could touch the level of 63
EUR/GBP Daily Outlook
Daily Pivots: (S1) 0.8945; (P) 0.8964; (R1) 0.8990; More...
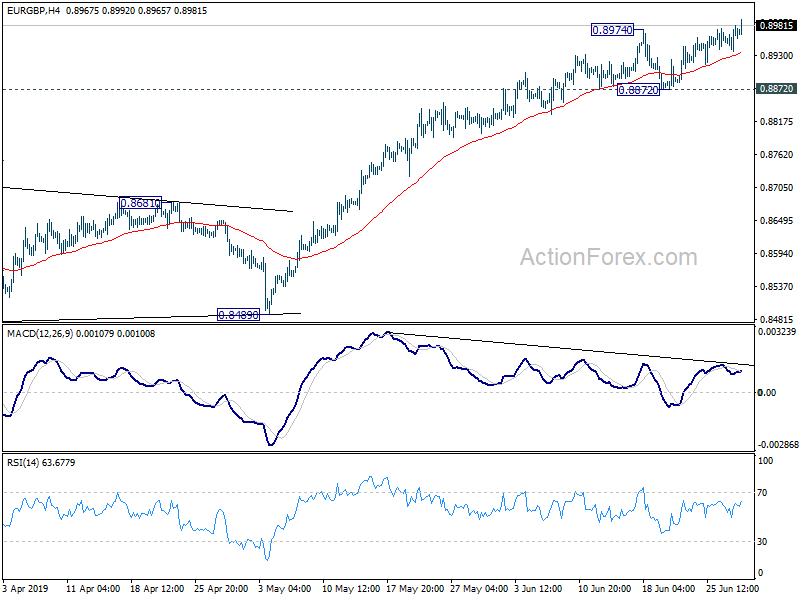
EUR/GBP's rally should have resumed by breaking 0.8974 resistance. Intraday bias is back on the upside. Current rally from 0.8472 is in progress for 0.9101 key resistance next. On the downside, break of 0.8872 support is needed to indicate short term topping. Otherwise, near term outlook will remain bullish in case of retreat.
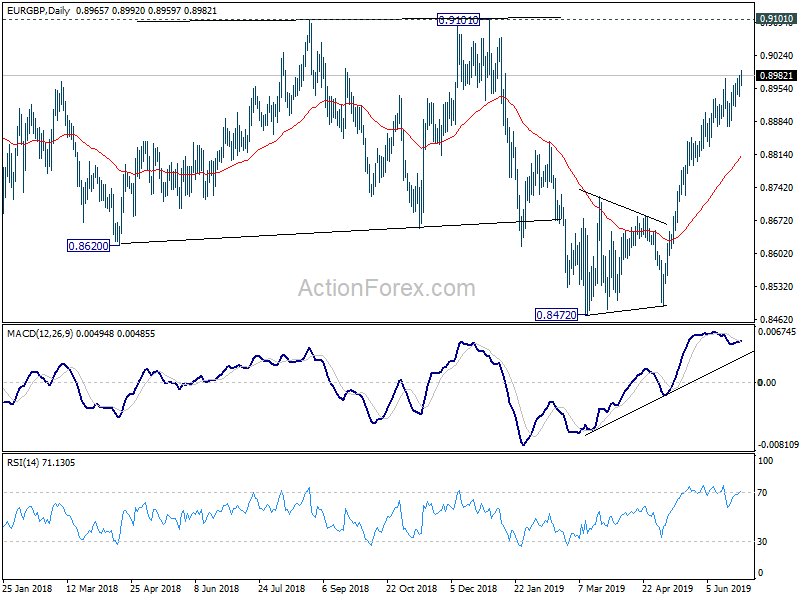
In the bigger picture, medium term decline from 0.9305 (2017 high) is seen as a corrective move. No change in this view. Current development argues that it might have completed with three waves down to 0.8472, just ahead of 38.2% retracement of 0.6935 (2015 low) to 0.9306 at 0.8400, after hitting 55 month EMA (now at 0.8527). Decisive break of 0.9101 resistance will confirm this bullish case. Nevertheless, as EUR/GBP is still staying inside long term falling channel, correction from 0.9305 could still extend to 0.8400 fibonacci level before completion, if upside is rejected by 0.9101.
EUR/AUD Daily Outlook
Daily Pivots: (S1) 1.6195; (P) 1.6247; (R1) 1.6274; More...
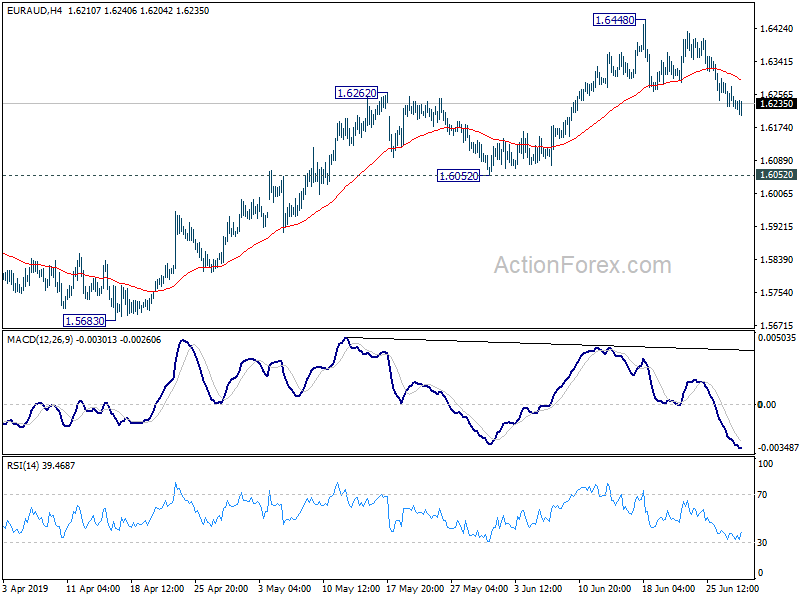
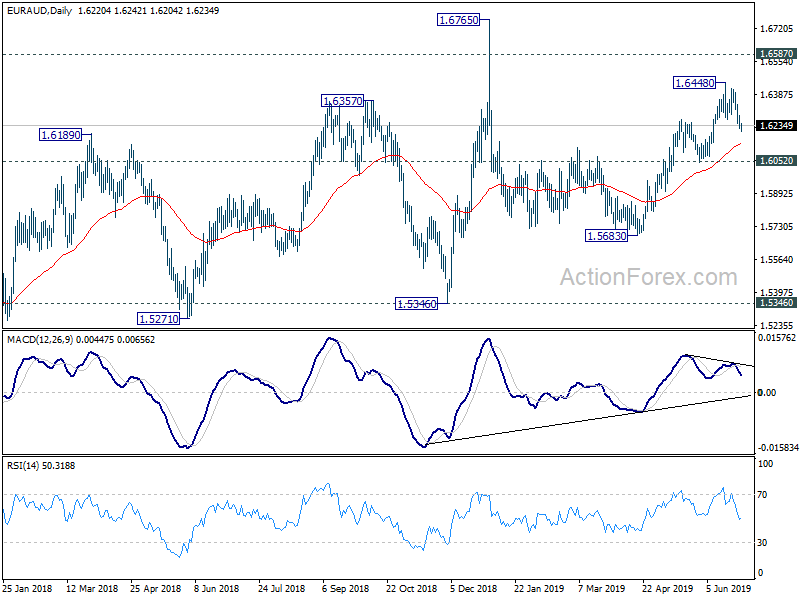
EUR/AUD drops further today as consolidation from 1.6448 extends. But outlook is unchanged and intraday bias remains neutral. Downside should be contained above 1.6052 support to bring rise resumption. On the upside, break of 1.6448 will resume the rally from 1.5683 and target 1.6765 high.
In the bigger picture, as long as 1.5346 support holds, outlook will still remain bullish. Up trend from 1.1602 (2012 low) is expected to resume sooner or later. Break of 1.6765 will target 61.8% retracement of 2.1127 (2008 high) to 1.1602 at 1.7488 next. However, firm break of 1.5346 key support will indicate trend reversal and turn outlook bearish.
EUR/USD Outlook: Euro Bounces On Solid EU Data, G20 Summit In Focus
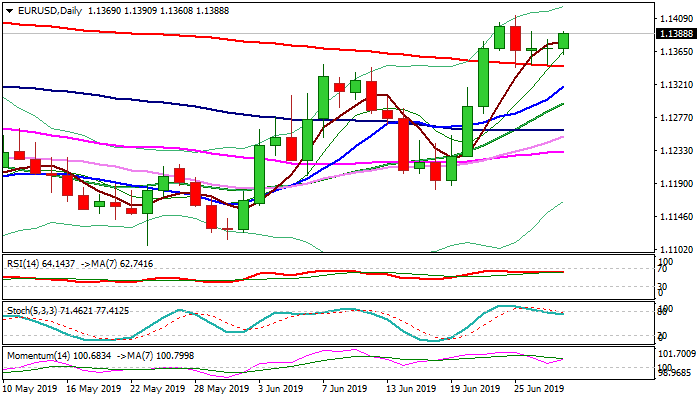
The Euro jumped in early European trading on Friday, boosted by solid data from EU member countries. German import prices showed better than expected results in May, French inflation beat expectations, while Spanish data showed that economy grew in Q1 at the fastest pace since Q4 2017 and retail sales showed upbeat results in May. The single currency bounces from key support provided by 200DMA (1.1345) which contained attacks in past three days and limited pullback from new three-month high at 1.1412. Doji candles on Wed/Thu and long tails on candles in past three days signal that the downside remains well protected and broader bullish bias intact for renewed attack at 1.1400 resistance zone. Fresh bullish momentum on daily chart and MA's in bullish setup, support the notion. Release of EU inflation and UK GDP data could provide fresh signals as markets focus on G20 summit and Trump / Xi meeting which is the key event of this week.
Res: 1.1400, 1.1412, 1.1436, 1.1461
Sup: 1.1374, 1.1360, 1.1345, 1.1319
G20 Summit Has Started: Investors Are ‘Throwing Off’ The Dollar
Today, the G20 Summit gets underway in Japan, with the subsequent talks set to dominate the news agenda over the course of the next few days. The most interesting meetings are scheduled for Saturday, meaning that on Monday the market will open with a gap on both the American and Chinese markets.
The main focus will still be on the US-China negotiations. Interestingly, the media leaked information from "informed sources" that Trump and Xi Jinping had agreed in advance that – after the meeting – they will announce a truce in the trade war, so not to create too much of a negative effect to the markets. Added to this, US Treasury Secretary Steven Mnuchin stoked things up further by stating that the agreement “is 90% ready.” Of course, this does not mean it will be accepted and executed. On the one hand, the markets understand this and try to avoid making any sharp movements: the Dollar index stood still at the level of 96.18 on Thursday. On the other hand, the investors are rather tired with the trade war issues, and a certain optimism, fed by rumours from the media, is included in the US indices quotes.
Last session, the stock markets closed in different directions: Dow Jones lost -0.04%, S&P500 grew by 0.38%, and NASDAQ Composite was in green by 0.67%. The Hang Seng, which closed yesterday 1.42% higher, and the NIKKEI 225, which added 1.19%, probably believe in a positive resolution of the US-China situation.
As for macroeconomic statistics, it is interesting to pay attention to the published US Initial Jobless Claims. The data showed an increase of 10K, to 227K, while analysts expected a more modest increase, to 220K. This affected the EURUSD fall, with the rate dropping from 1.1372 to 1.1355 within an hour after the data was published. However, it later kicked up, and during the first G20 hours on Friday, it was going vertically upwards, above 1.1390. Investors came out of the dollar, fearing what decisions will be made at the summit.
As mentioned by the FxPro Analyst team, it is also worth opening the economic calendar today to check the actual Core PCE value for May (y/y). Despite the data being released with a month-delay, it could increase the volatility in pairs with the dollar. The fact is that this value still cannot reach or consolidate above the key level of 2% (now it is 1.6%, with a similar forecast). This indicator is monitored by the Fed: based on it, the regulator decides whether to normalize the monetary policy or not. Since the beginning of the year, the underlying inflation rate has slowed, influencing Powell’s decision to suspend a series of interest rate increases.
If the analysts' expectations are not justified, and the data turns out to be even worse than the forecasts, the triumphant start to the day for the EURUSD will get additional support and send the pair up to 1.141 – and potentially even higher. If we see an increase in value, it will help the dollar to stabilise itself for a moment and adjust its course against the euro. However, any news from the G20 may be stronger.
Crude oil, apparently tired of growing, and following Thursday, dropped to $65.46 per barrel, losing 1.55%. Investors are worried about Trump’s views on keeping energy prices as low as possible. At the same time, Saudi Arabia requires the support of the White House to ensure the safety of tankers in the Persian Gulf.
EUR/CHF Daily Outlook
Daily Pivots: (S1) 1.1086; (P) 1.1115; (R1) 1.1133; More...
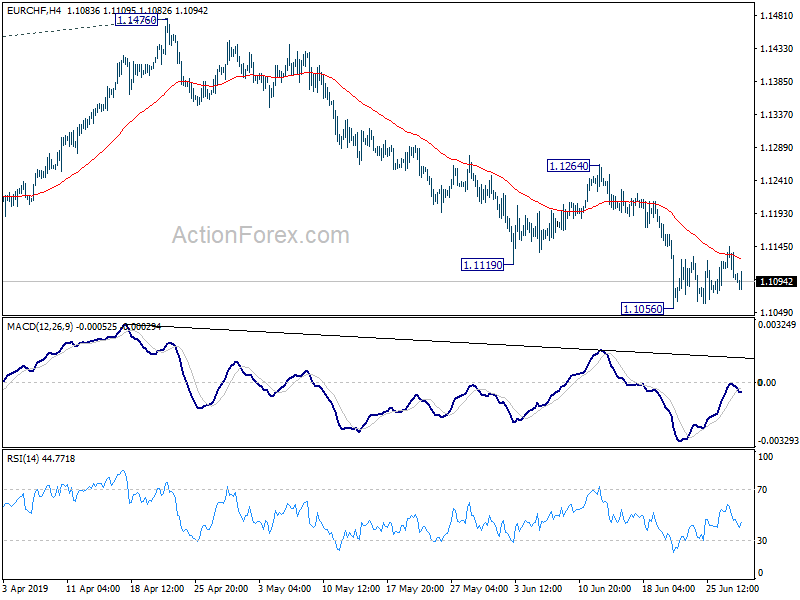
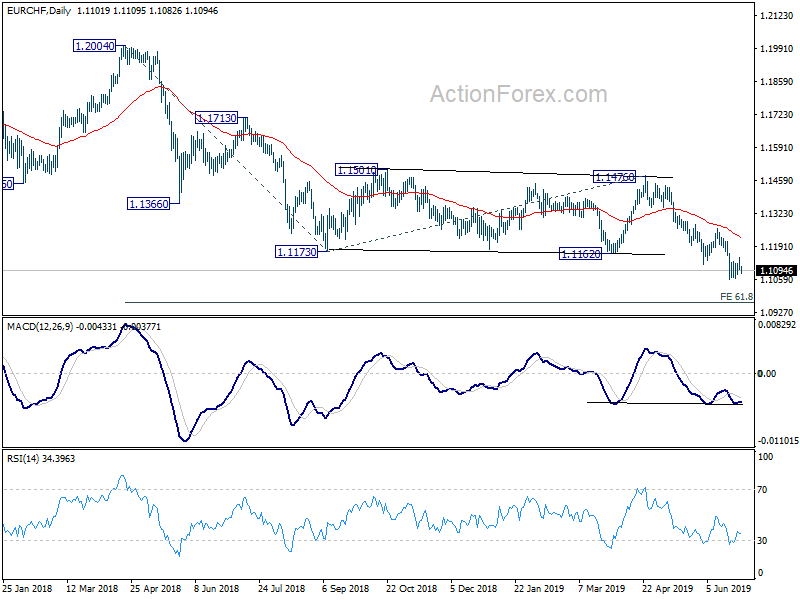
No change in EUR/CHF's outlook as it's staying in consolidation from 1.1056. Intraday bias remains neutral for the moment. Upside of recovery should be limited below 1.1264 resistance to bring further decline. On the downside, break of 1.1056 will resume the larger down trend for 61.8% projection of 1.2004 to 1.1173 from 1.1476 at 1.0962 next.
In the bigger picture, current development firstly suggests that down trend from 1.2004 is still in progress. More importantly, it's likely a long term down trend itself, rather than a correction. Outlook will remain bearish as long as 1.1476 resistance holds. EUR/CHF could target 1.0629 support and below.
Elliott Wave UPDATE: EUR/USD Stronger After 1.1315 Correction, DAX Already Higher
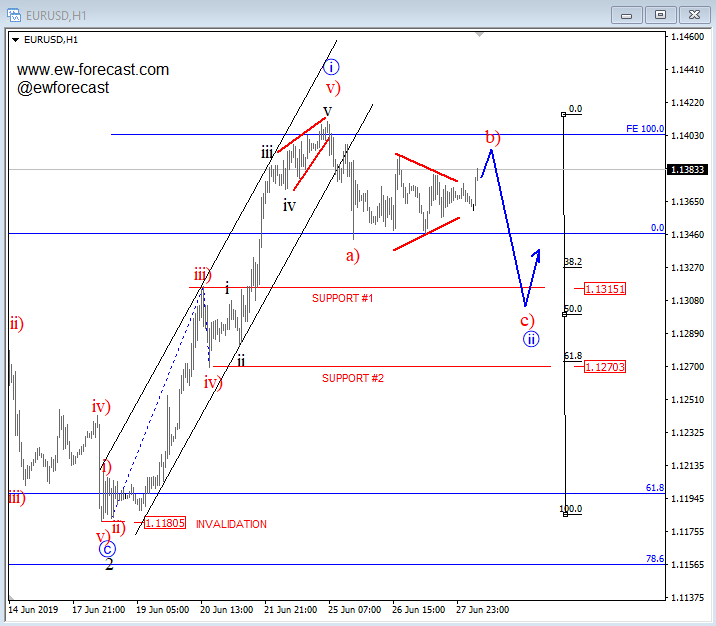
EURUSD made a five-wave rally from the 1.118 level labelled as a higher degree wave i, and later found resistance and a temporary top near the 1.142 region, from where a pullback started to unfold.After a five-wave movement fully shows up, a three-wave retracement is expected to unravel, and in this case the pullback can look for support near the 1.1315/1.1270 region (area of former swing highs and lows).
EURUSD, 1h
Now taking a quick glance at the german stock market.
German DAX made a three-wave pullback recently from the 12350 region, where a former wave 1 had ended. We labelled a flat correction in wave 2 that looks to have found support at the 12180 level, from where a new five-wave recovery may have started to from. We see first two legs, i and ii as completed, so current intra-day rise can ideally be wave iii, aiming above 12435 bullish lvl.
German DAX, 1h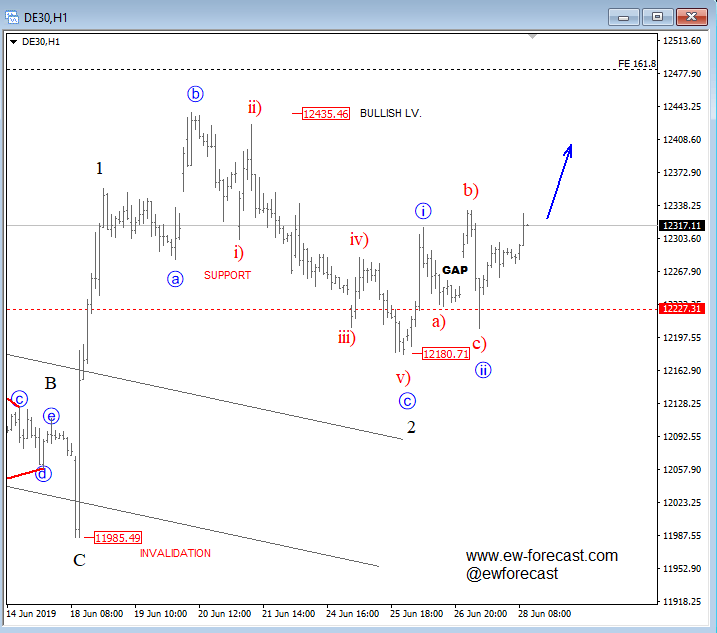
DAX30 Bullish Bounce Targeting 12400 Zone
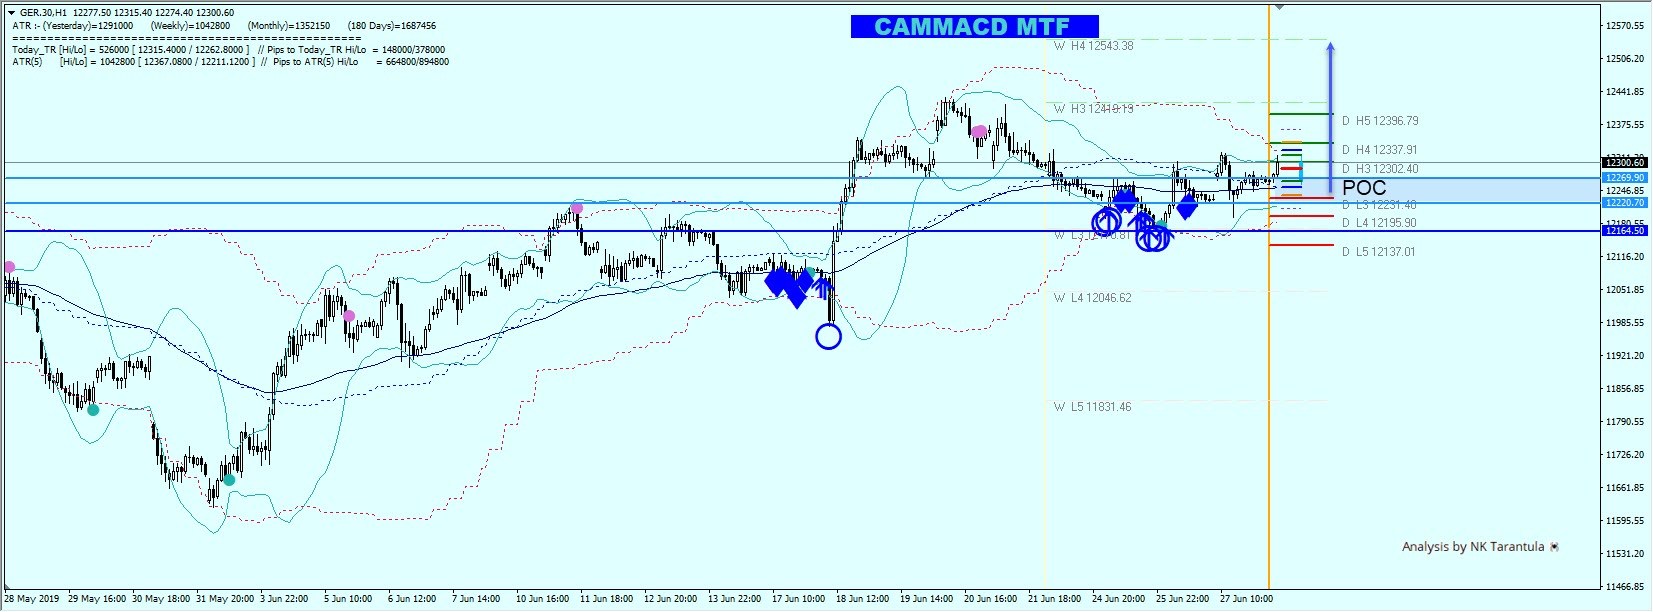
The DAX has formed a bullish structure right at the support. The POC zone 12220-12269 might make the price bounce towards next targets.
Targets for the move are 12410 and 12543 if 12410 breaks. We can also see 12164 as the daily support which is very important for bulls. A bounce from the POC zone should make the index higher especially because MTF shows bullish trend perspective. Have in mind that 12164 needs to hold in order for DAX30 to continue with bullish move.
Emerging pattern is a rounded bottom, which signifies newly formed bullish momentum.
EURNZD Drops Aggressively This Week, Records 3-Week Low
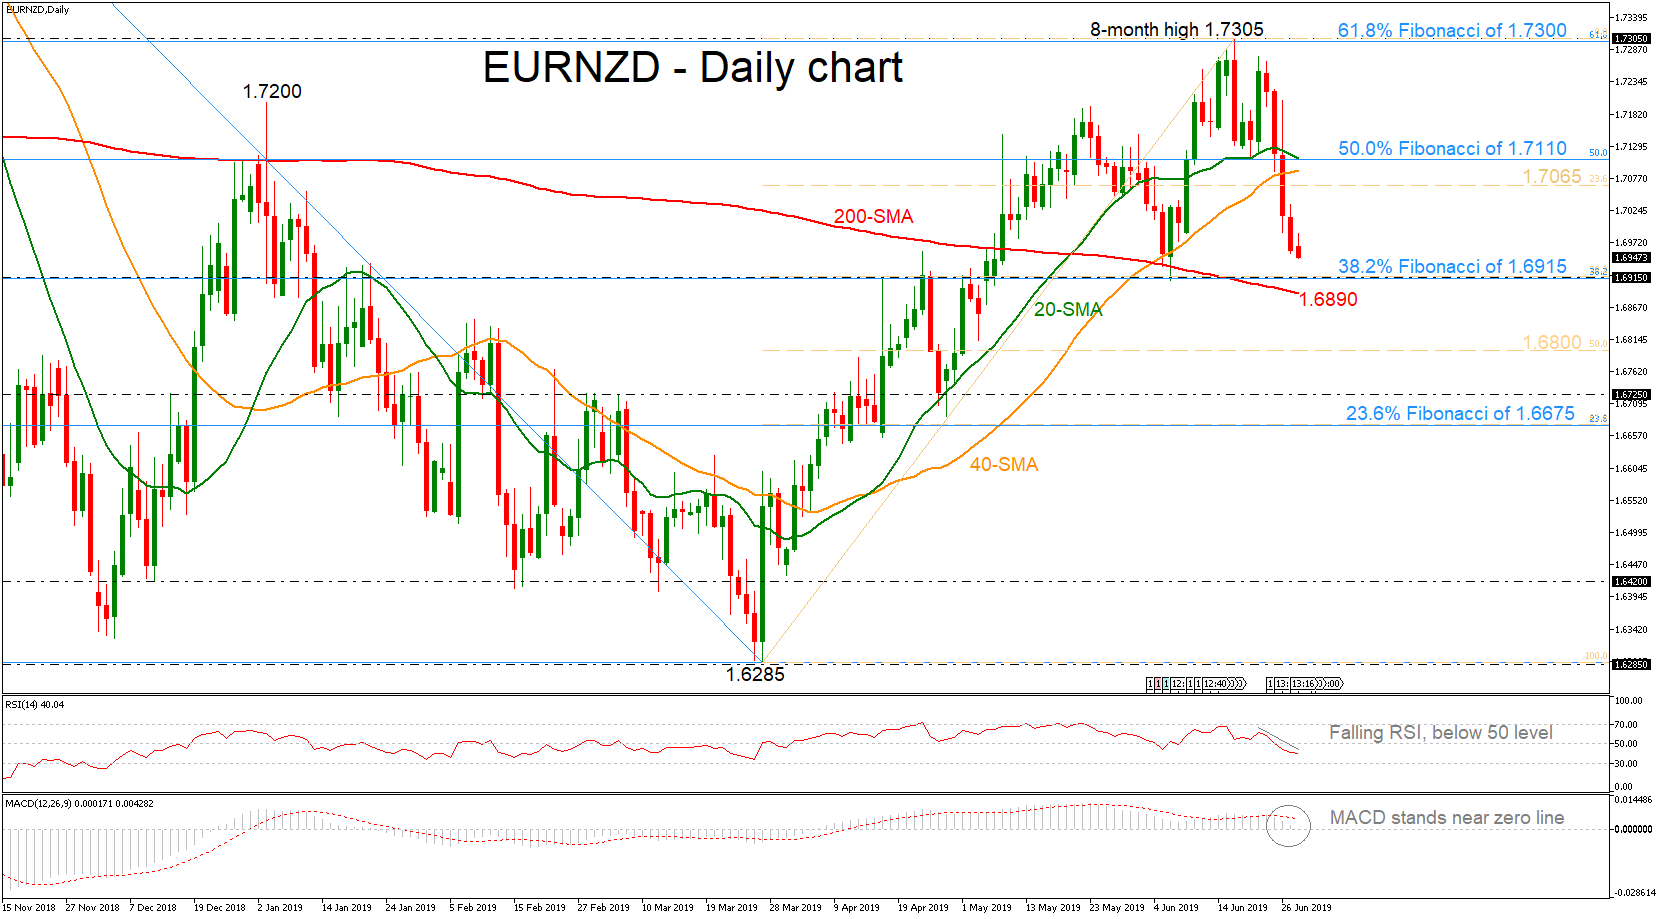
EURNZD lost ground this week, dropping to a new three-week low near 1.6950 today after finding strong resistance at the eight-month high slightly above the 1.7300 psychological mark.
The short-term moving averages are ready to create a bearish cross, signaling more losses, while the technical indicators are losing momentum. The RSI is hovering below the 50 level and the MACD slipped beneath its trigger line and stands near the zero line.
However, should the price close comfortably below the strong support of the 38.2% Fibonacci retracement level of the downfall from 1.7925 – 1.6285, which overlaps with the 38.2% Fibo mark of the upleg from 1.6285 – 1.7305, at 1.6915, this could lead the price to fall towards the 200-day simple moving average (SMA) currently at 1.6890. If there is a drop below these levels, the 1.6800 (50.0% Fibo of the upleg) could act as a strong support level for the bears.
In the positive scenario where the 1.7065 resistance (23.6% Fibo of the upleg) halts upside movements, the market could retest the 50.0% Fibonacci mark of 1.7110 of the downward movement, which stands near the 20-day SMA. If the level proves easy to overcome this time, the increase may next pause somewhere near the 1.7300 handle.
In brief, EURNZD is in a sell-off mode between the short-term and the long-term SMAs. A slip beneath the 200-SMA could open the door for more declines, shifting the bias to neutral, while a run above 1.7300 could rekindle the medium-term buying interest.
LTCUSD Sell Below $125.00
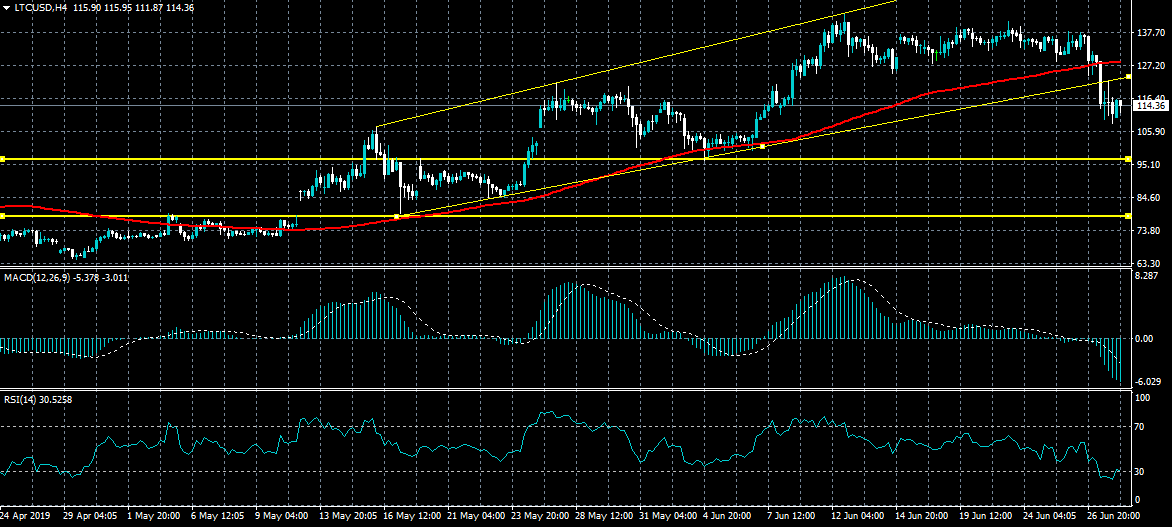
Litecoin has started to turn berish alongside the broader cryptocurrency market after falling below the key $125.00 level. The four-hour time frame is also showing that the LTCUSD pair has now broken under key trendline support. Weakness in the LTCUSD pair should be expected in the short and medium-term while price continues to trade below the pivotal $125.00 level.
The LTCUSD pair is only bullish while trading above the $125.00 level, key resistance is found at the $140.00 and $160.00 levels.
If the LTCUSD pair trades below the $125.00 level, key support is found at the $110.00 and $100.00 levels.