Sample Category Title
Why America Is Falling, And When Italy Abandons The Euro
The US stock indices closed the last session with a decrease: NASDAQ was down by 0.32%, the S&P500 by 0.17%, and Dow Jones managed to add only 0.03%.
The 'red zone' reasons
As well as the news of tensions between the US and China, the US and Iran are now also to blame for this dynamic – which has been going on since the end of last week. The Fed representatives subsequently made negative comments, the essence of which boiled down to the following: monetary policy should be mitigated, and inflation should be monitored, with its growth leaving much to be desired over recent years.
However, the words of FOMC member Brainard had the greatest impact on the dollar. She did not say anything new, and in general, her position remains permanently dovish. However, the nuance is that she has a permanent right to vote, and her opinions were shared by the other speakers on Friday. For example, Neel Kashkari stated the need to lower the interest rate by 50 bp in the nearest future.
Since all Fed officials unanimously decided that weak macroeconomic statistics is the main reason for policy easing, all the upcoming releases will have a particularly strong influence on the formation of the Federal Reserve policy.
What to expect in the US today
With such sentiments we approach a new round of speeches: at 13:00 GMT – we'll listen to Atlanta Fed President Raphael Bostic; at 14:00 GMT – high volatility on USD pairs is expected during the Fed Chairman's statement; at 14:15 GMT – Jerome Powell will be “overlapped” by the ECB representative Benoit Keuer's speech, which will also spur the EURUSD dynamics, and at 19:30 GMT we will hear from James Bullard, a member of the Open Market Committee.
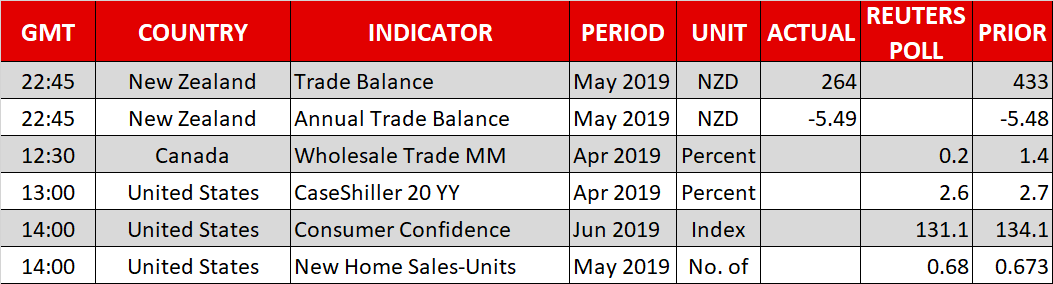
Among the significant macroeconomic news, the US Consumer confidence will be published on Tuesday. Following two months of growth, we can see a drawdown from 134 to 132 points. In addition, today it is worth paying attention to the sales statistics of the primary housing market. May's data will be especially important for the dollar, as this indicator showed a significant previous decrease of 6.9%.
What happens to Italy
The controversial news that Italy is allegedly preparing to abandon the single currency will also affect the euro. The wave of rumours began with the budget committee chairman of the Italian Parliament tweeted images of the new national currency on social media – Mini-BOT – which will be listed in parallel with the euro in order to repay the debt to national companies. Mini-BOT owners will be able to pay taxes, as well as buy goods and services. However, investors are seriously concerned, because in such conditions the euro could end up only being used for external settlements, or even disappear altogether. It is still unknown as to whether such fears will be confirmed.
EURUSD forecast
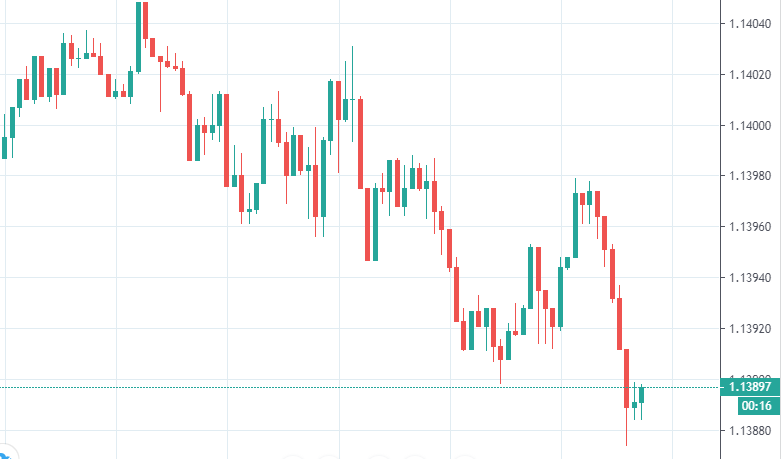
In addition to macroeconomic statistics, the dynamics of the pair is influenced now by a new impulse of tension, which arose after America launched a cyber-attack on Iran’s missile control systems in response to the downed drone. Such events are superimposed on to new sanctions by the White House against numerous Iranian military leaders, alongside a warning about the preparation of sanctions for the country's foreign minister, Mohammad Javad Zarif.
So by the end of the week, EURUSD could either radically change course or consolidate in the 1.1410 - 1.1520 area. From the technical analysis side, the pair is now on the top line of the Bollinger Bands (D1 and W1). If the weekly chart manages to break above the upper line then the next resistance level is expected at 1.1440.
Dollar Erases 2019 Gains And Searches For Stronger Support Ahead Of Fed Speeches
The Dollar Index (DXY) is now trading below the psychological 96 mark and erased all of its year-to-date gains,with G10 and Asian currencies taking advantage of the upside made available by the weaker Greenback. The DXY is clearly on the hunt for a stronger floor, having already broken past multiple support levels and embarked on a remarkable downward spiral since the Fed meeting last week. Markets are clearly buying in to the “Fed rate cut” theme, with investors no longer asking “if” US interest rates will be lowered, instead now trying to figure out the “when” and “how much”.
Tuesday's speeches by Fed chair Jerome Powell as well as James Bullard, the noted dove on the FOMC, could serve as catalysts for more Dollar downside over the near-term. Should either Fed official lend more credence to the FOMC's easing bias, that could help DXY fall to levels not seen since January, potentially closing in on the 95 psychological mark.
With Gold well above $1400, how much more upside is there?
The Dollar's decline has certainly been a boon for Gold prices, with Bullion now trading at $1424 at the time of writing. Having already soared to its highest since 2013, investors will certainly be wondering how much upside is left for Gold.
Gold's lure has only increased amid intensified fears over the global growth outlook that has been severely dampened by US-China trade tensions that have lasted for nearly a year. The now enlarged scope of the US-China conflict, expanding beyond trade to include the tech sector, along with the displays of brinksmanship that have unfolded in recent weeks, creates a narrative that should keep Gold's allure intact.
Risk sentiment simmers ahead of Trump-Xi meeting
Investors appear to be chipping away at Asian equities, with most regional major indices posting slight declines on Tuesday. Markets can do little but wait for the meeting between US President Donald Trump and Chinese President Xi Jinping on the sidelines of the G20 summit in Japan later this week.
The Trump-Xi meeting holds the potential to rock markets, depending on how much the outcome deviates from market expectations.At best, markets can hope for a marked resumption of US-China trade talks. At worst, both leaders walk away to underscore the tremendous gulf that still remains in the US-China standoff. Any show of willingness to compromise by either Trump or Xi would be welcomed by risk assets, potentially pushing equities higher while taking the shine offsafe haven assets such as Gold, the Japanese Yen, and US Treasuries.
The Analytical Overview Of The Main Currency Pairs
The EUR/USD currency pair
Technical indicators of the currency pair:
Prev Open: 1.13704
Open: 1.13982
% chg. over the last day: +0.13
Day's range: 1.13925 – 1.14119
52 wk range: 1.1111 – 1.2009
EUR/USD keeps showing a positive trend. EUR reached 1.14000. USD remains under pressure after the Fed meeting. Current local levels of support and resistance are 1.13750 and 1.14100. Financial markets participants are waiting for a meeting of the leaders of the United States and China during the G20 summit, which will be held June 28-29 in Osaka. In the near future, technical correction of EUR/USD quotes is possible. Open positions from the key levels.
The Economic News Feed for 25.06.2019:
Consumer Trust Index CB (US) – 17:00 (GMT+3:00);
New Real Estate Sales (US) – 17:00 (GMT+3:00);
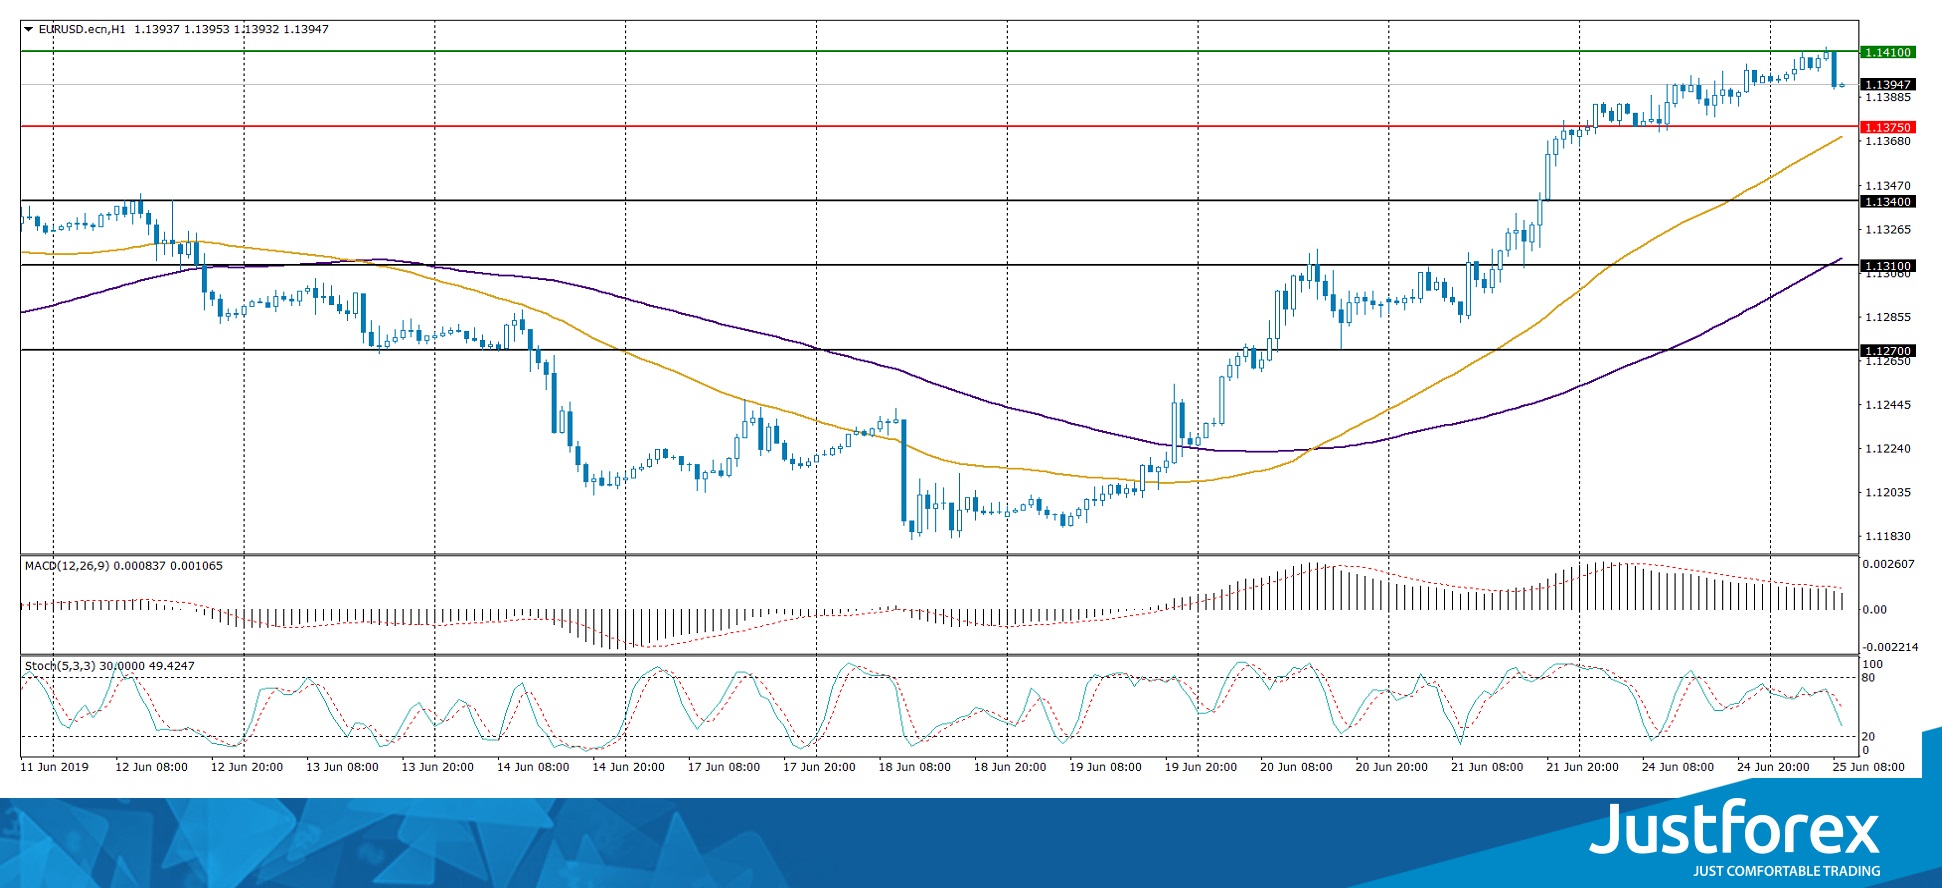
The price fixed above 50 MA and 100 MA which points to the power of the buyers.
The MACD histogram is in the positive zone but below the signal line which gives a weak signal to buy EUR/USD.
The Stochastic Oscillator is in the neutral zone, the %K line is below the %D line which points towards a correction of EUR/USD.
Trading recommendations
Support levels: 1.13750, 1.13400, 1.13100
Resistance levels: 1.14100, 1.14500
If the price fixes above 1.14100, consider buying EUR/USD, the price will move towards 1.14500-1.14700.
Alternatively, the price can correct towards 1.13400-1.13100.
The GBP/USD currency pair
Technical indicators of the currency pair:
Prev Open: 1.27328
Open: 1.27142
% chg. over the last day: -0.10
Day's range: 1.27142 – 1.27554
52 wk range: 1.2438 – 1.3631
GBP/USD stabilized after a long rally. At the moment, GBP / USD quotes are in lateral movement. The trading tool tests local support and resistance levels: 1.27150 and 1.27600, respectively. In the near future technical correction is not excluded. Today we recommend to pay attention to economic releases from the USA. Positions must be opened from key levels.
The Economic News Feed for 25.06.2019 is calm.
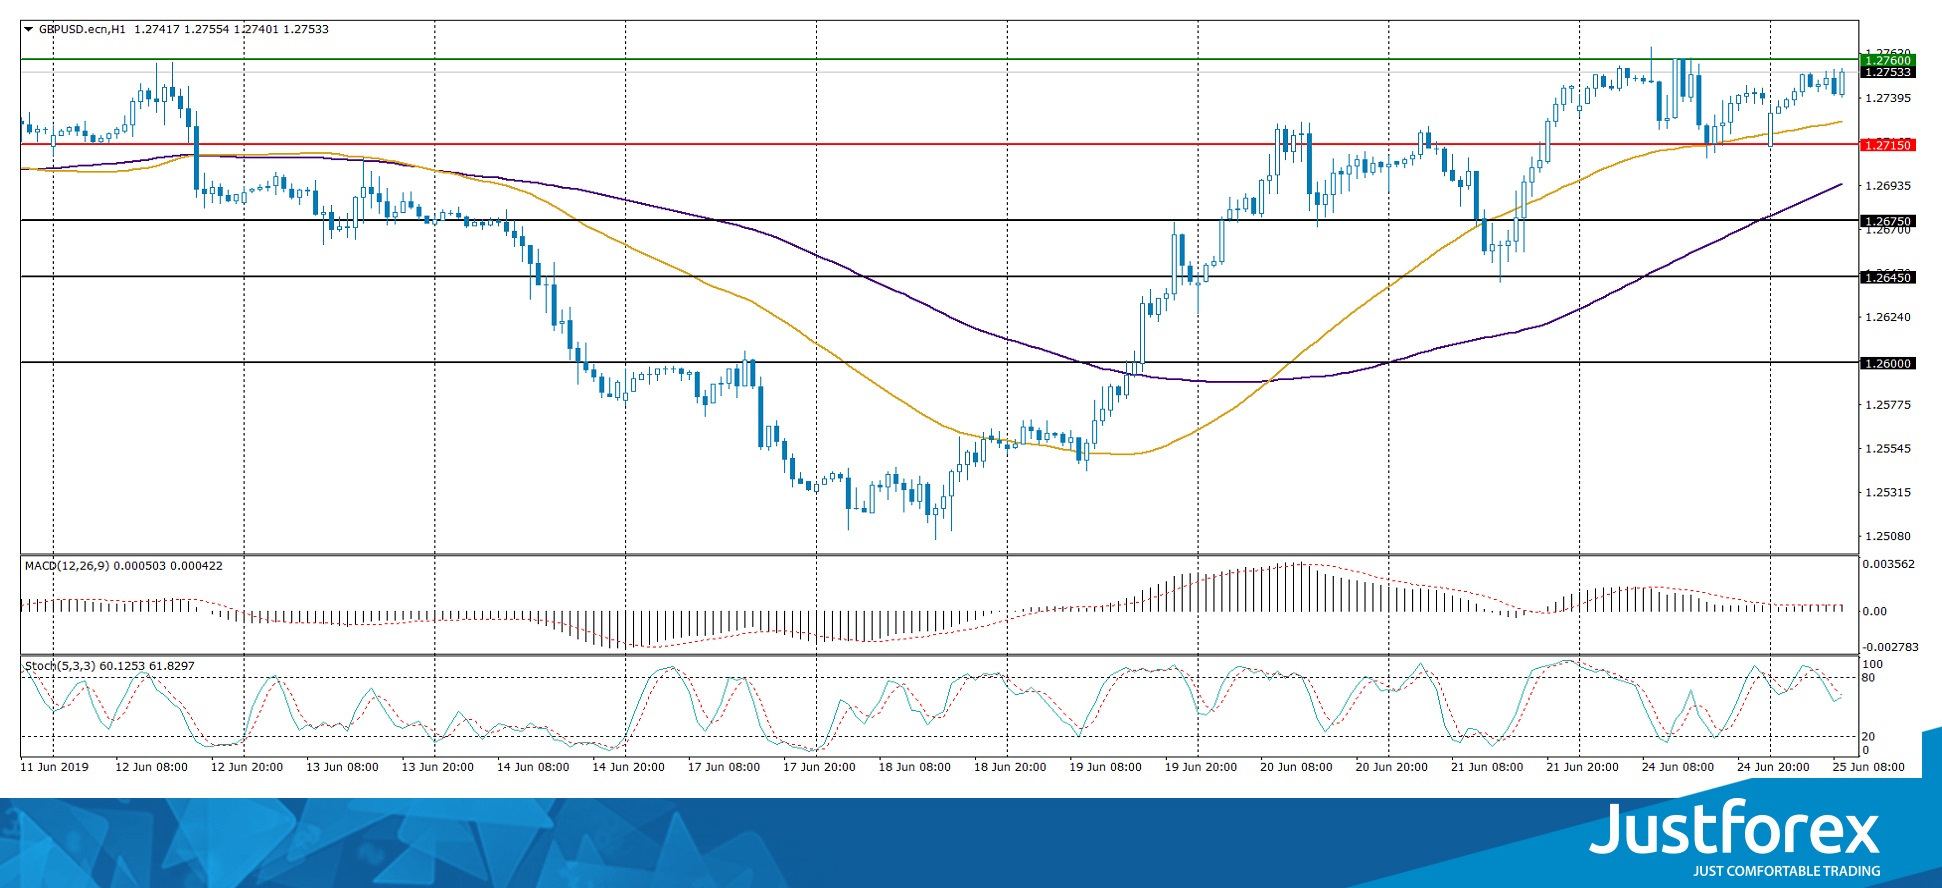
The price fixed above 50 MA and 100 MA which points to the power of the buyers.
The MACD histogram is in the positive zone and keeps rising which gives a strong signal to buy GBP/USD.
The Stochastic Oscillator is in the neutral zone, the %K line started to cross the %D line. There are no signals at the moment.
Trading recommendations
Support levels: 1.27150, 1.26750, 1.26450
Resistance levels: 1.27600, 1.28000
If the price fixes above 1.27600, expect further growth towards 1.28000.
Alternatively, the quotes can correct towards 1.26750-1.26500.
The USD/CAD currency pair
Technical indicators of the currency pair:
Prev Open: 1.32137
Open: 1.31794
% chg. over the last day: -0.12
Day's range: 1.31713 – 1.31962
52 wk range: 1.2727 – 1.3664
CAD keeps trading in a flat. The technical picture is ambiguous. A correction is possible soon. The local support and resistance are 1.31750 and 1.32150. Keep an eye on the US economic reports and the oil quotes dynamics. Open positions from the key levels.
The Economic News Feed for 25.06.2019 is calm. At 15:30 (GMT+3:00) Canada will publish a wholesales report.
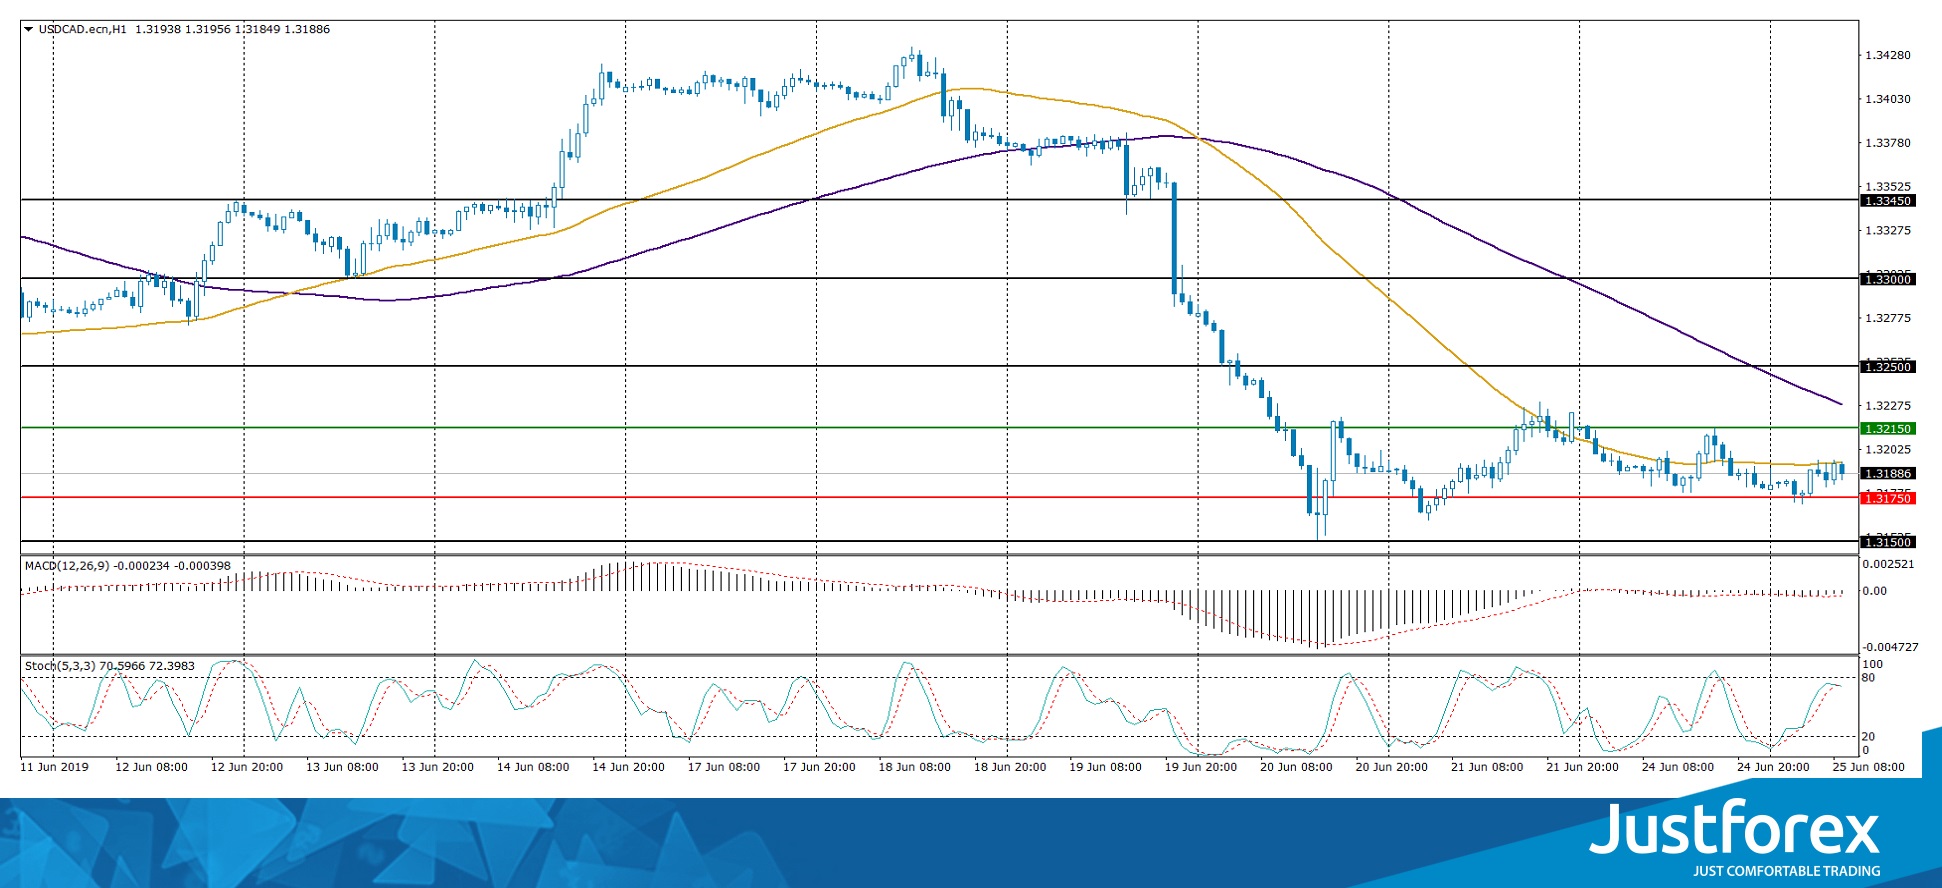
The indicators do not provide precise signals, the price has crossed 50 MA.
The MACD histogram is close to 0. There are no signals at the moment.
The Stochastic Oscillator is in the neutral zone, the %K line is crossing the %D line. There are no signals at the moment.
Trading recommendations
Support levels: 1.31750, 1.31500, 1.31200
Resistance levels: 1.32150, 1.32500, 1.33000
If the price fixes below 1.31750, expect further descend towards 1.31400-1.31200.
Alternatively, the quotes can grow towards 1.32500-1.32700.
The USD/JPY currency pair
Technical indicators of the currency pair:
Prev Open: 107.304
Open: 107.289
% chg. over the last day: -0.03
Day's range: 106.778 – 107.409
52 wk range: 104.97 – 114.56
The USD/JPY once again started to decline. Trading instrument updated local minima. The demand for “safe” assets remains at a fairly high level due to the growth of geopolitical tensions between the US and Iran. At the moment, the USD/JPY quotes are consolidating in the range of 106.800-107.100, respectively. Trading instrument has the potential to further decline. We recommend to pay attention to the dynamics of the yield of US government securities. Positions must be opened from key levels.
The Economic News Feed for 25.06.2019 is calm.
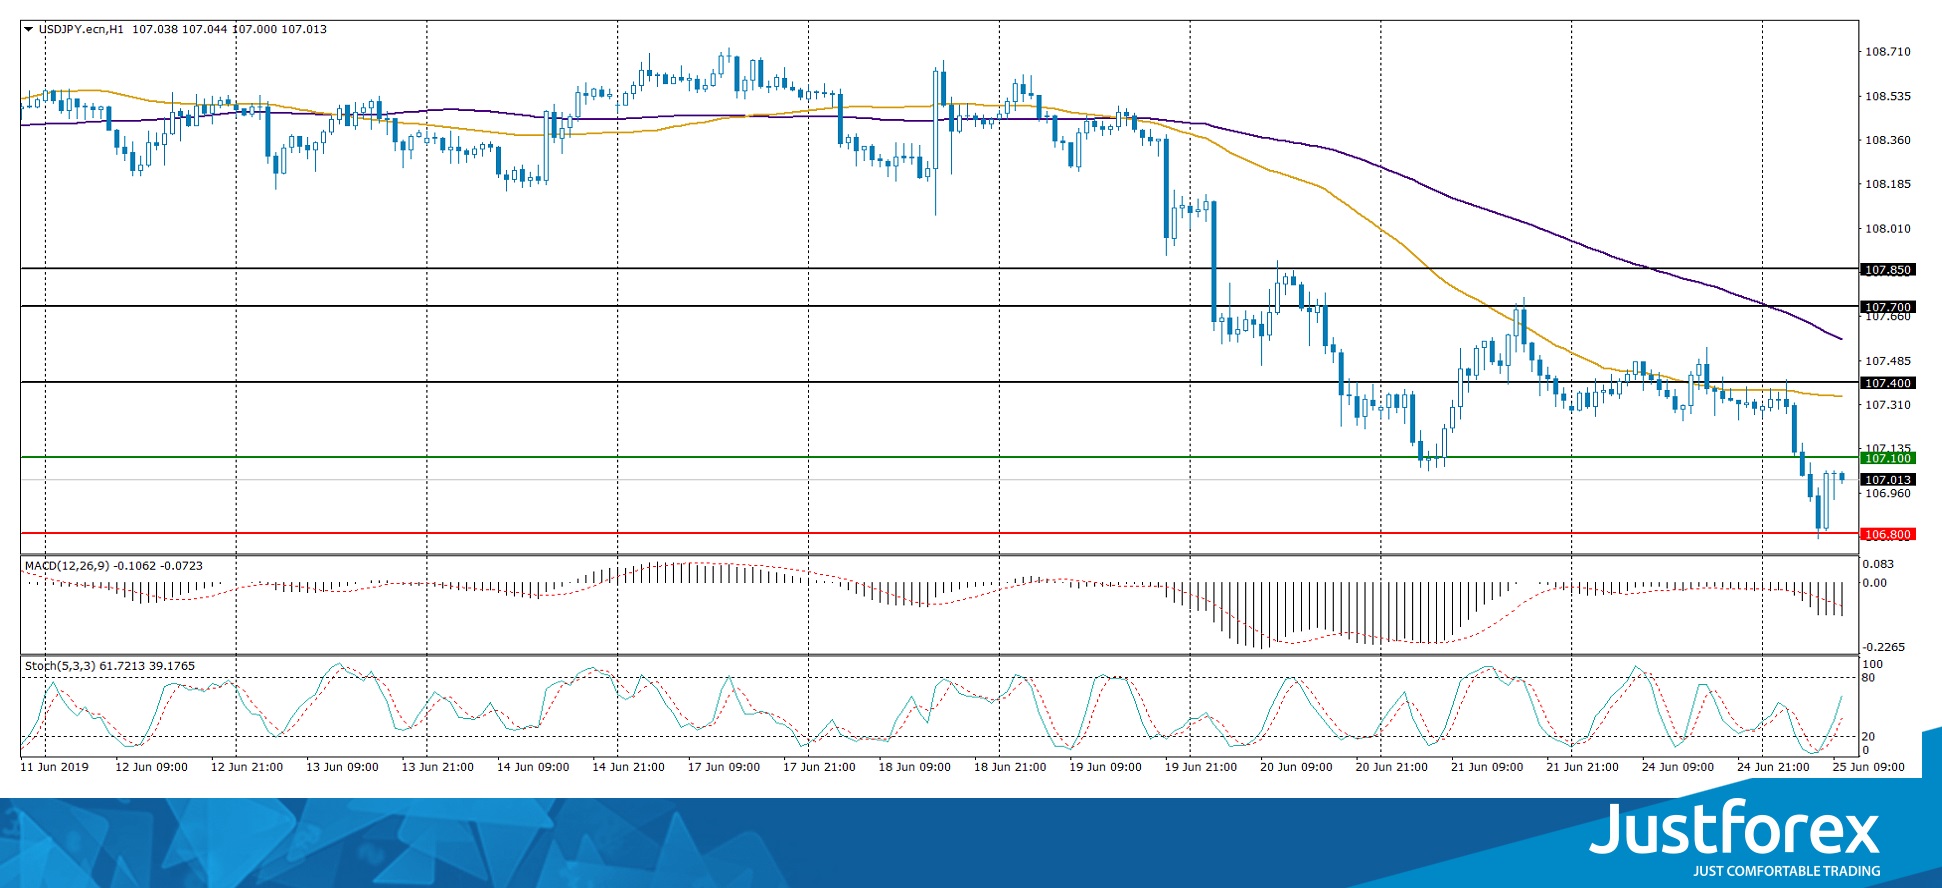
The price fixed below 50 MA and 200 MA which points to the power of the sellers.
The MACD histogram is in the negative zone and below the signal line which gives a strong signal to sell USD/JPY.
The Stochastic Oscillator is in the neutral zone, the %K line is above the %D line which points to the bullish mood.
Trading recommendations
Support levels: 106.800, 106.500
Resistance levels: 107.100, 107.400, 107.700
If the price fixes below 106.800, expect further descend towards 106.500-106.300.
USDJPY Plummets To Fresh 5-Month Low
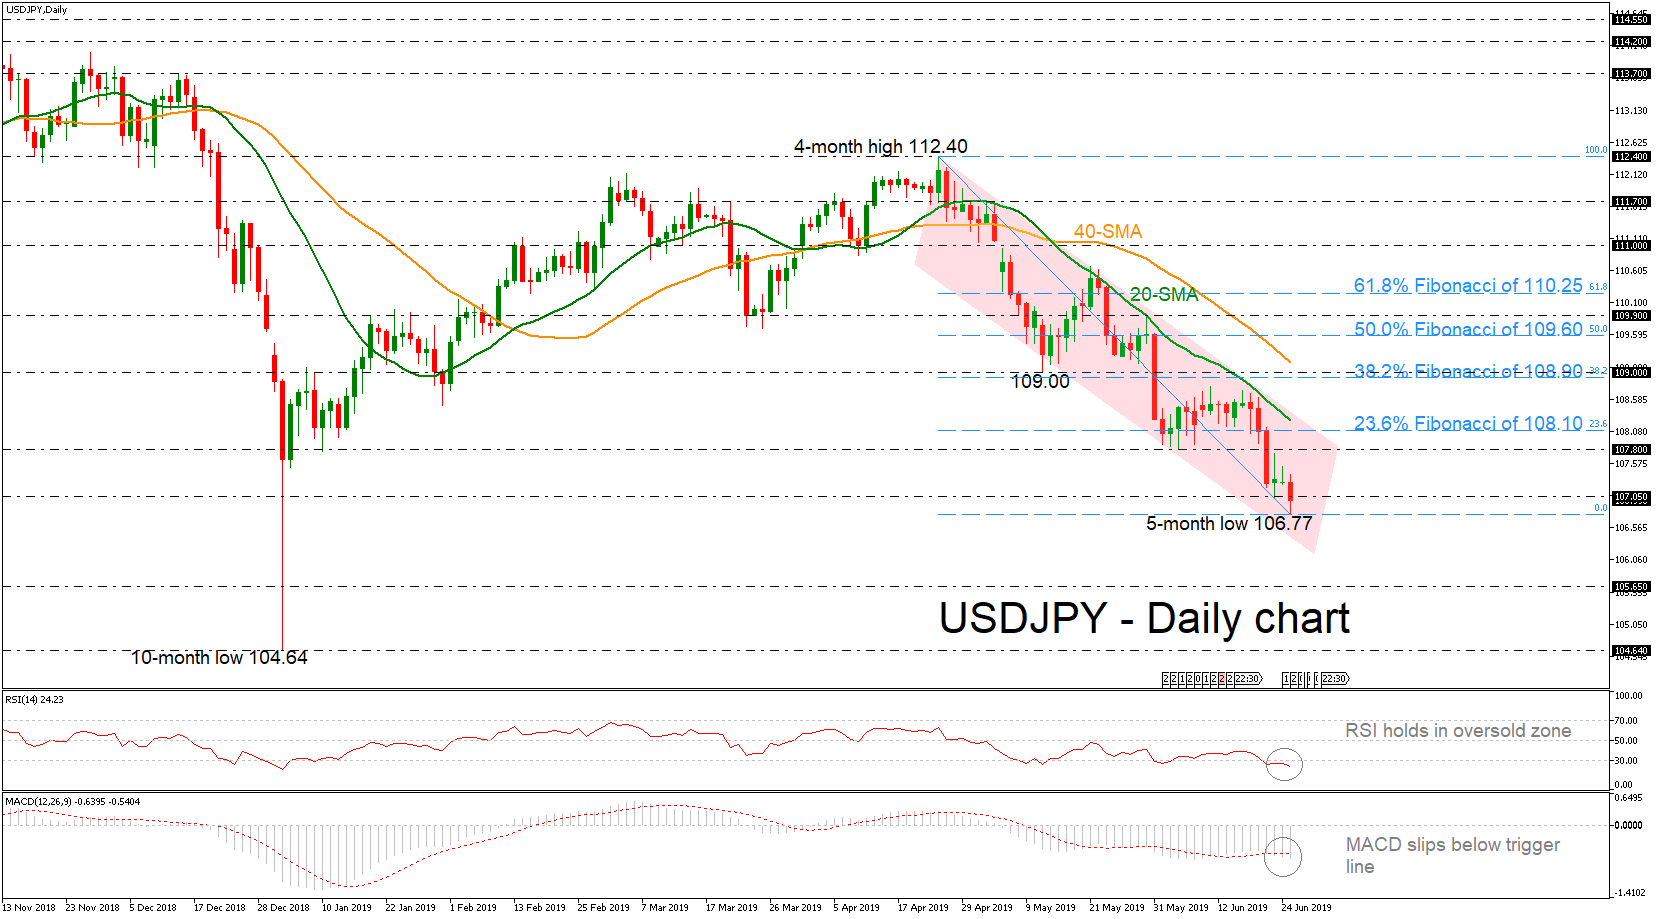
USDJPY is tumbling to a new five-month low near 106.77 today, struggling within the downward sloping channel. The RSI is trending south in the oversold zone, while the MACD is heading down below 0, posting a bearish cross with its trigger line. Both are signaling more losses in the daily timeframe.
If the price continues lower and drops beneath today’s low, this could open the door for the 105.65 support, taken from the bottom on April 2018. Even sharper losses would bring into range the ten-month low of 104.64.
Should the pair manage to return up it could open the way for the 107.80 resistance level, registered by the inside swing bottom on June 5. However, prices would need to climb as high as the 23.6% Fibonacci retracement level of the downleg from 112.40 to 106.77 near 108.10 and break the bearish pattern to the upside to turn the bias back to slightly bullish.
Concluding, in the short-term, the bearish phase remains in play especially as lonh as prices continue to trade below 109.00.
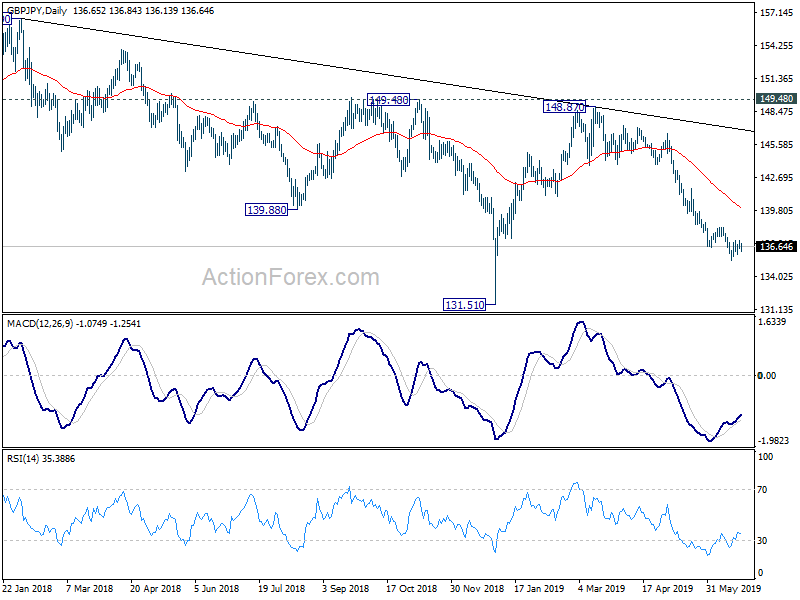
GBP/JPY Daily Outlook
Daily Pivots: (S1) 136.42; (P) 136.77; (R1) 137.05; More...
GBP/JPY is staying in consolidation from 135.38 and intraday bias remains neutral. In case of another rise, upside should be limited by 138.32 resistance to bring fall resumption. On the downside, break of 135.38 will extend recent fall from 148.87 to retest 131.51 low. Though, firm break of 135.38 will confirm short term bottoming and bring stronger rebound to 55 day EMA (now at 140.11).
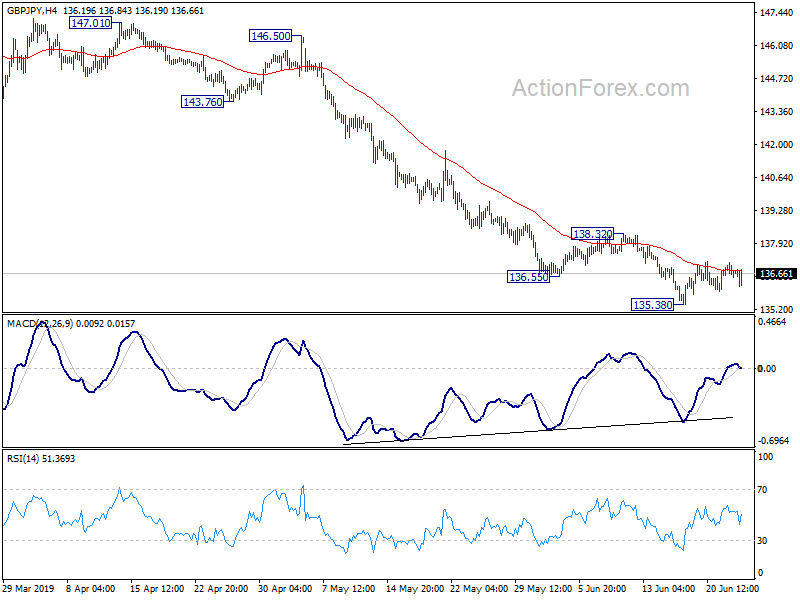
In the bigger picture, current development suggests that GBP/JPY's medium term fall from 156.59 (2018 high) is still in progress. Break of 131.51 will target 122.36 (2016 low). Structure of such decline is corrective looking so far, arguing that it's just the second leg of consolidation from 122.36. Thus, we'd expect strong support from 122.36 to contain downside to bring reversal.
EUR/JPY Daily Outlook
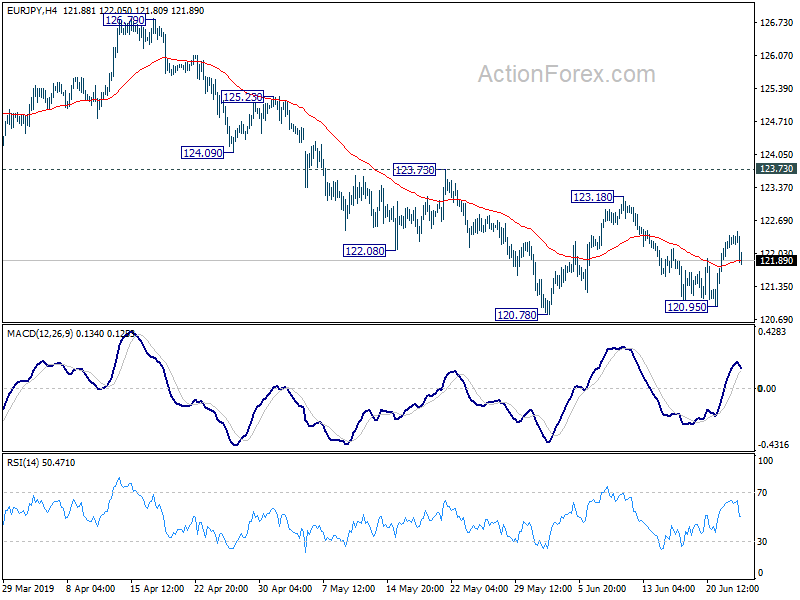
Daily Pivots: (S1) 122.07; (P) 122.23; (R1) 122.47; More....
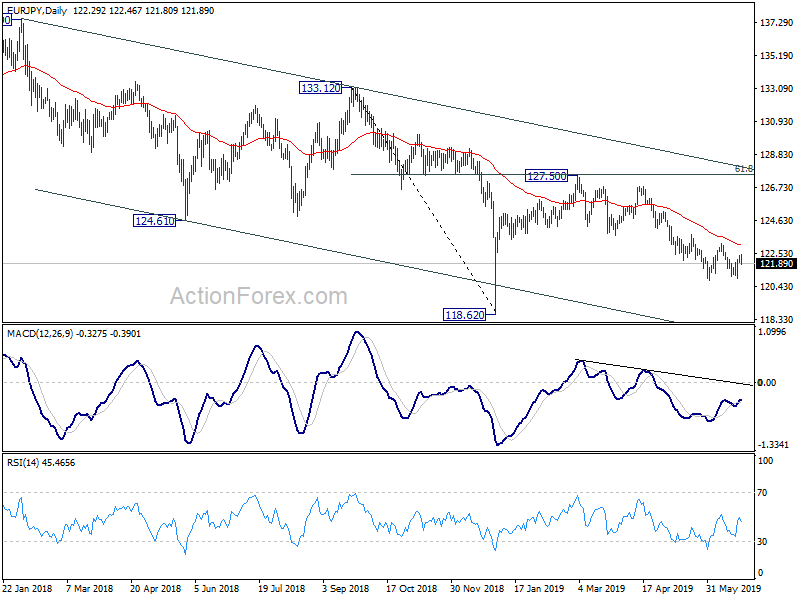
Intraday bias in EUR/JPY is turned neutral with current retreat. Overall, consolidation from 120.78 is still in progress and another rise cannot be ruled out. But upside should be limited below 123.73 resistance to bring fall resumption eventually. On the downside, firm break of 120.78 will resume the decline from 127.50 and target 118.62 low next.
In the bigger picture, down trend from 137.49 is still in progress with the cross staying inside long term falling channel. Break of 118.62 will extend the fall to 109.48 (2016 low). On the upside, break of 127.50 resistance is needed to be the first sign of medium term reversal. Otherwise, outlook will remain bearish in case of strong rebound.
EUR/GBP Daily Outlook
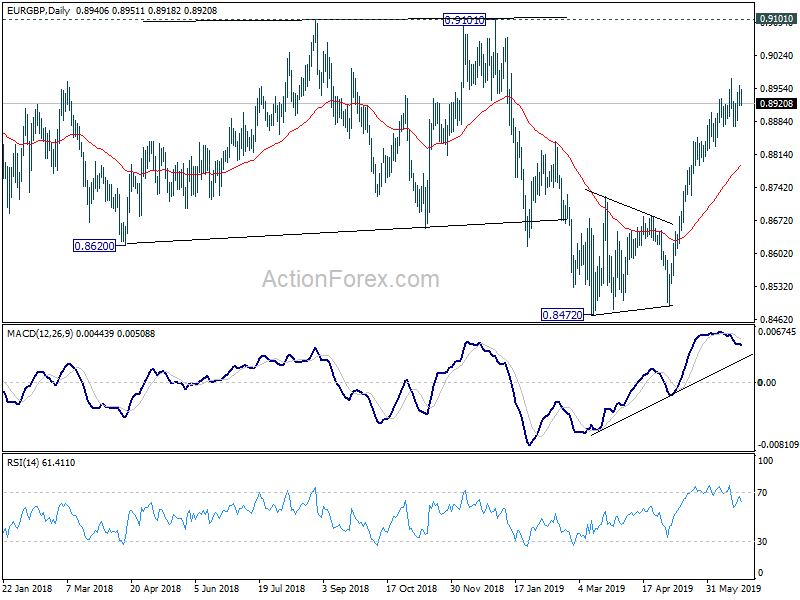
Daily Pivots: (S1) 0.8923; (P) 0.8943; (R1) 0.8966; More...
EUR/GBP is staying in consolidation from 0.8974 and intraday bias remains neutral first. With 0.8871 support intact, further rise is expected. On the upside, break of 0.8974 resistance will resume larger rally to 0.9101 key resistance next. However, considering bearish divergence condition in 4 hour MACD, break of 0.8871 will indicate short term topping. Deeper pull back could be seen to 55 day EMA (now at 0.8786).
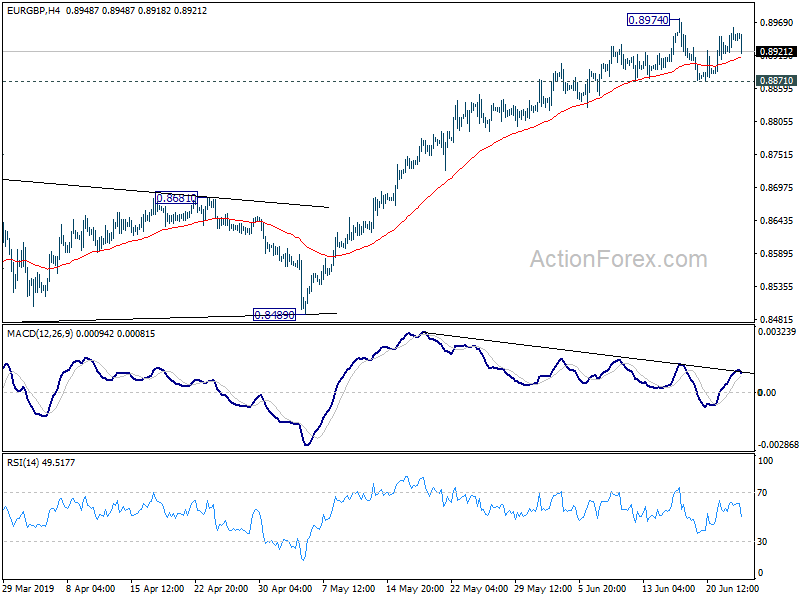
In the bigger picture, medium term decline from 0.9305 (2017 high) is seen as a corrective move. No change in this view. Current development argues that it might have completed with three waves down to 0.8472, just ahead of 38.2% retracement of 0.6935 (2015 low) to 0.9306 at 0.8400, after hitting 55 month EMA (now at 0.8527). Decisive break of 0.9101 resistance will confirm this bullish case. Nevertheless, as EUR/GBP is still staying inside long term falling channel, correction from 0.9305 could still extend to 0.8400 fibonacci level before completion, if upside is rejected by 0.9101.
Dollar And Stocks Edge Lower On G20 Doubts, Powell Speech Eyed
- Worries of no progress at Trump-Xi talks at G20 summit gives rise to risk aversion
- Iranian tensions also weigh on markets after US imposes new sanctions
- Dollar extends slide, while euro hits 3-month high above $1.14 level
- Fed in focus as Powell and others due to speak later in today
Trade concerns hit sentiment ahead of G20
The faint optimism that US President Trump and Chinese President Xi will be able to resolve some of their trade difference faded late on Monday after a senior US official revealed that Trump would be “comfortable with any outcome” from the talks scheduled at the G20 summit. US and Chinese trade officials agreed overnight to resume trade negotiations in preparation ahead of the high-stakes meeting, but this wasn't enough to lift sentiment.
It follows a much more positive tone over the weekend about the planned meeting between the two leaders and while the uncertainty about the prospect of a breakthrough at the June 28-29 summit dragged risk assets lower on Tuesday, investors are unlikely to take big positions until the talks have concluded.
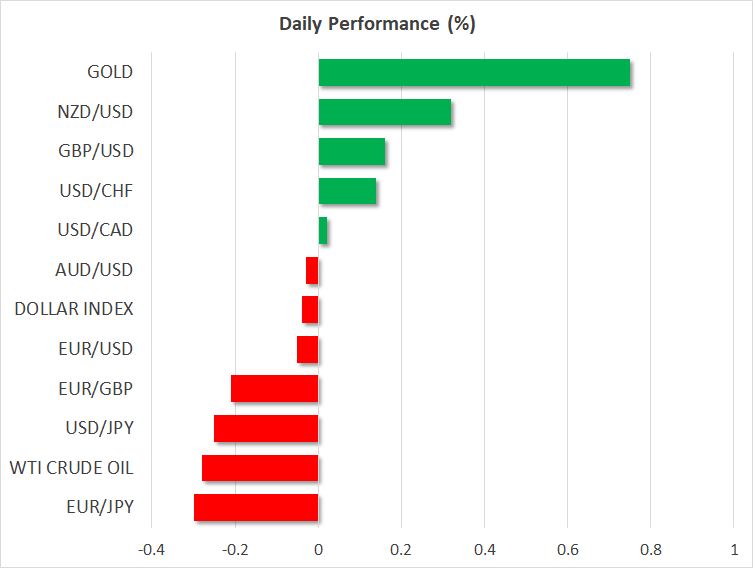
China's blue-chip CSI 300 index ended the day 0.9% lower today and US and European stock futures were pointing to losses of between 0.25% and 0.50%. The safe-have gold, meanwhile, which tends to benefit from risk aversion and geopolitical tensions, surged to a fresh six-year high of $1438.63 an ounce.
US announces new sanctions on Iran
Further supporting gold on Tuesday was the announcement by President Tump of new sanctions on Iran, which target key figures in the country, including Supreme Leader Ali Khamenei. The move, seen as largely symbolic due to the limited number of sanctions remaining that the US can still impose, threatens to escalate the situation even as the Trump administration attempts to push Iran to the negotiating table.
Aside from gold, the Japanese yen and the Swiss franc also gained on the increased risk-off mood, particularly against the US dollar, which is under pressure from burgeoning expectations that the Fed will cut rates at its July meeting. The greenback slipped below key levels, touching a 5½-month low of 106.77 versus the yen and a 9-month trough of 0.9691 against the franc.
The euro and pound also trampled on the weakening dollar, with the single currency flirting with the $1.14 handle at 3-month highs and sterling advancing towards the $1.2750 area. Although the outlook for the Eurozone and the UK is not much brighter than the US's, the ECB has limited scope to cut rates, while the Bank of England is maintaining its tightening bias, giving the currencies an edge over their US counterpart.
Fed rate cut bets intensify; Powell speech coming up
With US rate cut expectations running wild, investors will carefully be watching what Fed policymakers will signal from their scheduled speeches later today. A number of Fed officials will be hitting the podium, including Raphael Bostic (Atlanta Fed), James Bullard (St. Louis Fed) and John Williams (New York Fed). But the spotlight will be on the Fed Chairman, Jerome Powell, who's due to speak at 17:00 in New York.
Investors will be eagerly waiting for more hints from Powell & Co that rates could be cut as early as the July meeting. However, with traders possibly getting ahead of themselves as Fed funds futures are now indicating a 69% probability of a 50 basis points reduction in July, there's a growing risk that the Fed may not live up to the markets' expectations, opening the way for a major correction in the dollar and bond prices.
EUR/AUD Daily Outlook
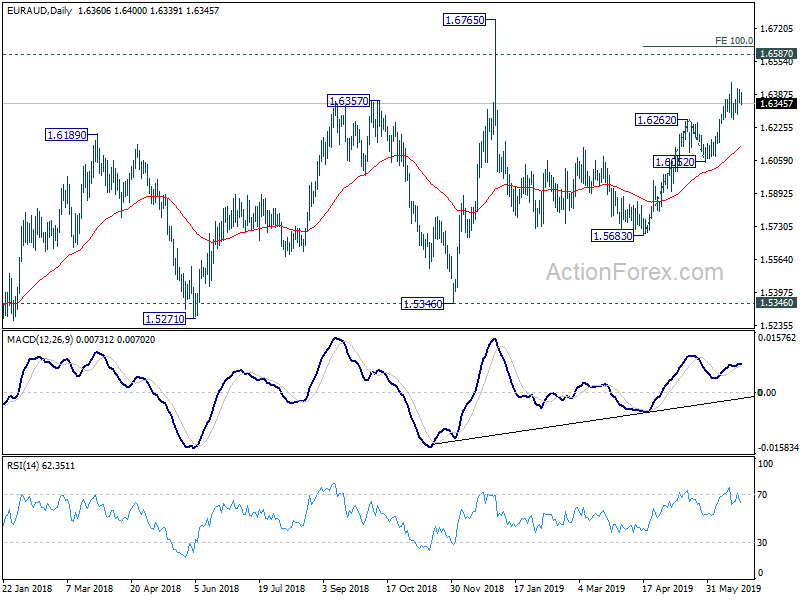
Daily Pivots: (S1) 1.6339; (P) 1.6376; (R1) 1.6406; More...
EUR/AUD is staying in consolidation from 1.6448 and intraday bias remains neutral for the moment. In case of another fall, downside should be contained above 1.6052 support to bring rise resumption. On the upside, break of 1.6448 will resume the rally from 1.5683 and target 100% projection of 1.5683 to 1.6262 from 1.6052 at 1.6631 next.
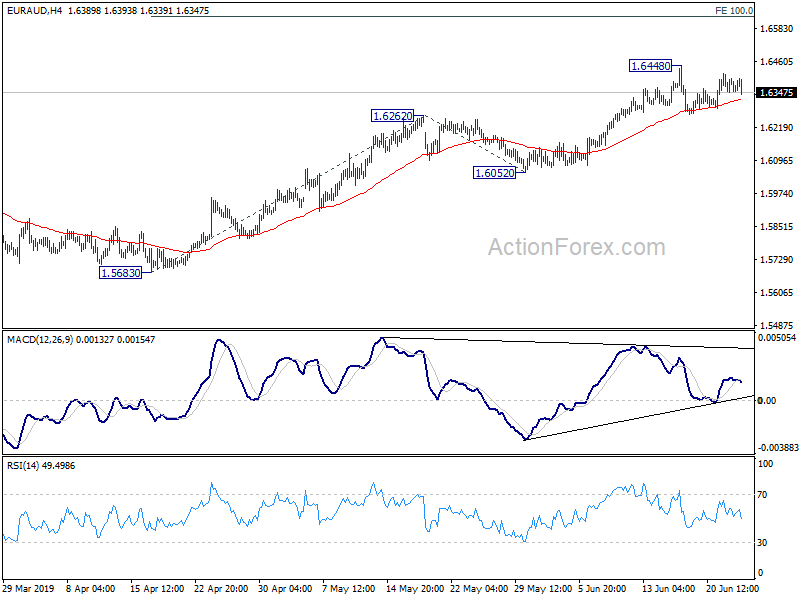
In the bigger picture, as long as 1.5346 support holds, outlook will still remain bullish. Up trend from 1.1602 (2012 low) is expected to resume sooner or later. Break of 1.6765 will target 61.8% retracement of 2.1127 (2008 high) to 1.1602 at 1.7488 next. However, firm break of 1.5346 key support will indicate trend reversal and turn outlook bearish.
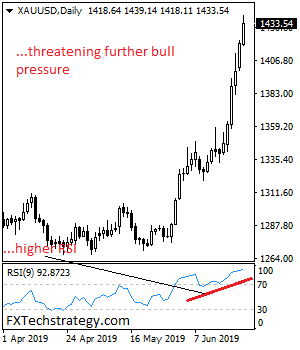
GOLD Bull Pressure Looks To Continue
GOLD bull pressure looks to continue following its recent strength. On the downside, support comes in at the 1,430.00 level where a break will turn attention to the 1,420.00 level. Further down, a cut through here will open the door for a move lower towards the 1,410.00 level. Below here if seen could trigger further downside pressure targeting the 1,400.00 level. Conversely, resistance resides at the 1,440.00 level. Further out, resistance resides at the 1,450.00 level where a break will aim at the 1,460.00 level. A turn above there will expose the 1,470.00 level. Further out, resistance stands at the 1,480.00 level. All in all, GOLD eyes further strengthen in the short term.