

Sample Category Title
Why Gold Price Can Touch $1,550
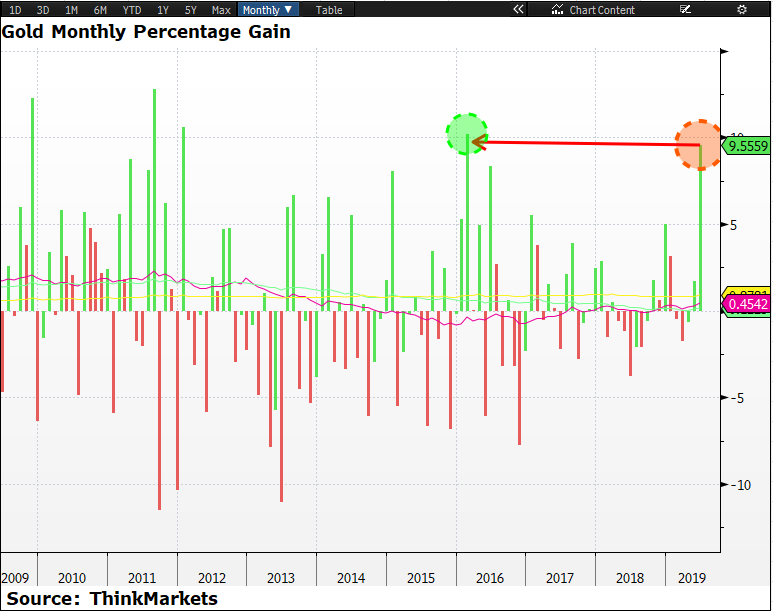
The shine is back for the precious metal which is trading up nearly 11.4 percent year to date. Most of these gains have occurred fairly recently, precisely speaking, the price started to rally on May 30th. Since then, the price is up nearly 12.87 percent. It is set to record the best monthly gain of 9.49 percent since February 2016.
- Feeble global economic growth
- Uncertainties due to geopolitics
- Massive change in the Feds monetary policy stance
Let's start with the monetary policy first, the dollar index is set to record the biggest monthly loss since 2018. The dollar index, DXY, is down nearly -1.85 percent this month, and this weakness in the in the dollar index has given birth to the bull rally for the shining metal. Investors have been largely worried that the US economy may fall into a recession and economic data started to support this argument to some extent. It was only fairly recently, when the Federal Reserve actually admitted that the trade war between the US and China has started to weigh on the economic health of the country. As a result, the Fed has decided that they need to move the needle on the monetary policy.
What is fairly priced into the market (with respect to the dollar index and the gold price) is that the Fed is going to cut the interest rate by 25 basis point. However, the speculators are not willing to believe this, in their opinion, the Fed is likely to cut the interest rate by at least 50 basis point. Four days ago, in our analysis, when the price was trading below $1350, we discussed that the price is likely to go above the level of $1,400 because of the change in the Fed's monetary policy stance. Since then the price has gained more than 7.29 percent and it is trading at $1,430.
Another reason for the gold price to move higher is the heightened geopolitical uncertainty in the Middle East. The recent conflict overshooting the US drone in Iranian territory, according to Iranian officials, has escalated the tensions between the US and Iran. for the first time, the trump administration has taken a more sensible approach and adopted the approach off sanctions rather than military actions on Iran. Nonetheless, it is not to say that this hasn't made the situation more complicated in the most sensitive area the world. Iran has said at the door is shut for any diplomatic path and this means the uncertainty well continue to rise. This is likely to keep pushing the gold price higher and it can easily cross the level of $1,500.
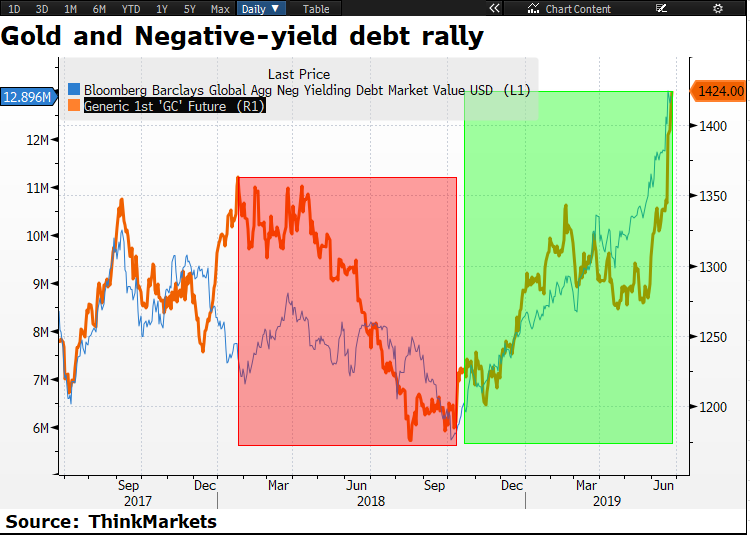
An important factor which investors should be paying attention to is the correlation between the gold price and the size of the negative-yield debt. The chart below shows that there is a strong correlation which means that the gold price rises as the size of the negative yield debt increases. This makes perfect sense, of course, no one likes to have negative yield debt. The safer bet is the shining metal. Given the current monetary policy adopted by the European Central Bank and the Federal Reserve bank, it is likely that the gold price may actually touch 1550 in the next few months.
However, it is important to keep in mind that the default numbers are still fairly under control or In other words, fairly low which means that the economic situation isn't really dire. Moreover, the earning season is also around the corner and any substantial weakness in the dollar index should help the corporate earnings unless the bigger picture makes it look dull.
To conclude, the upcoming G-20 meeting, the Fed's monetary policy, the trade war between the US and China and the heightened geopolitical uncertainty over in the Middle East may continue to support the price of gold. For the time being, the bias is skewed to the upside for the gold price
USD/CAD Analysis: Trading Flat
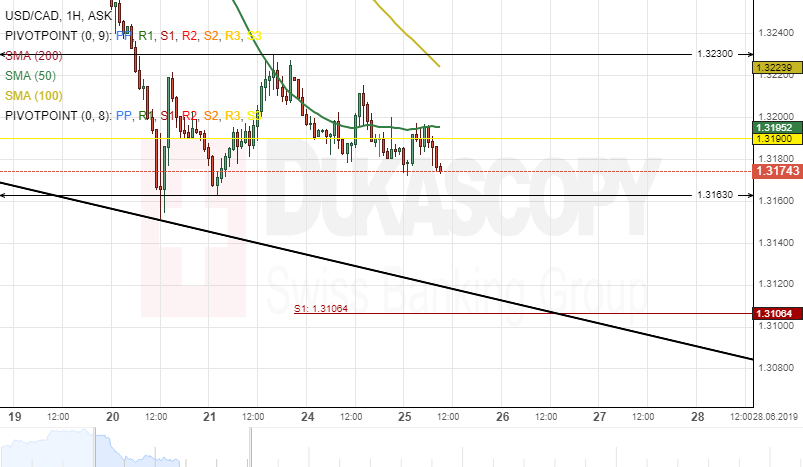
The US Dollar has been trading in a horizontal channel against the Canadian Dollar since June 20. The currency pair tested the upper boundary of the channel pattern at 1.3229 on Friday.
Everything being equal, it is likely that the USD/CAD exchange rate could maintain the horizontal channel pattern within this session. The pair is gradually moving towards the bottom border of the pattern.
Meanwhile, technical indicators demonstrate that a breakout through the lower boundary of the horizontal channel could occur during the following trading session.
NZD/USD Analysis: Might Retrace Down
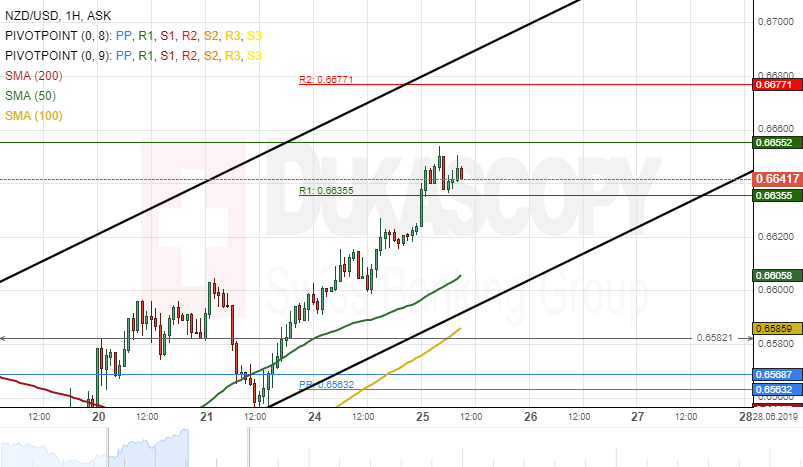
The New Zealand Dollar has appreciated about 95 base points against the US Dollar since June 21. The currency pair bounced off the lower boundary of an ascending channel pattern at 0.6563 on Friday.
The exchange rate breached a resistance level formed by the weekly R1 at 0.6640 during the first part of Tuesday's trading session.
As for the near future, it is likely that the NZD/USD pair could make a brief retracement towards the 50-hour simple moving average at 0.6602 during the following trading session.
If the support level formed by the 50-hour SMA holds, the pair will continue its upward swing in the short-term.
EUR/JPY Analysis: Breakout Occurs
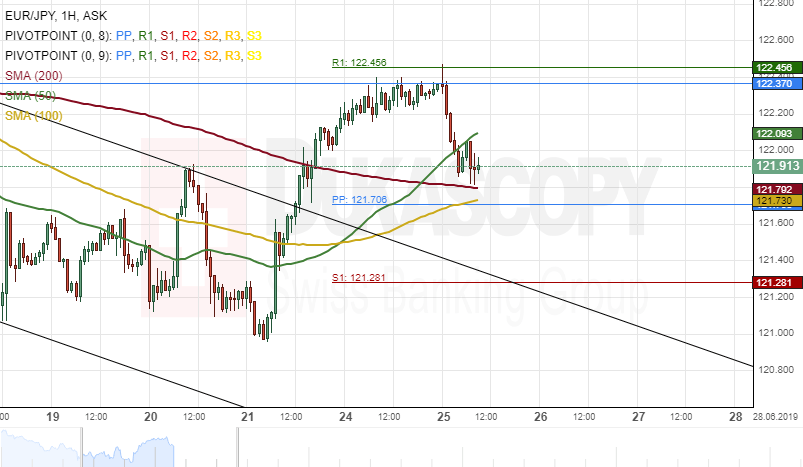
Upside risks have dominated the single European currency versus the Japanese Yen since June 21. A breakout occurred through the upper boundary of a descending channel pattern on Friday.
Everything being equal, it is likely that the EUR/JPY currency pair will edge lower today. The potential downside target will be near a support level formed by the 100-hour SMA at 121.60.
If this support level holds, the currency exchange rate will continue its upward swing during the following trading session.
AUD/USD Analysis: Consolidates Below 0.6968
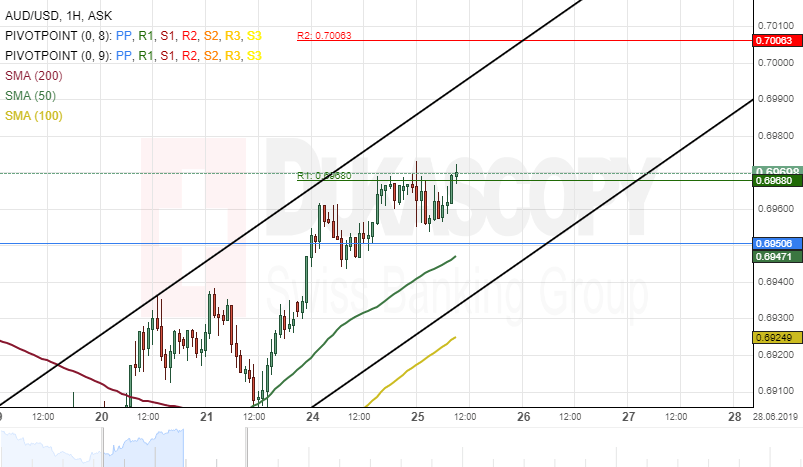
The Australian Dollar has appreciated about 65 base points against the US Dollar since June 21. The currency pair was guided higher by the 50-hour simple moving average.
The exchange rate was trading below a resistance level formed by the weekly R1 at 0.6968.
If this resistance level holds, the AUD/USD currency pair could edge lower within this session.
On the other hand, if the currency exchange rate passes the weekly R1, the next target for bullish traders will be at the upper boundary of an ascending channel at 0.70.
Markets Edge Lower As Investors Await G20 Meeting
Safe-Haven Asset Outperforming
German 10-year bond fell to -0.33% the lowest level ever recorded (US 10-yr has dropped below 2.0% again). With geopolitical tensions running high between the US / Iran and US / China, markets remain nervous. Asia stocks are lower and European indices feel shaky as U.S. President Donald Trump meets with Chinese President Xi Jinping this week. The event puts the risk of no-trade deal back in focus. Any sign of a de-escalation in the trade war will support another move higher in global equities. In longer-term, US data continues to weaken highlighted by a weak Dallas Fed Index. CHF and Gold are in the sweet spot further benefiting from historic safe-haven status. Our bullish scenarios for stocks revolve around an agreement at the G20 to restart trade negotiations.
Clearing this hurdle markets will focus back on loose policy that supports risk taking. In this environment, the SMI will continue to improve. In a historic event, the leading Swiss Market Index (SMI) broke through the 10’000 point mark for the first time. We suspect that a highly probable driver is expectations that the Swiss National Bank will further loosen its ultra-easy monetary policy.
In an unprecedented reversal, the Fed has gone from three hikes in 2019 to signaling interest rate cuts in July. The markets are now pricing in dovish action from the Bank of Japan and the Bank of England. But most critically for Switzerland, their closest neighbor, the European Central Bank, has now opened the door to deeper negative interest rates and setting additional unorthodox policies. Let’s not forget that the removal of the EUR/CHF minimal exchanges rate (i.e. the abrupt shift in SNB policy) was due to expectations that the ECB would take interest rates into negative territory.
Against a decent economic backdrop of forecast 2019 GDP growth of 1.6%-1.9%, and a lagging P/E ratio, we may be tempted to quote fundamentals as a rationale for the outperformance of Swiss stocks. However, we suspect yield-seeking behavior is the strongest momentum driver.
Within this context of global banks easing, pushing yields lower, and Swiss yields significantly negative for the foreseeable future, investors need to seek yields in stocks, as there is simply no other source for yields. The SMI has advanced 21% YTD, outpacing its European peer indices in the UK, Germany, Italy, and France. This is due to demand for dividend flows, with the added benefit of investing in safe-haven assets amid a trade war, with the likes of Nestle, Novartis, and Roche. With a dividend yield of 3.0%, Novartis looks attractive for risk-averse, yield-seeking players. There is the marginal risk of Swiss names being cut off from EU investors, but the risk is slim despite threats.
Bitcoin passes the $10,000 mark
Bitcoin’s price rose to a 15-month high during the European morning as it climbed towards the next key resistance that lies at $11,784 (high from February 21st 2018). Bitcoin showed impressive gains since the beginning of year, jumping from around $3,300 to more than $11,000. A performance of more than 230% in less than 6 months. Not bad for an asset that was doomed to die. Nevertheless, this amazing performance remains difficult to explain using a traditional approach based fundamentals. One can mention the geopolitical uncertainty, which has been mostly generated by Donald Trump, or the fact that central banks are slowly moving towards quantitative easing again. Indeed, the spread of dovishness among central bankers could be interpreted as a warning sign that a recession may be around the corner. The last explanation could be the announcement that Facebook is joining the crypto game with its cryptocurrency Libra. We doubt it is the main driver behind Bitcoin’s surge as it would mostly become a competitor. However, the Libra announcement definitely sends a clear signal that cryptocurrencies – or at least DLT – are here to stay.
As Bitcoin passed the $10,000 threshold, investors started calling for a bubble again and made apocalyptic predictions about crypto prices. Nevertheless, we believe that there is still room for further appreciation as the overall sentiment towards crypto is improving and more and more business are accepting Bitcoin as a mean of payment. Nevertheless, the rise was quite aggressive and a pause would be more than healthy in the short-term.
Italy Tria: 2.1% deficit represented a more than prudent fiscal policy
According to a prepared speech for delivery today, Italian Economy Minister Giovanni Tria said "for a zero growth economy like Italy" a 2.1% deficit represented "a more than prudent fiscal policy".
He added that the country is targeting to keep deficit low in the coming years. And the government will continue to lower its debt through reducing spending. Thus, "on this basis, we feel that Italy is substantially compliant with European fiscal rules." Tria is also confidence of reaching an agreement over its budget with the EU.
EU leaders are expected to approve the so-called Excessive Deficit Procedure on July 8-9 summit, which would lead to penalty to Italy over its budget. It's reported that European Commission would give Italy until January to make necessary budget corrections.
Geopolitical Risks Support The Demand For Safe Assets
The demand for safe assets is still at a fairly high level due to the US conflict with Iran. Yesterday, US President Donald Trump imposed sanctions against Iran's Supreme Leader Ayatollah Ali Khamenei. The President noted that the sanctions would also affect the Ayatollah's entourage. Donald Trump believes that the new sanctions will not allow Khamenei to use the American financial system. Trump also accused Khamenei of Iran's hostile behavior. The US president said the sanctions were "strong and proportionate response to Iran’s increasingly provocative actions."
In response, Iranian Foreign Ministry Spokesman Abbas Mousavi said that these sanctions signify the end of diplomatic relations between the US and Iran. He also noted that the Trump government was destroying all established international mechanisms for maintaining world peace and security. The US dollar index #DX closed in the negative zone (-0.24%).
Today, investors will assess a number of economic reports from the United States. So, CB consumer confidence index, as well as new home sales, will be published in the US. Financial market participants expect a meeting of the leaders of the US and China during the G20 summit, which will be held on June 28-29 in Osaka.
The "black gold" prices are consolidating after a sharp rise the day before. At the moment, futures for the WTI crude oil are testing the mark of $58.00 per barrel. At 23:30 (GMT+3:00) the API weekly crude oil stock will be published.
Market Indicators
- Yesterday, there was a variety of trends in the US stock market: #SPY (-0.12%), #DIA (+0.03%), #QQQ (-0.22%).
- The 10-year US government bonds yield is 2.02-2.03%.
The news feed on 2019.06.25:
- CB consumer confidence index in the US at 17:00 (GMT+3:00);
- New home sales in the US at 17:00 (GMT+3:00).
Forex Technical Analysis: EUR/USD, USD/JPY, GBP/USD
EUR/USD
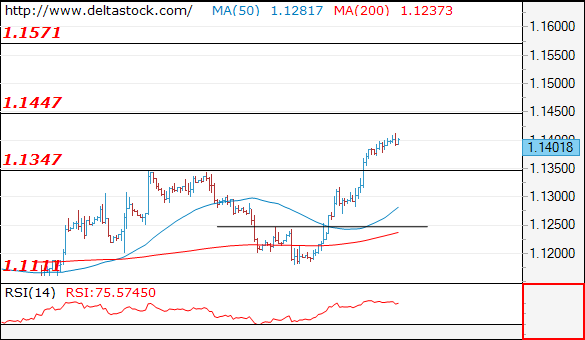
Current level - 1.1401
The outlook is still bullish, for a test of 1.1450 resistance and a violation of the mentioned one will target 1.1570. Key support lies at 1.1350.
| Resistance | Support | ||
| intraday | intraweek | intraday | intraweek |
| 1.1450 | 1.1570 | 1.1350 | 1.1110 |
| 1.1570 | 1.1820 | 1.1250 | 1.1010 |
USD/JPY
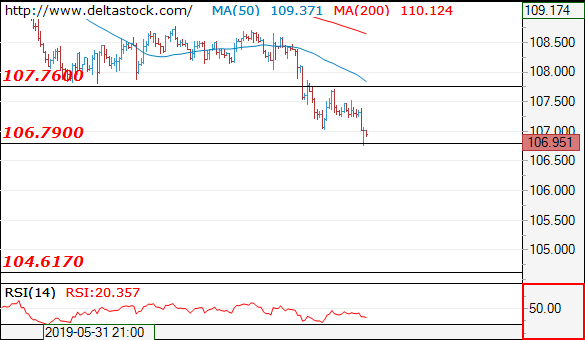
Current level - 106.95
The pair reached 106.70 static support and the overall bias is still bearish below 107.20 hurdle, so a clear break on the downside will challenge 104.60. There is no significant market support between 106.70 and 104.60.
| Resistance | Support | ||
| intraday | intraweek | intraday | intraweek |
| 107.20 | 109.90 | 106.70 | 106.70 |
| 108.70 | 112.40 | 106.70 | 104.50 |
GBP/USD
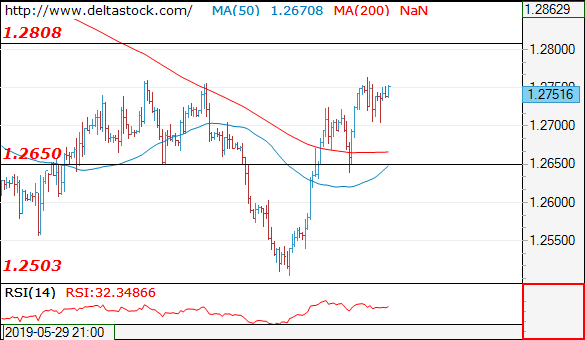
Current level - 1.2751
The uptrend is intact, heading towards 1.2810. Key intraday support lies at 1.2700.
| Resistance | Support | ||
| intraday | intraweek | intraday | intraweek |
| 1.2760 | 1.2890 | 1.2700 | 1.2503 |
| 1.2810 | 1.3170 | 1.2650 | 1.2420 |
Stocks Steady As Gold And Bitcoin Soar
Stock markets are trading slightly in the red on Tuesday but we're not seeing any moves of real substance, as traders continue to focus on events later in the week.
It's never ideal when the headline act is so late in the week as we can often spend the rest of it sitting idly by trying to feign interest in the supporting cast. Barring another flare up in the Gulf of Oman or another unexpected event, that is always how this week was likely to pan out and so far, that's exactly what we're seeing.
It doesn't help that this G20 meeting has the potential to be a game changer. Clearly investors expectations are either quite low or they just don't think it makes any difference to what interest rates will do on the back of it. As it stands, a US interest rate cut is 100% priced in for July, with markets pricing a 38% chance that it's 50 basis points. Moreover, three rate cuts is more than 70% priced in by year-end.
Should Trump and Xi surprise us all and find a compromise that both accelerates negotiations and averts the need for further tariffs in Osaka, I would be very surprised if these odds don't change significantly. They seem far too pessimistic based on inflation and a slight weakening in the data, alone. I can't imagine the consumer confidence or manufacturing data will change anything, although Powell and Bullard's speeches later on may be interesting, especially if they signal that markets have gone too far.
Commodity markets keeping us entertained
We may be in pause mode when it comes to stock markets, after they hit new records last week but thankfully, commodity markets are providing plenty of interest. The oil rally has stalled a little, with WTI running into some resistance around $58 but we're hardly seeing the sellers coming in and taking charge.
That said, if momentum starts to lag then that could make $59-60 an even tougher resistance for it to overcome without potentially seeing some profit taking or a correction first. Naturally, that may change very quickly in the event of another escalation in the Gulf which, given the events of recent weeks, seems a high risk.
No stopping Gold it seems
Gold is flying once again as it looks to extend its winning streak to six days and build on the almost 7% gains it's made in that time. All you have to do is look at a US dollar chart to see what the trigger for the surge has been. Previously when we've traded around these levels - and for that we're talking earlier this decade - $1,440 has been a notable area of support and resistance which may explain why we've seen some profit taking around here today.
What's interesting is that we the rally doesn't seem to be dropping any momentum so there may be some more room to run. Above here, $1,470-1,480 was also interesting previously so perhaps we're entering into a crowded area where momentum may start to slip.
Bitcoin making a comeback
Bitcoin is on the rise again on Tuesday, breaking back above $11,000 is hitting new highs for the year as it continues it's remarkable comeback. Bitcoin is now up around 50% from its lows earlier this month and if history is anything to go by, there's no reason why it can't continue to march higher from here.
Facebook certainly looks to have done cryptocurrencies a massive favour which may make you question whether the rally is built on any kind of solid foundations. That said, I'm sure many in the community would argue that a lot of positive progress has been made over the last 18 months which has been overlooked and is now paying dividends as the Libra announcement draws attention back to the space. Where it goes from here is anyone's guess and I'm sure we're going to start seeing some extremely bold predictions in both directions over the coming weeks.