Sample Category Title
EUR/CHF Daily Outlook
Daily Pivots: (S1) 1.1053; (P) 1.1092; (R1) 1.1119; More...
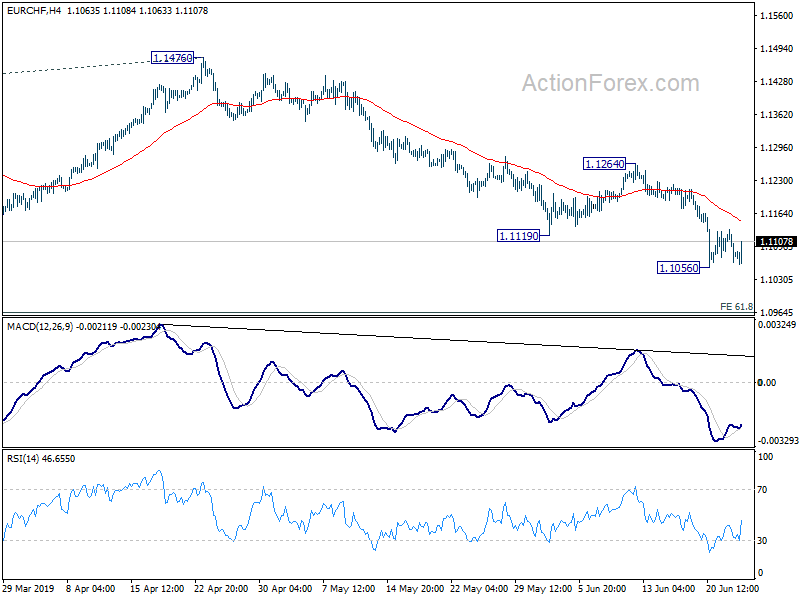
Intraday bias in EUR/CHF remains neutral as consolidation from 1.1056 is still in progress. In case of stronger recovery, upside should be limited below 1.1264 resistance to bring further decline. On the downside, break of 1.1056 will resume the larger down trend for 61.8% projection of 1.2004 to 1.1173 from 1.1476 at 1.0962 next.
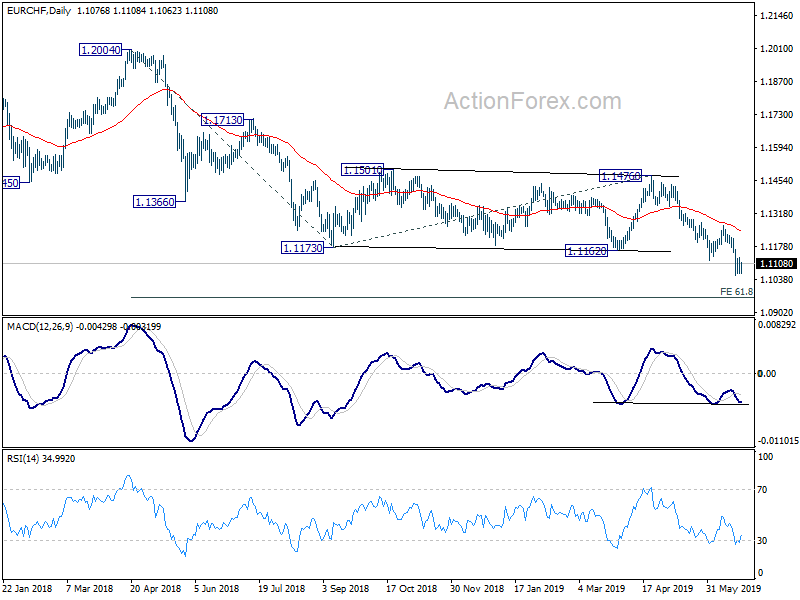
In the bigger picture, current development firstly suggests that down trend from 1.2004 is still in progress. More importantly, it's likely a long term down trend itself, rather than a correction. Outlook will remain bearish as long as 1.1476 resistance holds. EUR/CHF could target 1.0629 support and below.
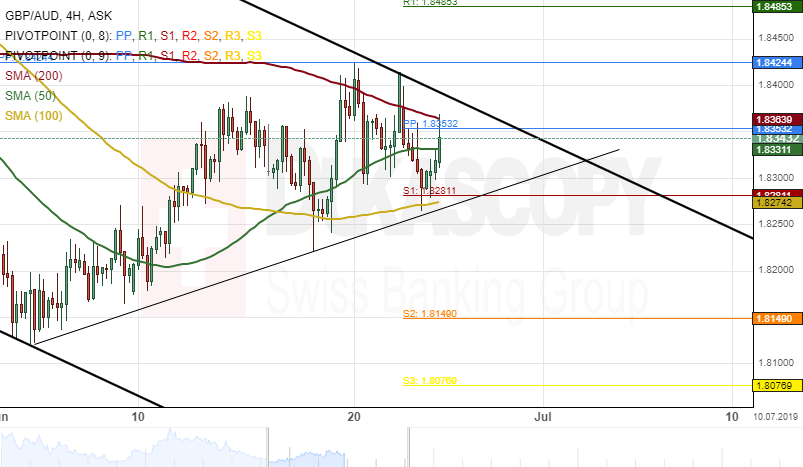
GBP/AUD 4H Chart: Stranded Between SMAs
The GBP/AUD currency pair made about 200 base points movement during last week's trading sessions. The monthly pivot point at 1.8424 provided resistance for the exchange rate.
Currently, the Pound Sterling versus the Australian Dollar is stranded between SMAs.
Technical indicators suggest that the currency exchange rate might continue its downward movement during the following trading sessions.
However, a support cluster formed by the weekly S1 and the 100-hour SMA at 1.8272 could help push the pair higher in the short-term.
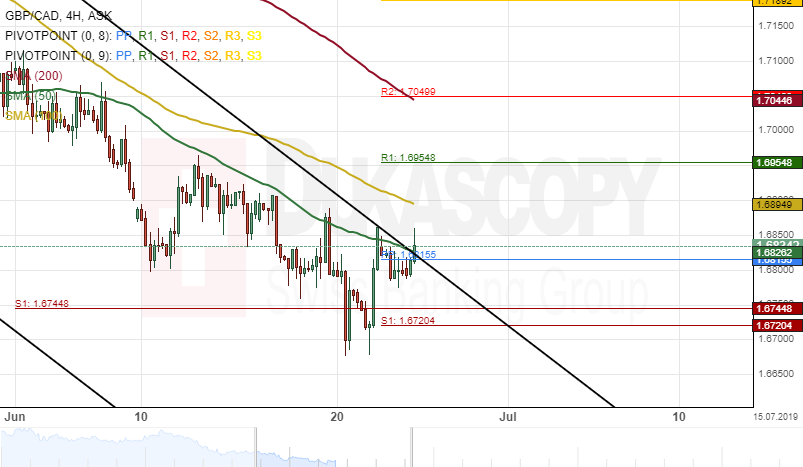
GBP/CAD 4H Chart: Tests 50-Hour SMA
The British Pound has continued its decline against the Canadian Dollar during the past week. The currency pair was pressured down by the 50-hour simple moving average.
The exchange rate was trading near the upper boundary of a descending channel pattern at 1.6828 during the morning hours of Tuesday's trading session and could be set for a breakout.
However, a resistance level formed by the 50-hour SMA at 1.6828 could restrict bullish traders from pushing the currency exchange rate higher during the following trading sessions.
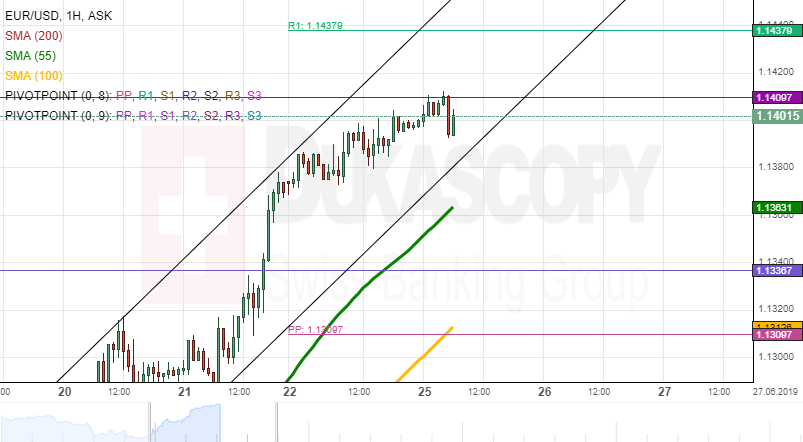
EUR/USD Anaysis: Reaches Target
The EUR/USD has reached the previously set target. The monthly pivot point at 1.1410 has been reached on Tuesday morning.
In regards to the near term future, the pair is expected to trade sideways below the resistance until the 55-hour simple moving average approaches the pair from below. In addition, the pair will find support in the lower trend line of the ascending pattern that represents the Federal Reserve's causes surge.
On the other hand, information that would reveal upcoming increase of the US Dollar's supply could cause a break of the monthly pivot point. In this case the rate would aim at the weekly R1 at 1.1438.
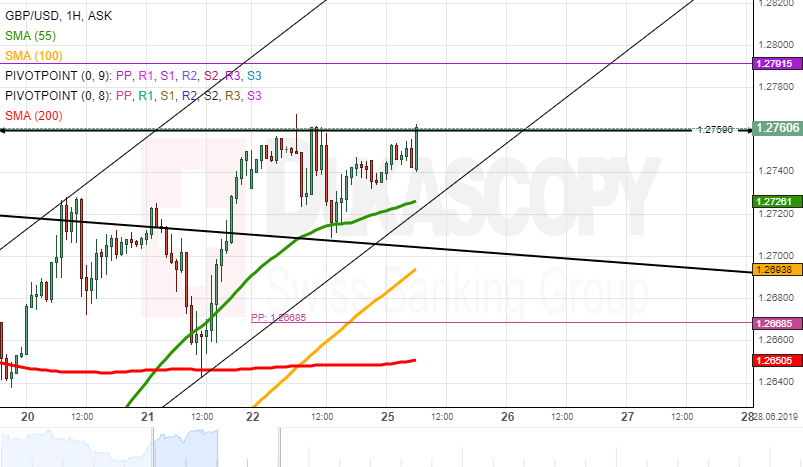
GBP/USD Analysis: Remains Below 1.2760
On Tuesday morning, the GBP/USD continued to test the resistance of the 1.2760 level. Meanwhile, note that the rate had retraced down to the 55-hour SMA, where it found support for the most recent surge.
In general, the rate is expected to pass the 1.2760 level, as soon as the lower trend line of the junior ascending channel pattern is reached. This event most likely will be consistent with another approach of the support of the 55-hour simple moving average.
On the other hand, if the support levels fail, the rate will have only the support of the 100-hour SMA, which on Tuesday was located at the 1.2694 level.
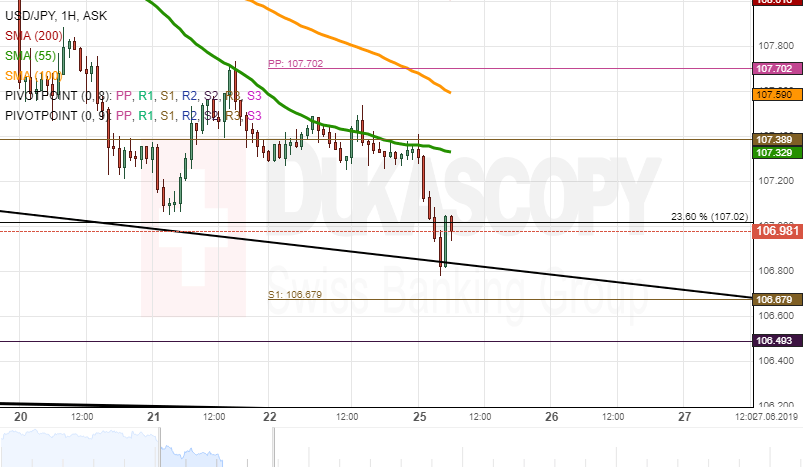
USD/JPY Analysis: Drops Below 107.00
The USD/JPY has dropped below the 107.00 level. On Tuesday morning, the drop was stopped by the lower trend line of a large scale descending channel pattern at 106.80.
The currency pair was expected to trade sideways until the resistance of the 55-hour simple moving average declines. The 55-hour SMA, was the technical level, which previously pushed the rate down and was also the cause for the Monday's sharp drop.
On the other hand, the rate could even surge above the 107.00 level and approach the SMA on its own, without trading sideways and waiting for the moving average to move down.
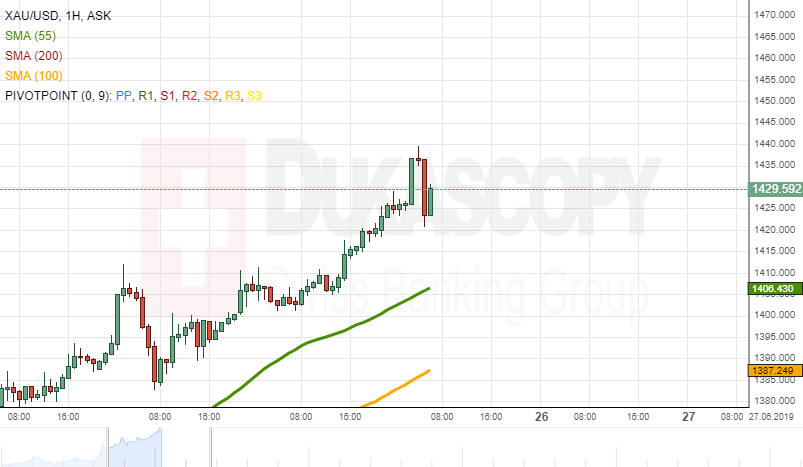
Gold Analysis: Reaches 1,440.00
Gold has reached a new high level. On Tuesday morning, the bullion tested the resistance of the 1,440.00 level.
It can be observed that the surge is occurring together with the 55-hour SMA below the commodity price. From a technical analysis perspective this is the only close by level. It indicates that the metal is not massively overbought, as the surge has happened somewhat gradually.
On the other hand, take into account that the surge is a run to safety caused by fundamental monetary policy of the US Federal Reserve.
USD/CAD Daily Outlook
Daily Pivots: (S1) 1.3166; (P) 1.3191; (R1) 1.3206; More...
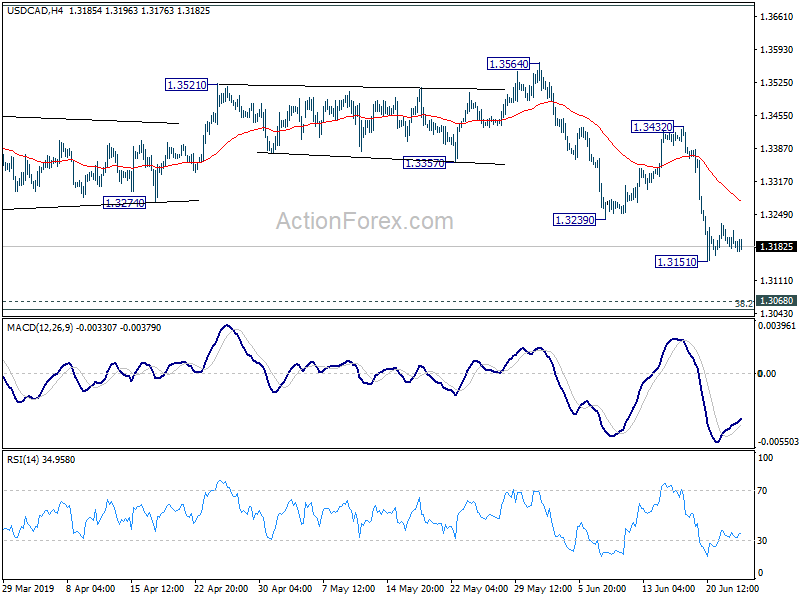
USD/CAD's consolidation from 1.3151 is still in progress and intraday bias remains neutral first. Upside of recovery should be limited well below 1.3432 resistance to bring fall resumption. On the downside, break of 1.3151 will extend the fall from 1.3564 to target 1.3052/68 cluster support.
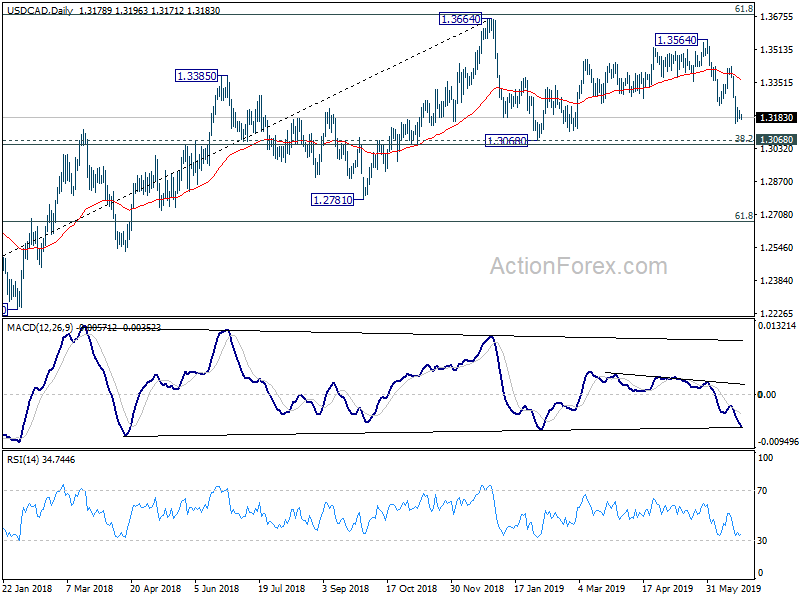
In the bigger picture, medium term outlook stays neutral for now even though the case of bearish reversal is building up. Decisive break of 1.3068 cluster support (38.2% retracement of 1.2061 to 1.3664 at 1.3052) will confirm completion of up trend from 1.2061 (2017 low). Further fall should be seen to 61.8% retracement at 1.2673 next. On the upside, sustained break of 61.8% retracement of 1.4689 (2016 high) to 1.2061 at 1.3685, is needed to confirm resumption of up trend from 1.2061 (2017 low). Otherwise, risk will stay on the downside.
Crude Oil Choppy
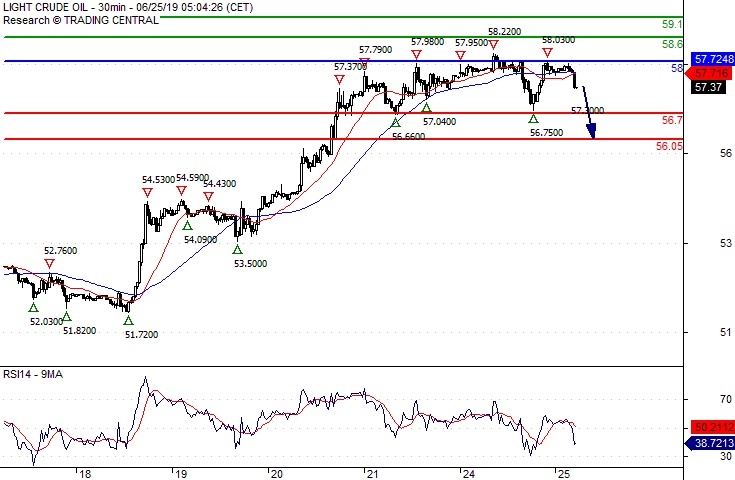
Pivot (invalidation): 58.00
Our preference Short positions below 58.00 with targets at 56.70 & 56.05 in extension.
Alternative scenario Above 58.00 look for further upside with 58.60 & 59.10 as targets.
Comment The RSI is mixed to bearish.
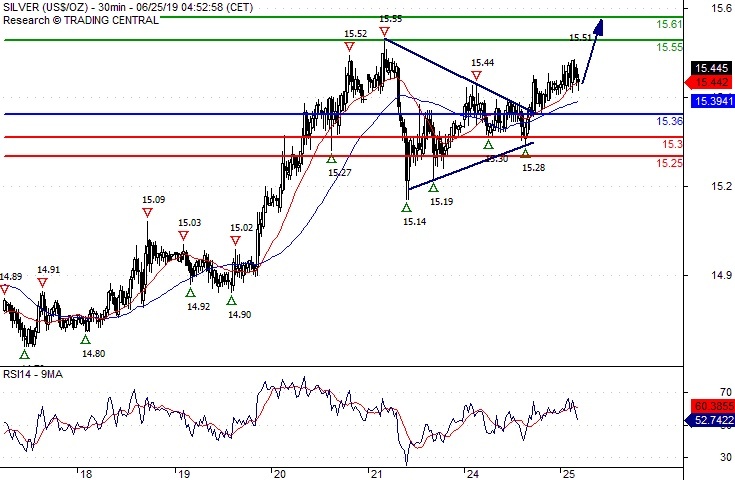
Silver Spot Bullish Bias Above 15.3600
Pivot (invalidation): 15.3600
Our preference Long positions above 15.3600 with targets at 15.5500 & 15.6100 in extension.
Alternative scenario Below 15.3600 look for further downside with 15.3000 & 15.2500 as targets.
Comment The RSI is mixed to bullish.