Sample Category Title
GBP/USD Daily Outlook
Daily Pivots: (S1) 1.2639; (P) 1.2699; (R1) 1.2746; More....
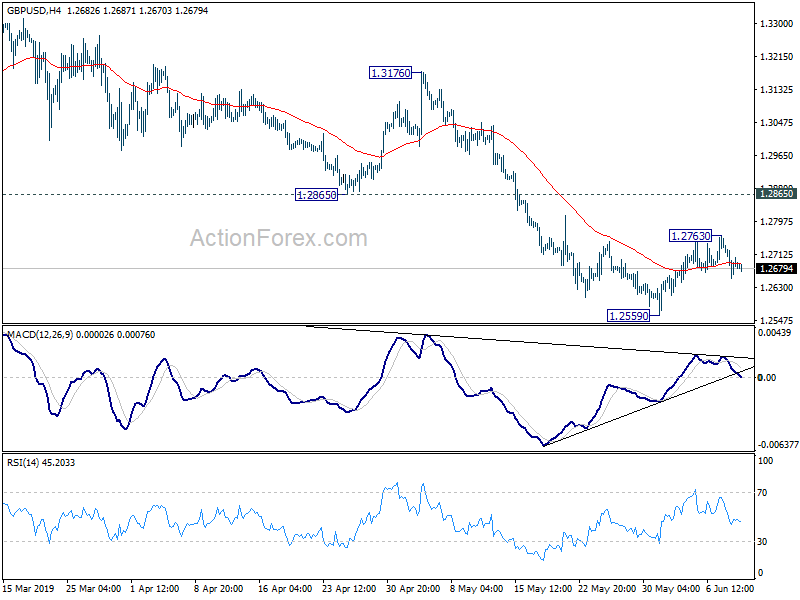
Intraday bias in GBP/USD remains mildly on the downside at this point. Recovery from 1.2559 could have completed at 1.2763 and deeper fall should be seen to retest 1.2559. Break will extend the decline from 1.3381 for 1.2391 low first. On the upside, in case of another rise, upside should be limited by by 1.2865 support turned resistance to bring fall resumption eventually.
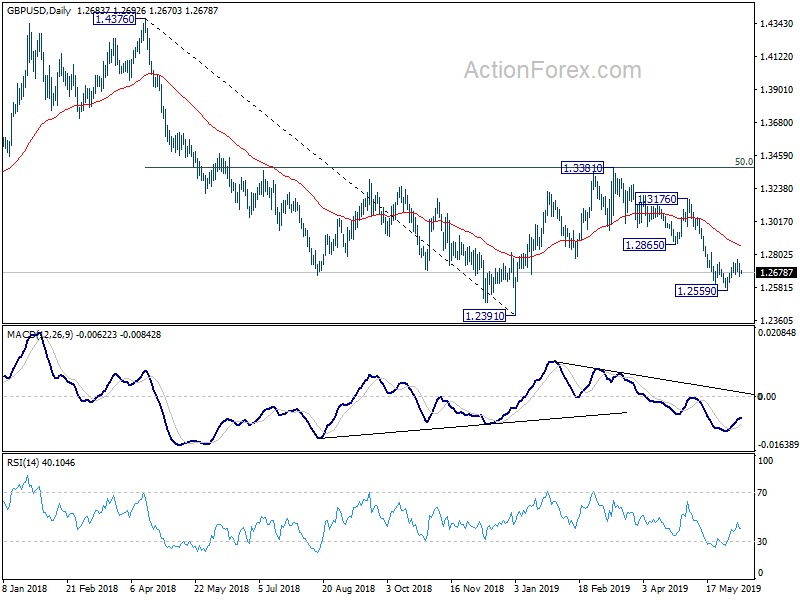
In the bigger picture, medium term decline from 1.4376 (2018 high) is possibly ready to resume. Decisive break of 1.2391 would target a test on 1.1946 long term bottom (2016 low). For now, we don't expect a firm break there yet. Hence focus will be on bottoming signal as it approaches 1.1946. In any case, medium term outlook will stay bearish as long as 1.3381 resistance holds, in case of strong rebound.
USD/CHF Daily Outlook
Daily Pivots: (S1) 0.9883; (P) 0.9902; (R1) 0.9919; More...
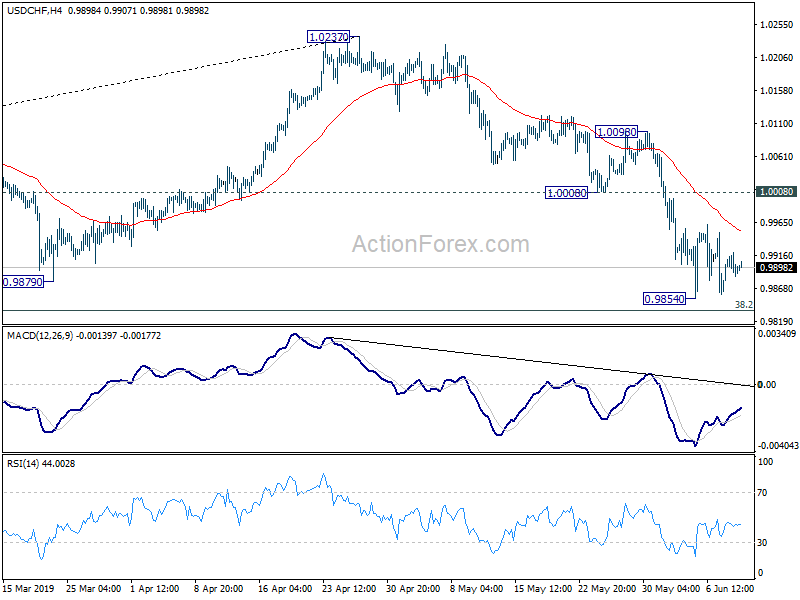
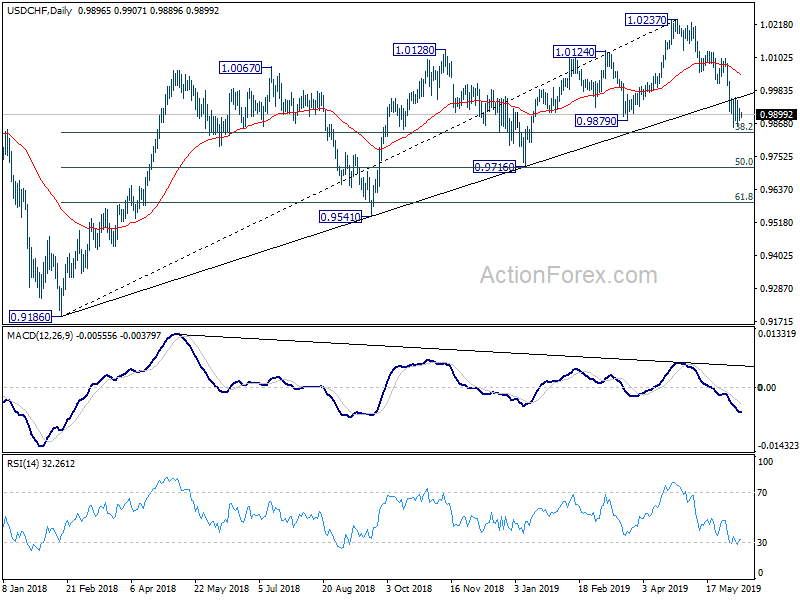
Intraday bias in USD/CHF remains neutral and consolidation from 0.9854 might extend. Another recovery could be seen but upside should be limited by 1.0008 support turned resistance and bring fall resumption. On the downside, break of 0.9854 will extend the decline from 1.0237 to 0.9716 cluster support (50% retracement of 0.9186 to 1.0237 at 0.9712).
In the bigger picture, USD/CHF's break of long term trend line support is the first indication of medium term reversal. Focus is now back on 0.9879 support. Sustained break should confirm that medium term up trend from 0.9186 has completed at 1.0237 already. Further fall should be seen to 0.9716 cluster support (50% retracement of 0.9186 to 1.0237 at 0.9712) next. Break will target 61.8% retracement at 0.9587.
Stocks Fight For Gains After May’s Losses While Dollar Waits For Fresh Catalyst
Asian stocks advanced on Tuesday, while US and European equities are poised for more gains, even as heightened trade tensions and persistent concerns over global growth test risk sentiment.
Global equity bulls seem unfazed by US President Donald Trump threatening the possibility of heightened tariffs on Chinese imports, should his meeting with President Xi Jinping fail to materialize at the G20 summit later this month.
The unrelenting pursuit for more gains seen in equity markets suggests that traders may be sharing Trump's optimism over the prospects of a US-China trade deal happening by end-June.It remains to be seen whether the latest trade-related rhetoric from the Trump administration will prove to be another disappointment, as markets have grown accustomed to, or whether risk appetite will hold up.
Market sentiment is likely to remain highly sensitive to trade-related developments, concerns over deteriorating global economic growth, as well as the likelihood of a Fed rate cut, which could ramp up market volatility in the interim leading up to the G20 event risk.
Safe haven assets in wait-and-see mode
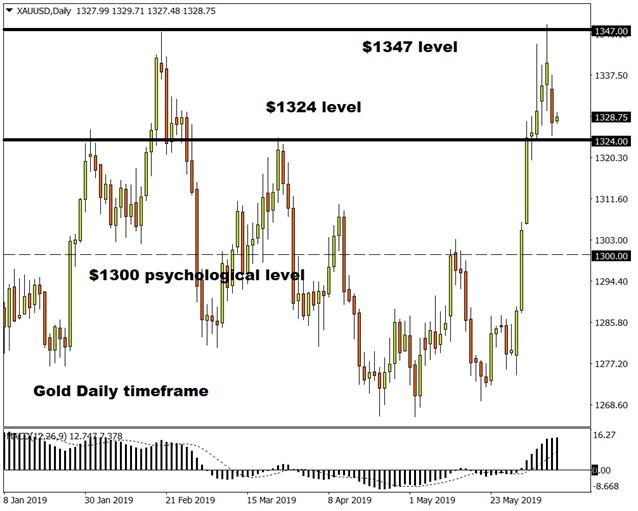
Safe haven assets are holding steady, with Gold trading below the $1330 level, while the Japanese Yen is trading within the 108 band against the US Dollar.
Safe havens appear intent on holding onto recent gains, at least until the coast is clear from downside risks to the global economy, although such a risk-on outlook seems highly unjustifiable at this point in time. Rising expectations of a formalized US-China trade deal occurring this month could chip away at the gains enjoyed by safe haven assets since lateMay, although the ensuing losses may be mitigated by concerns over the economic damage already inflicted by heightened US-China trade tensions.
Looking at the technical picture, Gold seems to be on standby on the daily charts with prices trading above the $1324 support level as of writing. Should $1324 prove to be reliable support, the precious metal has scope to rebound towards levels not seen in 14 months, above $1347.
Dollar Index awaits potential US inflation catalyst
With Dollar traders having moved past the disappointing headlines out of May's US jobs report, the next near-term catalyst for the Greenback could arrive on Wednesday morning, with the release of last month's Consumer Price Index.
Should the May inflation data continue to keep its distance from the Fed's two percent target, the calls for US monetary policy easing could grow louder, with markets already expecting a Fed rate cut to be a near-certainty this year. As long as the chances of a Fed rate cut remain on the table, that creates a suppressive environment for the US Dollar, which in turn should allow for some breathing space for global currencies.
USD/JPY Daily Outlook
Daily Pivots: (S1) 108.28; (P) 108.50; (R1) 108.67; More...
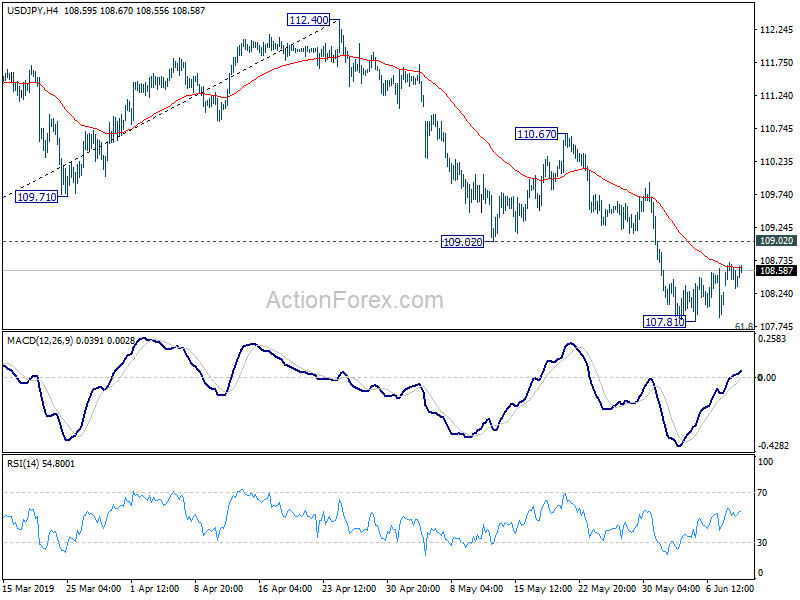
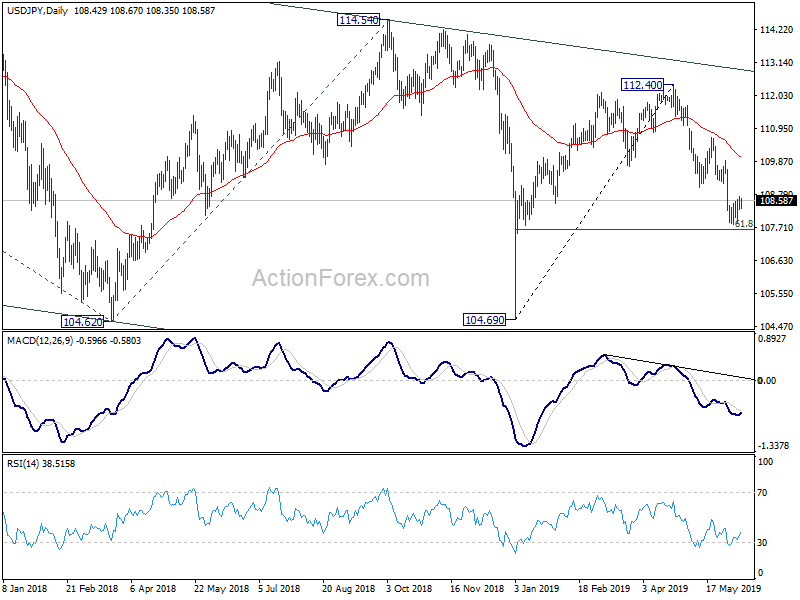
Intraday bias in USD/JPY remains neutral and consolidation from 107.81 temporary low might extend further. Upside of recovery should be limited by 109.02 support turned resistance to bring fall resumption. On the downside, sustained break of 61.8% retracement of 104.69 to 112.40 at 107.63 will pave the way back to 104.62/9 key support zone. Though, break of 109.02 support turned resistance will indicate short term bottoming and bring lengthier consolidations first.
In the bigger picture, decline from 118.65 (Dec 2016) is still in progress, with the pair staying indicate long term falling channel. Break of 104.62 will target 100% projection of 118.65 to 104.62 from 114.54 at 100.51. For now, we'd expect strong support above 98.97 (2016 low) to contain downside to bring rebound.
DAX30 Bullish Fifth Wave Aims At 13k Target
A bullish continuation on the DAX 30 index could confirm the expected wave 5 (purple), which could be part of a larger wave A for instance. For the moment, the most important wave outlook however is the expected wave 4-5 (purple). The is wave pattern is unlikely if price breaks below the 50% Fib, which in that case makes a bullish ABC wave pattern (not 123) the most likely scenario.
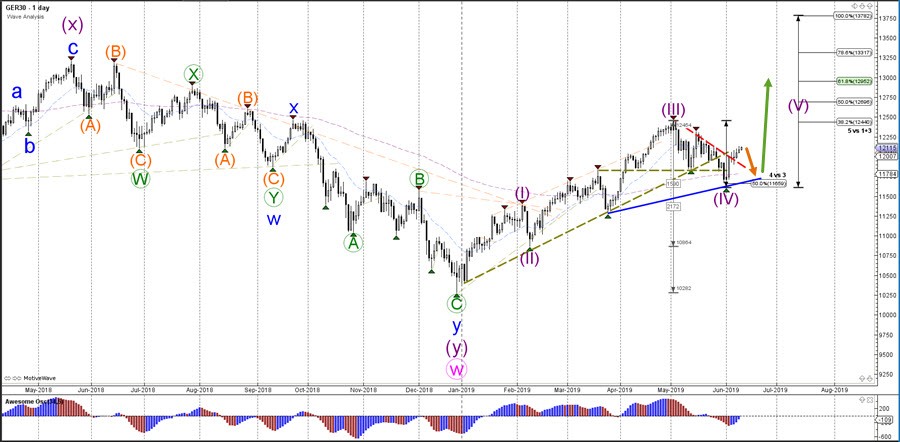
The DAX 30 index seems to be completing 5 waves (green) which could belong to a wave 1 (blue) of wave 5 (purple). A break below the support trend line (blue) would confirm the end of the bullish swing and the potential start of a corrective bearish swing as part of wave 2 (blue). The wave 1-2 pattern is valid as long as price stays above the 100% Fibonacci level of wave 2 vs 1.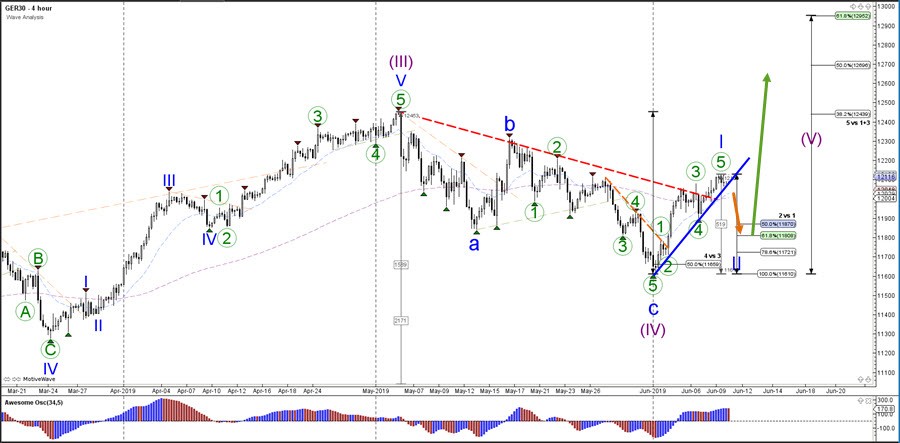
Gold Slips As Risk Appetite Returns
Gold prices were seen trading lower as investor’s risk appetite returned. The prospects of a possible rate cut by the Fed sometime this year led equity markets higher. At the same time, lack of any new developments from the US and China trade talks also helped sentiment. With the US now pulling back on its trade threats to Mexico, the global uncertainty is seen to be somewhat stable.
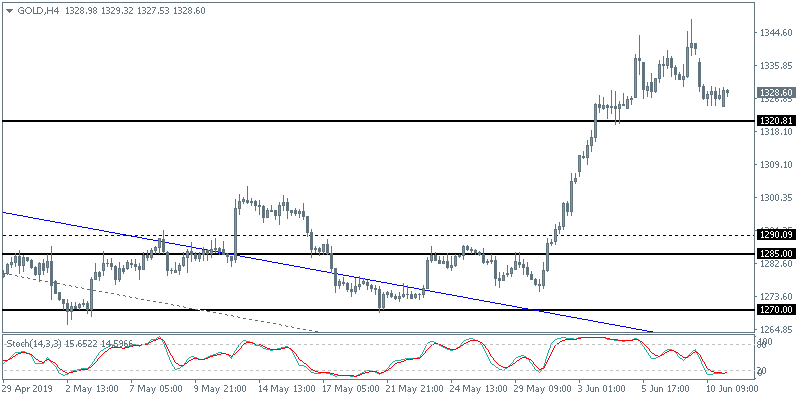
XAUUSD on Track to Test the Support
The precious metal was seen giving up most of the gains on Monday. Price gapped lower on the open and continued to extend declines through the day. This puts price action in gold within reach to test the 1320 level of support. Establishing support at this level could however keep the medium-term bias to the upside. A close below 1320 could, however, spell further declines that could see gold testing the lower support at 1290–1285.
Sterling Slumps On Weak GDP Data
The British pound fell on the day as economic data showed a second month of GDP contracting. Missing estimates of a 0.1% decline, the gross domestic product fell 0.4% on the month in April. Manufacturing data was also weaker, falling 3.9% on the month. This was more than the estimates of a 1.1% decline. Focus will shift to the monthly jobs report due later today. The average earnings index is forecast to slow to a pace of 2.9% from 3.2% previously.
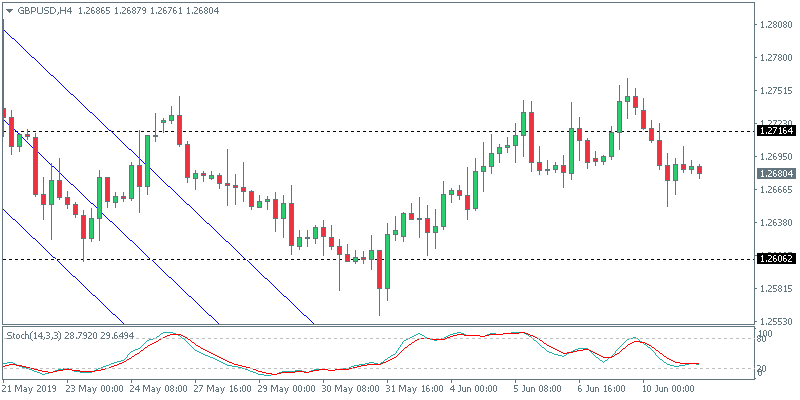
GBPUSD to Continue Trading Sideways
The currency pair briefly ticked higher as it broke past the upper range of 1.2716. However, price slipped back into the range on Monday. The Stochastic Oscillator is seen to be bullish which could potentially signal the upside bias. GBPUSD will need to close strongly above 1.2716 in order for any further upside. To the downside, the lower end of the range at 1.2606 remains in place.
AUD/USD Daily Outlook
Daily Pivots: (S1) 0.6941; (P) 0.6975; (R1) 0.6993; More...
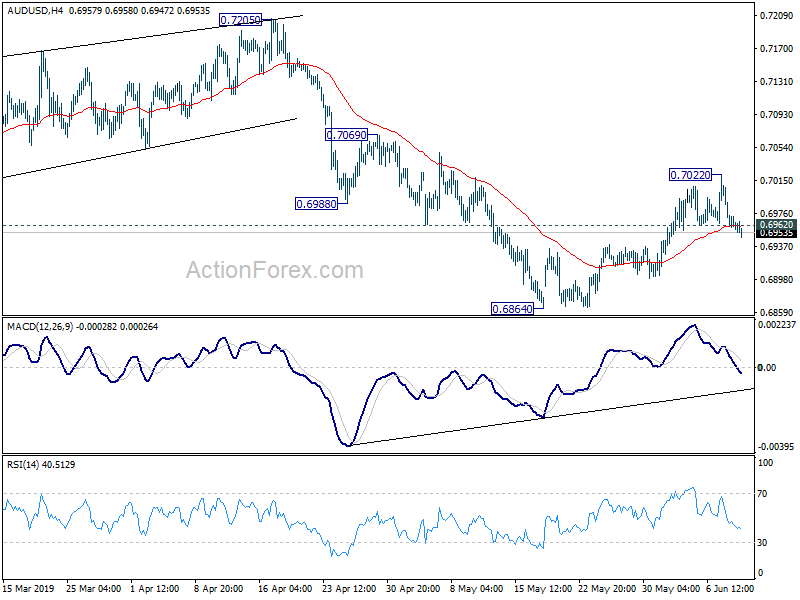
AUD/USD's break of 0.6962 minor support suggests that corrective recovery from 0.6864 has completed earlier than expected at 0.7022. Intraday bias is turned back to the downside for 0.6864 low first. Decisive break there will resume whole fall from 0.7295. On the upside, break of 0.7022 will resume the rebound to 0.7069 resistance next.
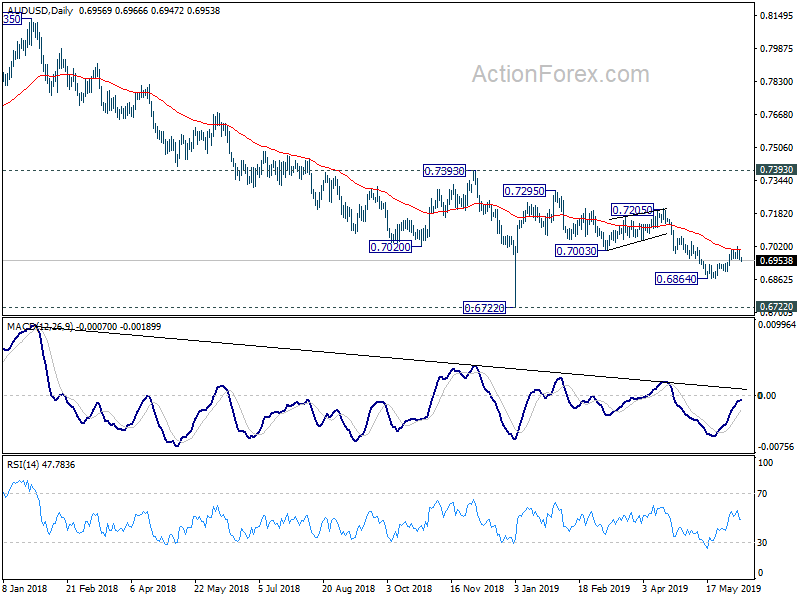
In the bigger picture, with 0.7393 key resistance intact, medium term outlook remains bearish. The decline from 0.8135 (2018 high) is seen as resuming long term down trend from 1.1079 (2011 high). Decisive break of 0.6826 (2016 low) will confirm this bearish view and resume the down trend to 0.6008 (2008 low). However, firm break of 0.7393 will argue that fall from 0.8135 has completed. And corrective pattern from 0.6826 has started the third leg, targeting 0.8135 again.
Euro Maintains Gains On Weak USD
The single currency was seen holding on to its gains on Monday. Lack of economic data from the Eurozone saw most of the flows due to a weaker USD. Following Friday’s weak jobs report, the dollar attempted to rise to intraday highs before giving up those gains.
Can the EURUSD Continue to Trend Higher?
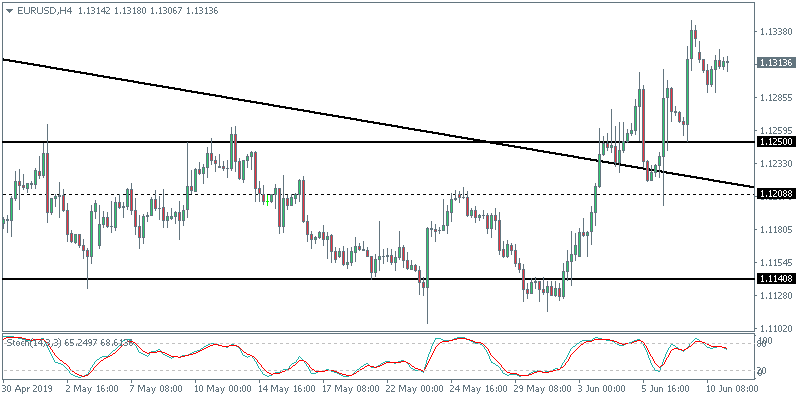
The currency pair initially slipped on Monday’s open, but price was seen recovering by the day’s close. EURUSD will need to close above the recent pivot highs of 1.1338 in order to post further upside in price. With the Stochastic Oscillator looking bullish, this could be the short-term bias for the moment. The upside target is seen at 1.1400.
USD/CAD Daily Outlook
Daily Pivots: (S1) 1.3243; (P) 1.3266; (R1) 1.3291; More...
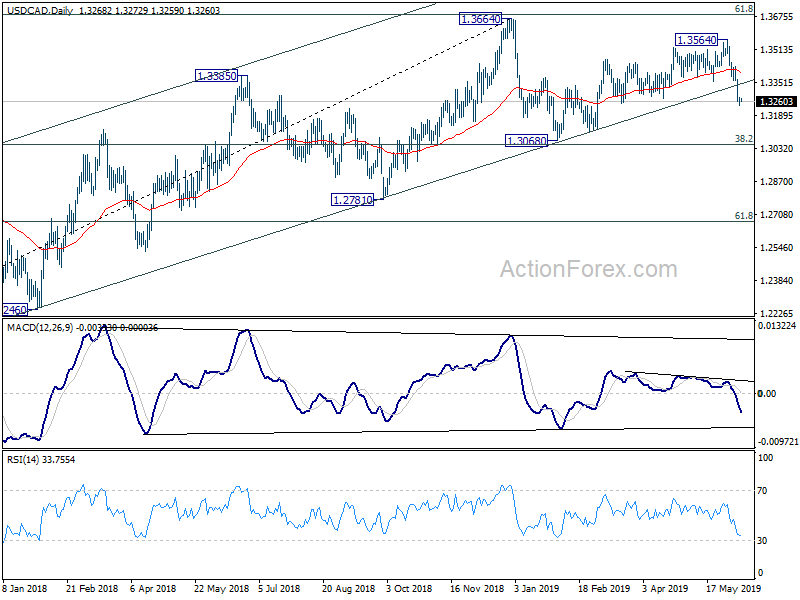
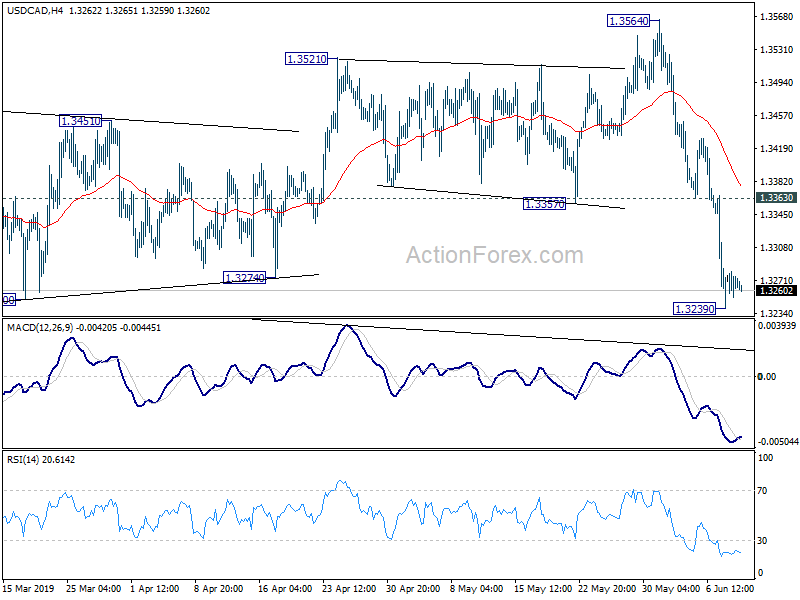
A temporary low is in place at 1.3239 in USD/CAD with 4 hour MACD crossed above signal line. Intraday bias is turned neutral for some consolidation first. Upside of recovery should be limited by 1.3363 support turned resistance to bring fall resumption. As noted before, choppy rise from 1.3068 has completed at 1.3564 already. Break of 1.3239 will turn bias back to the downside for 1.3052/68 cluster support.
In the bigger picture, the strong break of medium term channel support now argues that up trend from 1.2061 (2017 low) has completed at 1.3664 (2018 high), just ahead of 61.8% retracement of 1.4689 (2016 high) to 1.2061 at 1.3685, and 1.3793 resistance. Decisive break of 1.3068 cluster support (38.2% retracement of 1.2061 to 1.3664 at 1.3052) will confirm and pave the way to 61.8% retracement at 1.2673 next. For now, risk will remain on the downside as long as 1.3564 resistance holds, even in case of strong rebound.