Sample Category Title
EUR/GBP Daily Outlook
Daily Pivots: (S1) 0.8884; (P) 0.8908; (R1) 0.8940; More...
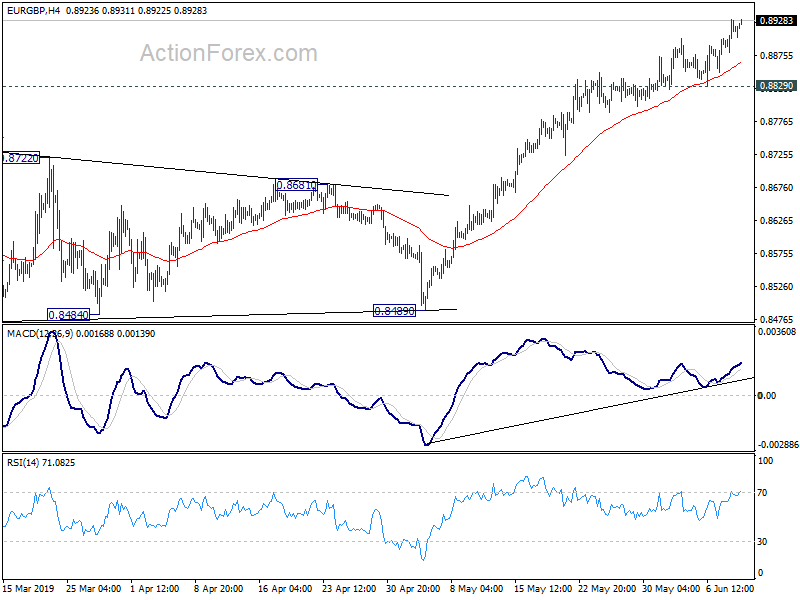
Intraday bias in EUR/GBP remains on the upside for the moment. Current rise from 0.8472 is in progress for 0.9101 key resistance next. On the downside, break of 0.8829 support is needed to indicate short term topping. Otherwise, outlook will remain bullish in case of retreat.
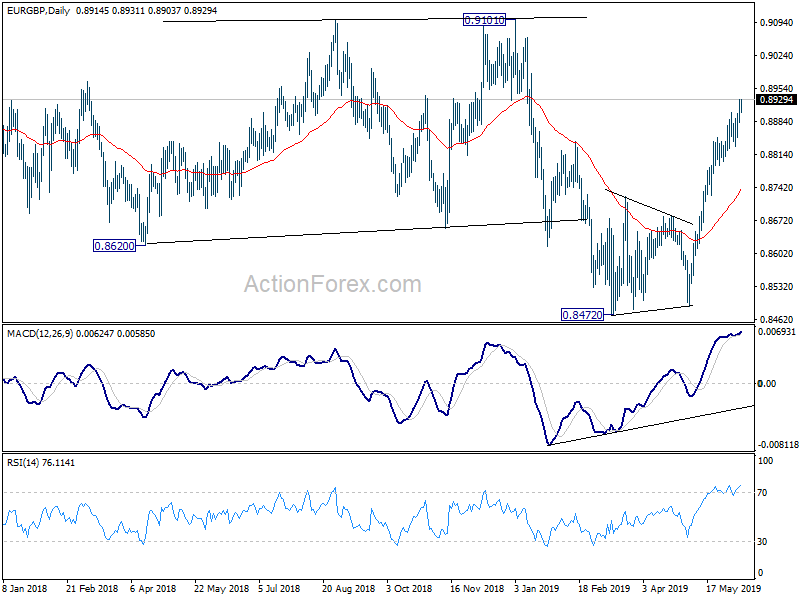
In the bigger picture, medium term decline from 0.9305 (2017 high) is seen as a corrective move. No change in this view. Current development argues that it might have completed with three waves down to 0.8472, just ahead of 38.2% retracement of 0.6935 (2015 low) to 0.9306 at 0.8400, after hitting 55 month EMA (now at 0.8526). Decisive break of 0.9101 resistance will confirm this bullish case. Nevertheless, as EUR/GBP is still staying inside long term falling channel, correction from 0.9305 could still extend to 0.8400 fibonacci level before completion, if upside is rejected by 0.9101.
GBPUSD Weakens Below 20-Day SMA, Next Support 1.2600
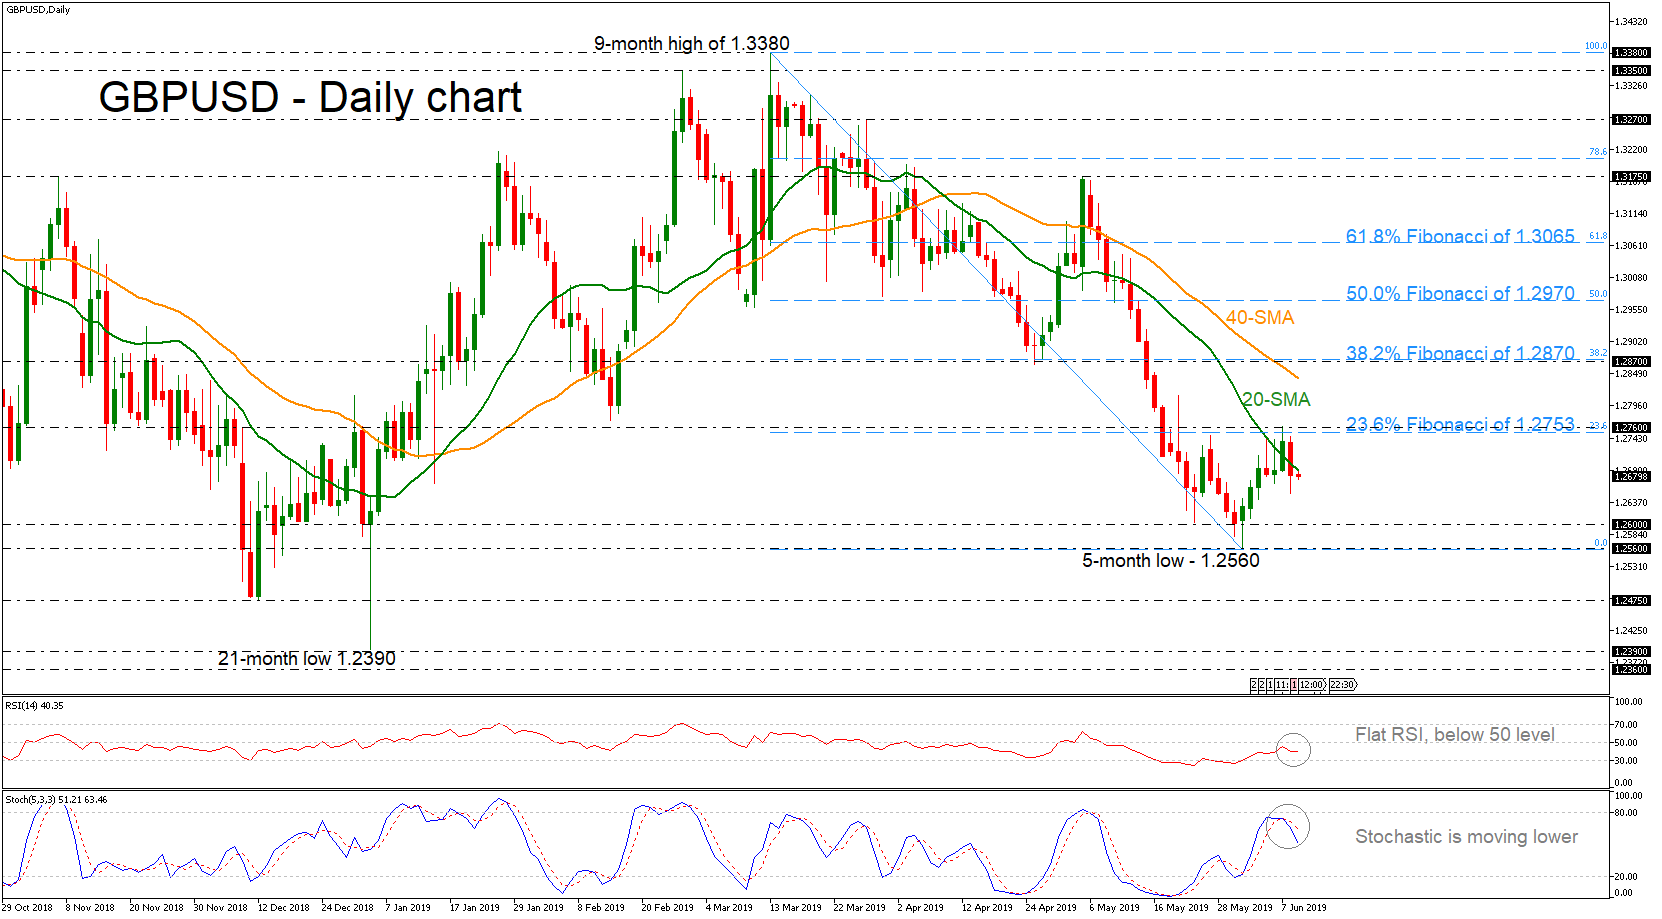
GBPUSD failed several times to jump above the 20-day moving average and the 23.6% Fibonacci retracement level of the downward wave from 1.3380 to 1.2560, near 1.2753, suggesting weak momentum in the daily timeframe.
The negative to neutral bias in the near term is supported by the deterioration in the momentum indicators. The %K line of the stochastic oscillator has fallen sharply below the overbought zone, while the RSI indicator is flattening in the negative territory.
The 1.2600 psychological level has proven a reliable support level in previous sessions and therefore should be closely watched in case of negative momentum. Even deeper, a significant decline below the five-month low of 1.2560 would open the way towards the 1.2475 area.
On the flipside, immediate resistance to upside movements could emerge around 1.2753 – 1.2760 and a closing price above them could prove more important for the rally to continue. Even higher, a taller wall could be holding around the 38.2% Fibonacci of 1.2870, but the pair needs to first surpass the 40-day SMA – currently at 1.2840.
Concluding, downside risks have somewhat increased in the short-term as the technical indicators are supporting a bearish to neutral bias, while in the medium-term the bearish outlook remains.
LTCUSD Could Hit $160.00
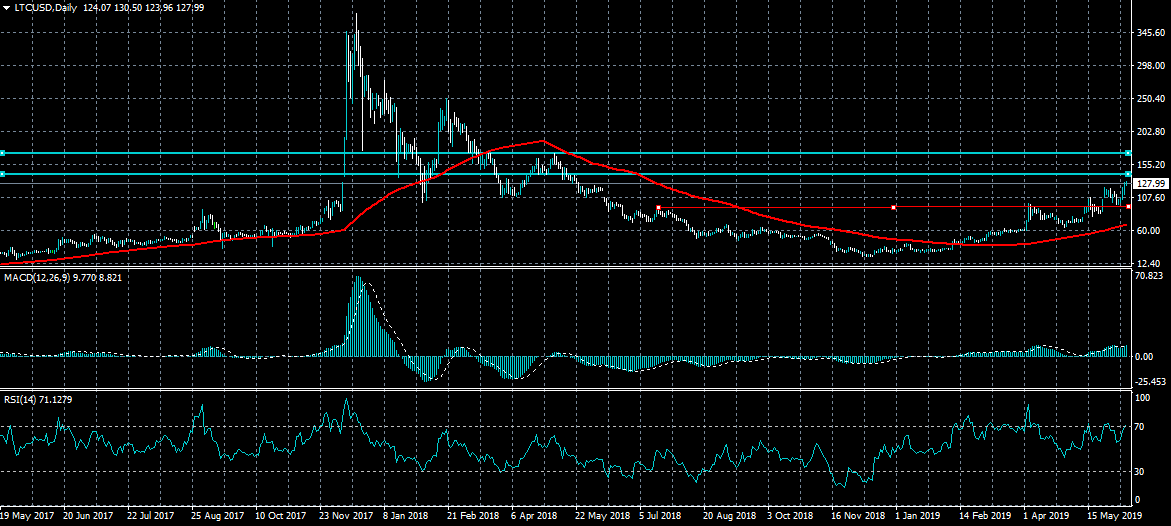
Litecoin has advanced to fresh 2019 trading high following a bullish technical breakout above the $120.00 resistance level on Tuesday. The LTCUSD pair is now marching forward, with the $134.00 and $160.00 levels the two major bullish targets ahead. The daily time frame is clearly showing that a huge inverted head and shoulders pattern could now be in the forming.
The LTCUSD pair is only bullish while trading above the $110.00 level, key resistance is found at the $134.00 and $160.00 levels.
If the LTCUSD pair trades below the $110.00 level, key support is found at the $100.00 and $90.00 levels.
EURUSD Bulls Still In Charge
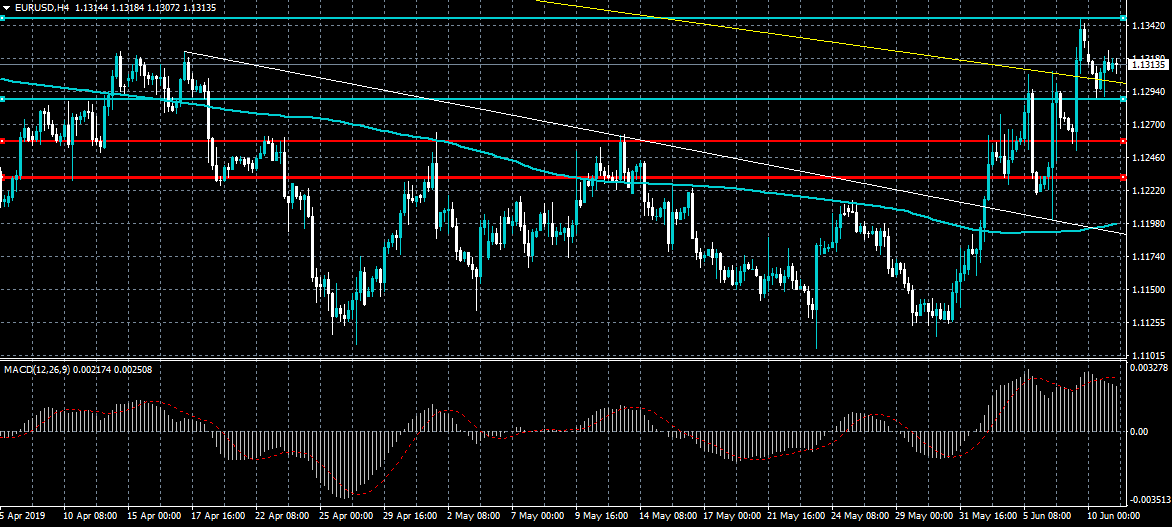
The euro has made a quick recovery higher after briefly dipping below the 1.1300 level against the US dollar and finding strong buying demand just below the 1.1290 level. Buyers now need to break the former weekly higher and aim to close the daily candle above the EURUSD pairs 200-day moving average. Overall, the upside target for short-term bulls is likely to be the 1.1390 to 1.1410 area if weakness in the greenback persists.
The EURUSD pair is only bearish while trading below the 1.1280 level, key technical support is found at the 1.1260 and 1.1230 levels
If the EURUSD pair trades above the 1.1280 level, buyers may test the 1.1360 and 1.1390 levels
GBPUSD Dip Buying Still Present
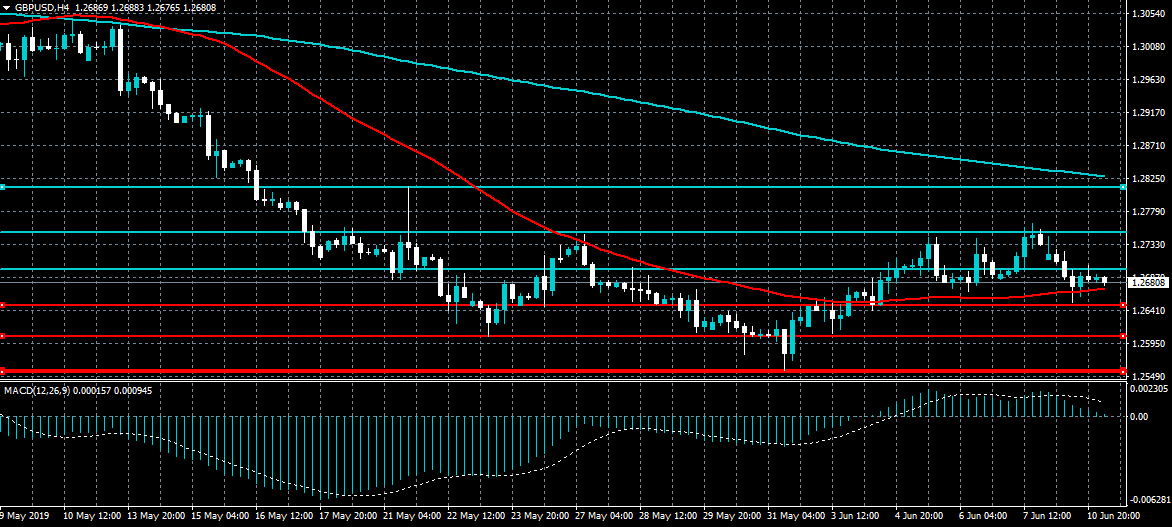
The British pound is struggling to reclaim the 1.2700 level against the US dollar after yesterday’s much weaker set of data points from the UK economy. However, dip-buying demand for sterling still remains present, with bulls still maintaining the upper-hand while price holds above the 1.2660 level. GBPUSD bulls are likely to place stops around the 1.2600 level ahead of today’s next round of UK data points.
The GBPUSD pair is only bullish while trading above the 1.2710 level, key resistance is located at the 1.2762 and 1.2817 levels.
The GBPUSD pair is only bearish while trading below the 1.2710 level, key intraday support remains at the 1.2680 and 1.2660 levels.
Stocks Continue Rally Despite Trump’s Threat For More China Tariffs
The US dollar was relatively unmoved as traders received the JOLTS job openings data for April. Data showed that the job openings in April were 7.449 million, which was lower than the expected 7.479 million. It was also lower than the previously released 7.474 million. This data came after the official non-farm payrolls data, which showed that the economy added just 75K jobs in May – a sign that American employers are possibly holding out hiring as the trade war intensifies.
Sterling was unchanged ahead of the employment numbers expected today. Data is expected to show that the unemployment rate remained unchanged at the current 3.8%. The claimant count change is expected to have declined by 22.9K while the average earnings index plus bonus is expected to have declined by 2.9%. This data will come a day after the country released weak GDP data, which showed that the economy contracted by minus 0.4% in April. The manufacturing production declined by an annualized rate of -0.8% while the trade deficit to non-EU members increased to 4.6 billion pounds.
Asian stocks rose today even after Donald Trump’s latest threat to impose a 25% tariff on the remaining $300 billion goods from China. In a phone call with CNBC, the President said that he expected to have a meeting with China’s Xi Jinping in the G20 meeting in Japan. If the meeting will not take place, the President said that a 25% tariff on all American goods from China will go into effect. Trump has been focused on the large trade deficit with China. However, some experts dispute this figure. While the headline deficit figure shows a $100+ billion deficit, American firms do business worth more than $300 billion in China. This is compared to just the $20 billion Chinese firms do in the US.
EUR/USD
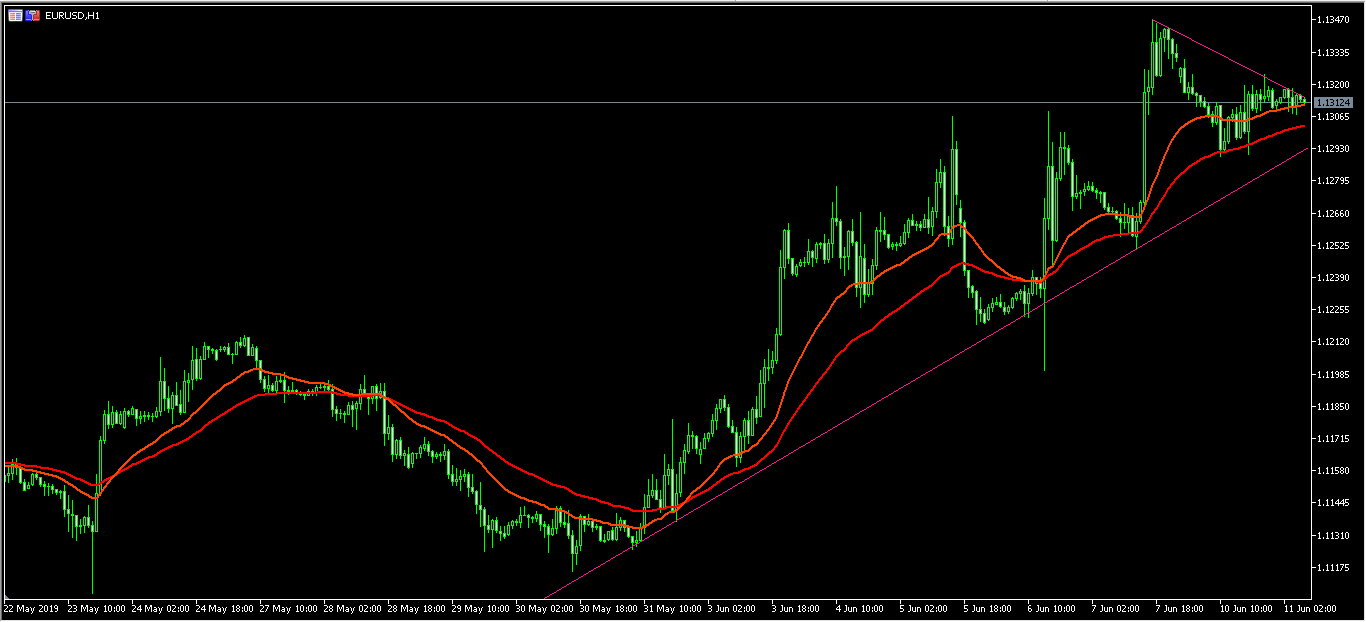
The EUR/USD pair was little moved today and is currently trading at 1.1310. This is slightly lower than Friday’s close of 1.1347 and yesterday’s low of 1.1290. The price is above the 50-day moving average and along the 25-day EMA. The pair has formed an ascending triangle pattern as shown below. Today, with no major economic data expected from the US and the EU, the pair could remain within this range.
GBP/USD
The GBP/USD pair is trading at the 1.2677 level, which is above yesterday’s low of 1.2650. On the hourly chart below, the pair is below the 25-day and 50-day moving averages. The price is also slightly lower than the 61.8% Fibonacci Retracement level. The pair will likely react to employment data from the UK and also the ongoing campaign to succeed Theresa May as the next Prime Minister.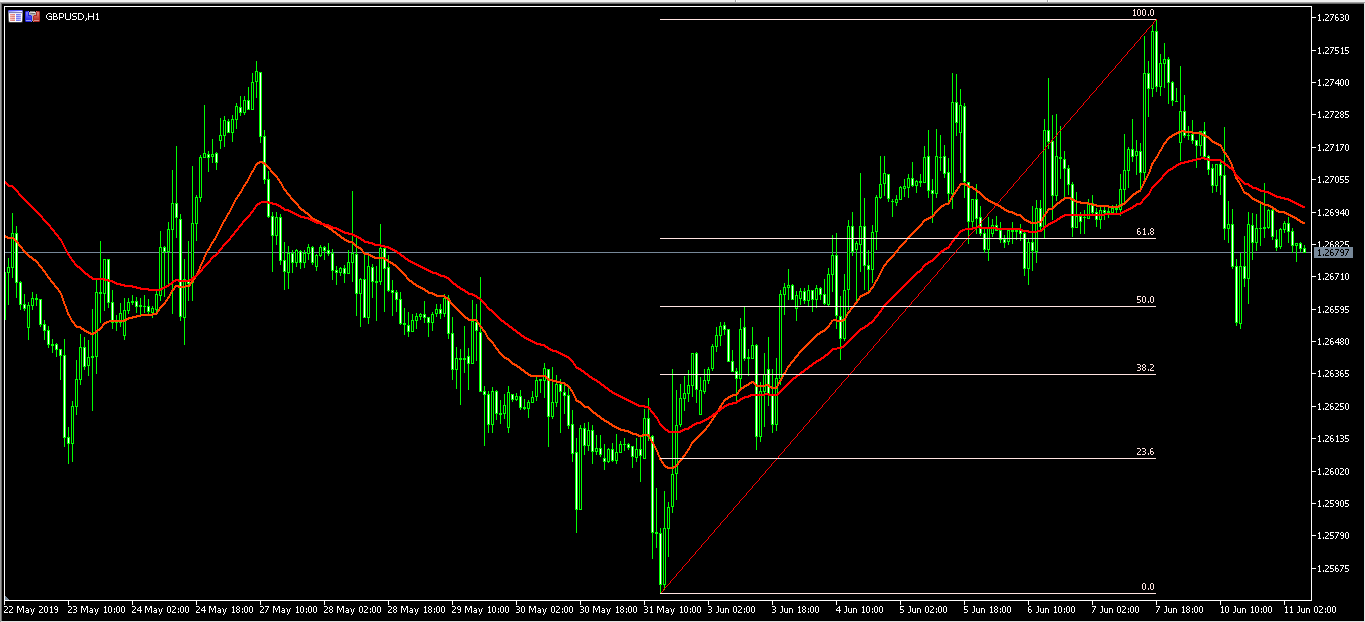
EUR/GBP
The EUR/GBP pair continued the rally started on May 13, when the pair reached a low of 0.8490. Today, the pair reached a high of 0.8922, which was the highest level since January 21. On the daily chart, the pair is above the 25-day and 50-day moving averages while the RSI has reached above the overbought level of 70. The Bulls Power remains strong. There is a likelihood that the pair will continue moving higher to reach the 0.9000 resistance level.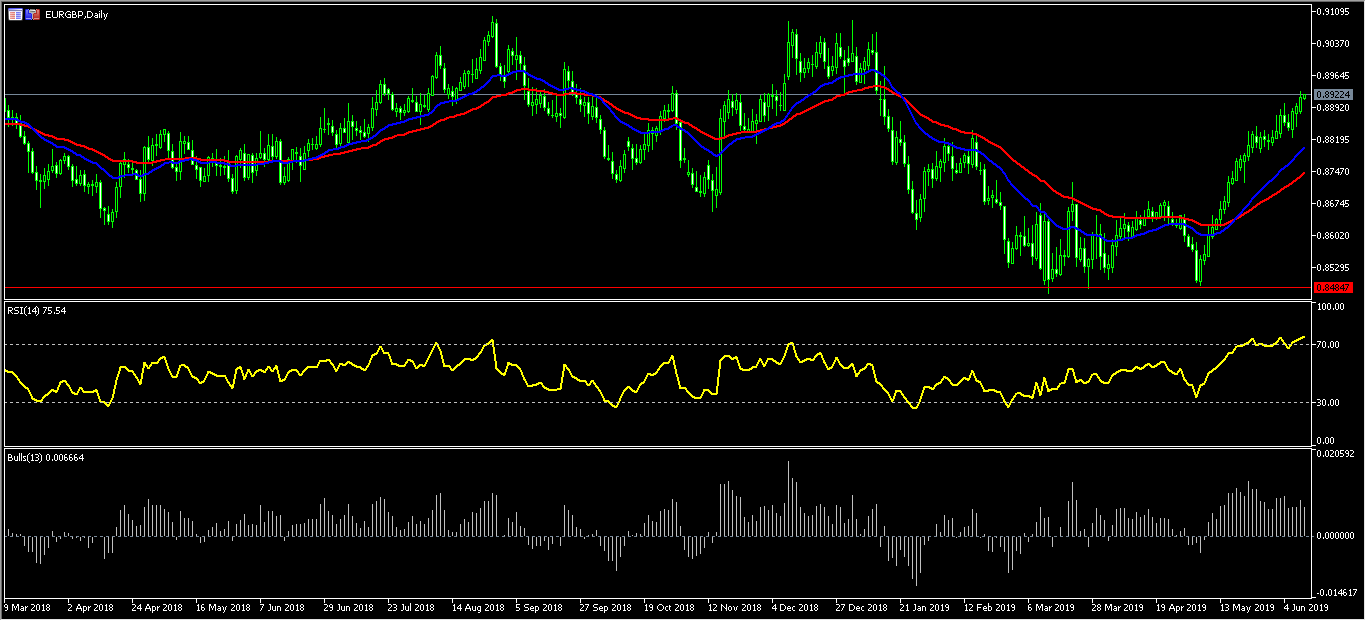
Asian Equities Track US Gains
General Trend:
- Property, materials and industrial sectors outperform in China amid expectations for more infrastructure spending
- Shanghai IT index rises over 2.5%, chipmaker Sanan Optoelectronics up over 5%
- Financials, Electric Appliance, Marine/Transportation and Steel companies are among the gainers in Japan
- ASX 200 outperforms on holiday impact
- Australia NAB business confidence rises in May amid post-election impact and RBA rate cut expectations
- Chinese yuan (CNY) rises as PBoC said it will sell bills in Hong Kong later in June
- China continues to stress that it will support smaller banks, regulator addresses market rumors
- South Korea’s exports extended declines into early July, chip exports and shipments to China continue to drop
- HK legislative Council is expected to start debate on Wednesday on new government extradition bill (would allow suspects wanted in mainland China to be sent across the border for trial)
Headlines/Economic Data
Australia/New Zealand
- ASX 200 opened +0.2%
- (AU) AUSTRALIA MAY NAB CONFIDENCE: 7 V 0 PRIOR; BUSINESS CONDITIONS: 1 V 3 PRIOR
- WPL.AU Guides FY19 production to lower end of prior 88-94 MMBOE due to delay at the Pluto LNG turnaround; production restart targeted for June 2019
- VOC.AU AGL Energy makes indicative offer of A$4.85/shr cash, grants exclusive due diligence
- (NZ) New Zealand Q1 Manufacturing Activity Q/Q: +1.0% v -0.5% prior; Activity Volume Q/Q: +2.0% v 2.0% prior
Japan
- Nikkei 225 opened -0.2%
- 7201.JP CEO Saikawa: Renault opposition to reform is "most regrettable", planned corporate governance overhaul is only option - Nikkei
- (JP) BOJ, PBoC and BOK governors said to have held a meeting to exchange views on economic and financial situation - financial press
- (JP) Japan PM Abe will not hold double election (simultaneous elections in the upper and lower house) this summer - Japan press
- 7201.JP Japan Industry Min Seko: Closely watching how Renault will assess Nissan's attempts to improve corporate governance
Korea
- Kospi opened -0.2%
- (KR) South Korea Jun 1-10 Exports -16.6% y/y; Chip Exports -30.8% y/y
- (KR) North Korea leader Kim half brother Kim Jong Nam who was killed in 2017 said to have been a CIA informant and had met with US officials - US press
China/Hong Kong
- Hang Seng opened +0.4%; Shanghai Composite opened +0.1%
- (CN) China issued notice related to local government special bonds issuance and project financing; to encourage financial firms and individuals to invest in local gov't bonds; To allow local governments to use the proceeds from special bonds as capital for qualified major projects.
- (CN) China PBOC may continue to support small banks with various tools, including targeted RRR cuts, MLF and SLF - China Securities Journal
- (CN) China reportedly planning to tighten rules on smaller lending firms - Chinese Press
- (CN) China PBOC to sell bills in Hong Kong later in June in order to improve yuan bond yield curve in Hong Kong, no amount given
- (CN) China PBoC Open Market Operation (OMO): Injects CNY10B in 7-day reverse repos v CNY30B prior; Net CNY50B drain v CNY50B drain prior
- (CN) China PBoC sets yuan reference rate: 6.8930 v 6.8925 prior
- (CN) Trump's G20 meeting with China President Xi could again be a formal dinner – SCMP
- (CN) China National Grain Center: To start auctions of soybeans from reserves on June 17th
Other Asia
- (PH) Philippines Apr Trade Balance: -$3.5B v -$3.9Be; Exports Y/Y: +0.4% v 1.0%e (first rise in 6 months); Imports Y/Y: -1.9% v 3.7%e
North America
- (US) Pres Trump: If China Pres Xi doesn't come to the G20, we would put the next $300B of tariffs into effect immediately - CNBC interview
- CVS Federal judge said to be close to rejecting planned merger with Aetna, says US District judge Richard Leon has concerns about the impact of the transaction on prices and competition - NY Post
Europe
- (UK) UK Conservative party announces official entrants to leadership race for PM
- (IT) Italy Conte's Office comments after PM met with Di Maio and Salvini: Reiterates Finance Min Tria to help set strategy for dealings with EU
- (UK) Right-wing Tory '92 Group supports MP Boris Johnson for PM in non-binding vote - press
- (UK) BOE's Saunders: rates may need to rise faster than curve implies; BOE doesn't need to wait for Brexit resolution to act
Levels as of 1:20 ET
- Nikkei 225, +0.3%, ASX 200 +1.5%, Hang Seng +0.8%; Shanghai Composite +2%; Kospi +0.5%
- Equity Futures: S&P500 +0.2%; Nasdaq100 +0.4%, Dax +0.3%; FTSE100 +0.2%
- EUR 1.1320-1.1307 ; JPY 108.64-108.34 ; AUD 0.6967-0.6952 ;NZD 0.6612-0.6593
- Gold +0.3% at $1,332/oz; Crude Oil +0.4% at $53.58/brl; Copper +0.6% at $2.678 /lb
Elliott Wave View Favors More Upside In Nike
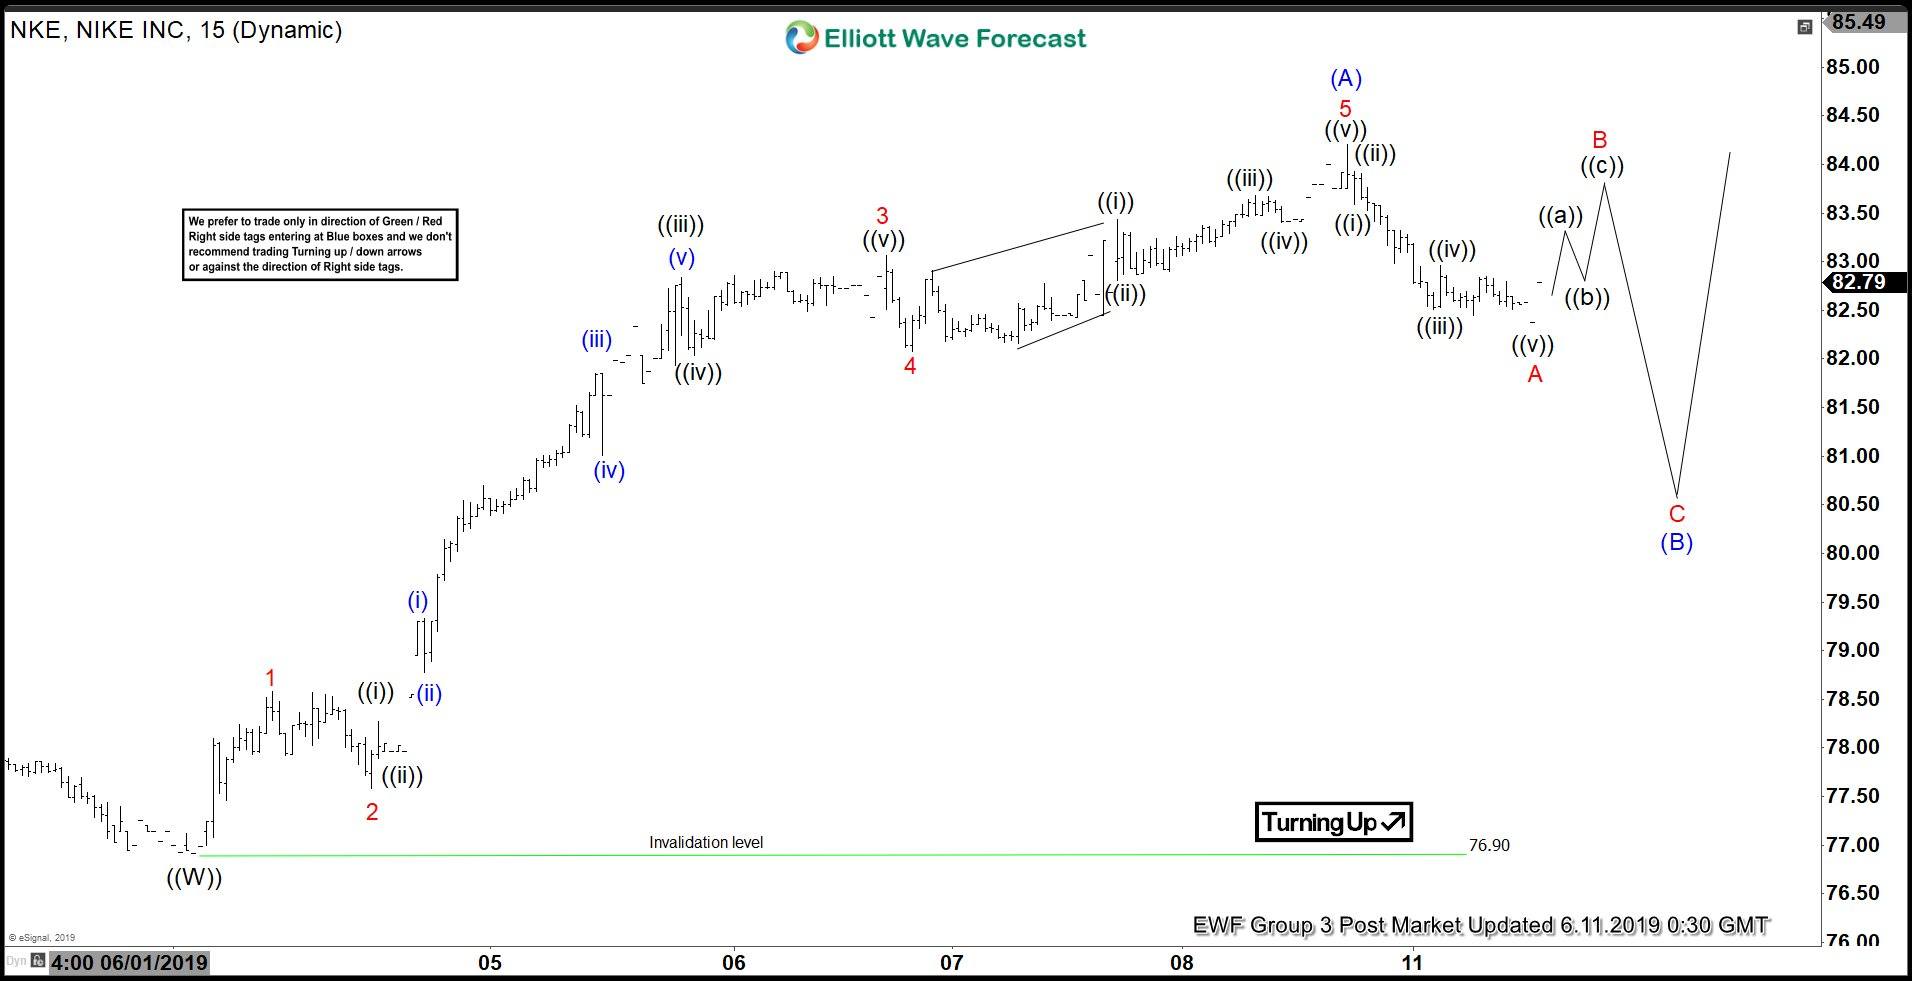
Short term Elliott wave view in Nike (NKE) calls the rally from June 3 low unfolding as a 5 waves impulse Elliott Wave structure. Up from June 3 low, wave 1 ended at 78.58 and wave 2 pullback ended at 77.58. Wave 3 ended at 83.06 and subdivides as another impulse structure in lesser degree. Wave 4 pullback ended at 82.08, and wave 5 ended at 84.20 which also subdivides as an impulse in lesser degree. The 5 waves move higher ended wave (A) and the stock is now correcting cycle from June 3 low in wave (B)
The correction is proposed to unfold as a zigzag Elliott Wave structure. Down from 84.2, wave A ended at 82.37 and wave B rally is in progress as 3 waves. The stock should then lower in wave C to continue correction of cycle from June 3 low. As far as the pullback stays above 76.90, expect Nike to extend higher again. Potential area where wave (B) can end is 50 – 61.8% Fibonacci retracement of wave (A). This area comes at 79.69 – 80.54 where buyers can appear for more upside. We don’t like selling the stock.
Nike 1 Hour Elliott Wave Chart
Closer Look at China’s Trade Data Reveals that Trade War is Eating Into Economy
The US-China trade war continues to evolve. The upcoming important event would be the G-20 summit on June 28 and 29. US' Donald Trump has recently noted that he expects to meet China's Xi Jinping, or would impose 25% tariff on the rest of US$300B Chinese exports. The latest trade report from China appears unaffected by Trump's new tariff announced in May. However, a close look at the data shows that the trade war is already having negative impacts on Chinese economy.
China’s trade surplus jumped to US$ 41.7B, highest in 5 months, in May. The strong reading was driven by an unexpected exports growth and a sharp contraction in imports. Despite the strong headline reading, the report shows that the intensified US- China trade war has had real impact in the Chinese economy. The front-loaded trade in order to avoid new tariff signals exports growth should worsen in the second half of the year, while deeper contraction in imports is a proof of weakness in domestic demand.
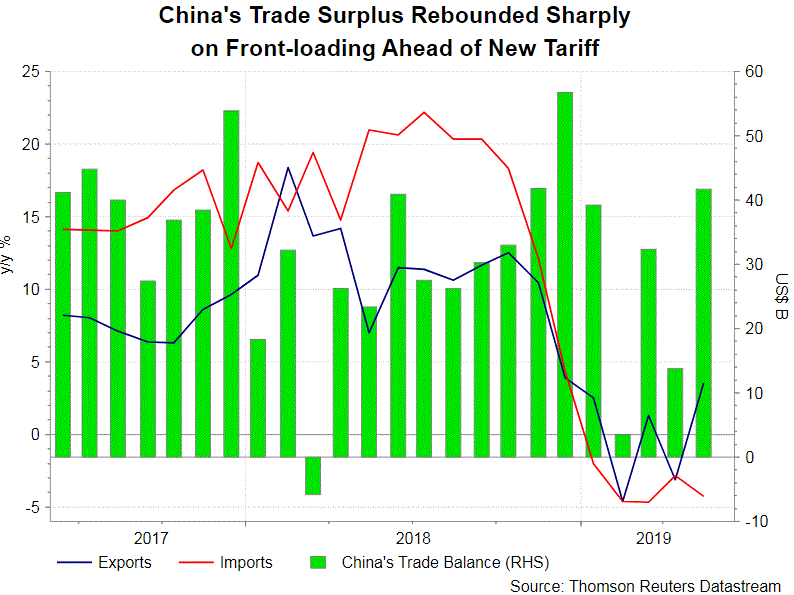 Exports in May grew +1.1% y/y, compared with consensus of -3.9% and April’s -2.7%. Notwithstanding fewer working days in May and weak manufacturing sentiment, the upside surprise was mainly driven by front-loading of exports. Trump, in early May, announced to increase tariff on US$200B worth of Chinese goods from 10% to 25%. This had caused traders to arrange shipments ahead of the original effective date of June 1. The trade department on May 31 released a statement indicating that “covered products that were exported from China to the US prior to May 10, 2019 will remain subject to an additional 10% tariff if they enter into the US before June 15, 2019”. We expect this change, together with expectations that Trump to impose tariff on the rest of US$ 300B exports from China, would lead to further front-loading effect in the first half of June.
Country-wise, China’s exports to US contracted -4.16% y/y. While staying in contraction, it narrowed from the severe -13.1% a month ago. Exports to other advanced economies were mixed. While the shipment to Japan gained +0.5%, up from a -16.3% contraction previously, export growth to EU countries slipped modestly to +6.1% from April’s +6.5%. Exports to emerging markets were also mixed. Shipment to Taiwan was the strongest, growing +12.8% in May, after a +4.7% growth in the prior month. Exports to Korea added +1.8%, following a -7.6% contraction in April. However, exports to Russia slumped -13.8% y/y in May, compared with a +2.6% growth in April, while those to Brazil sank -27.1%, following a +11% growth in April.
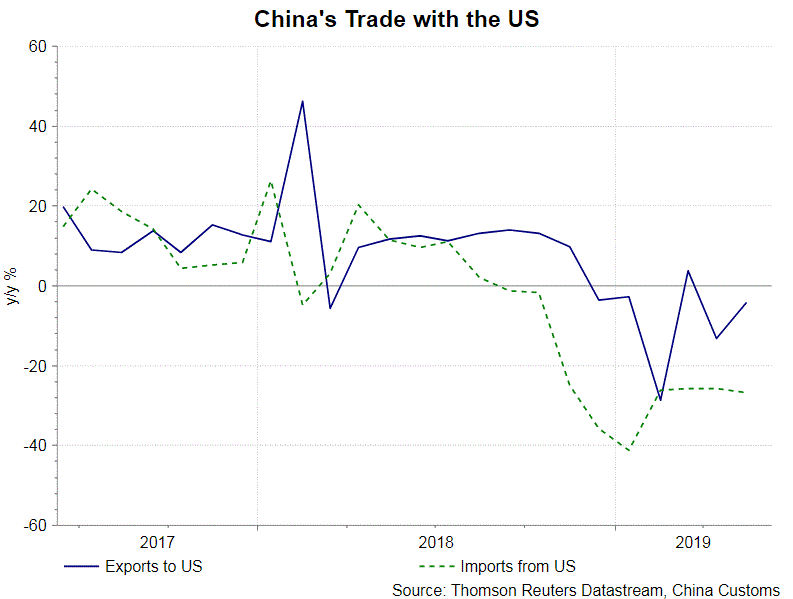
Imports contracted -8.5% y/y, weaker than consensus of -3.5% and April’s -2.8%. The contraction was broadly based, suggesting dismal economic developments domestically. Notably, imports from the US contracted -26.78% y/y in May, marking the 9th month in the negative territory. Imports from Korea contracted 18.2% y/y in May, deteriorating from -2.4% a month ago. Imports from Taiwan also declined -8.3%, worsening form April's-6.8%. Imports from Japan turned to contraction from expansion. These are the major countries for meeting China's demand on electronic and electric goods. Elsewhere, import form Brazil declined -17.8% y/y in May, following a strong +20.4% expansion in the prior month. Imports from Australia expanded +5.2%, markedly easing form +18% in April. China buys from both countries for satisfying the commodity needs. The country-wise analysis shows that Chinese demand for both electronic, electric and commodity products deteriorated in May.
While the front-loading effect might lift the exports growth in June, the outlook for the rest of the year is gloomy and with high uncertainty. More key macroeconomic data for China would be released on Friday. Another upcoming important event is the G-20 summit scheduled on June 28 and 29. Trump has recently threatened to immediately raise tariff of the remaining US$300B of Chinese exports if he could not meet Xi Jinping during the summit.
Euro Trading A Tad Higher In The Asian Session
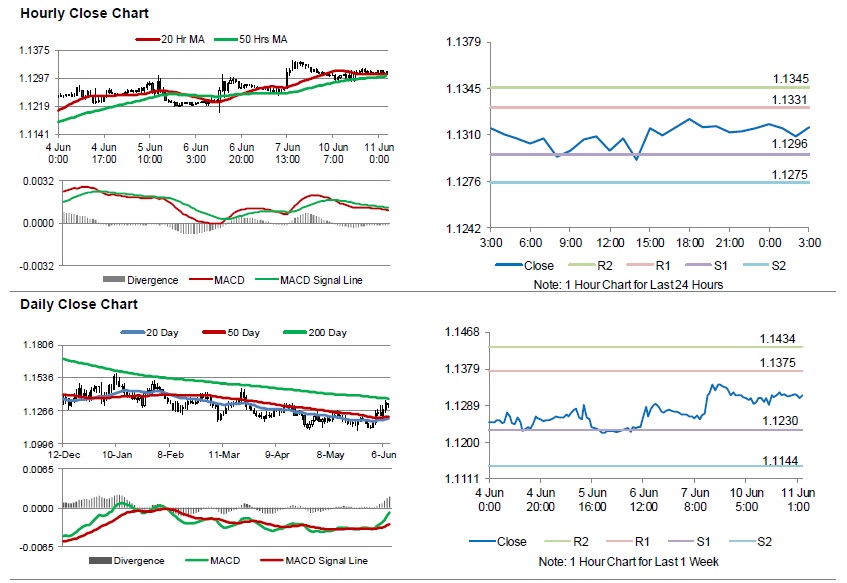
For the 24 hours to 23:00 GMT, the EUR slightly rose against the USD and closed at 1.1314.
In the US, data showed that the JOLTs job openings unexpectedly fell to a level of 7449.0K in April, compared to market expectations for a rise to a level of 7496.0K. In the prior month, the JOLTs job openings had registered a revised reading of 7474.0K.
In the Asian session, at GMT0300, the pair is trading at 1.1316, with the EUR trading marginally higher against the USD from yesterday’s close.
The pair is expected to find support at 1.1296, and a fall through could take it to the next support level of 1.1275. The pair is expected to find its first resistance at 1.1331, and a rise through could take it to the next resistance level of 1.1345.
Going forward, traders would await Euro-zone’s Sentix investor confidence for June, slated to release in a few hours. Later in the day, the US NFIB small business optimism and the producer price index, both for May, will be on investors radar.
The currency pair is showing convergence with its 20 Hr moving average and trading above its 50 Hr moving average.