Sample Category Title
UK PMI manufacturing dropped to 49.4, first contraction July 2016
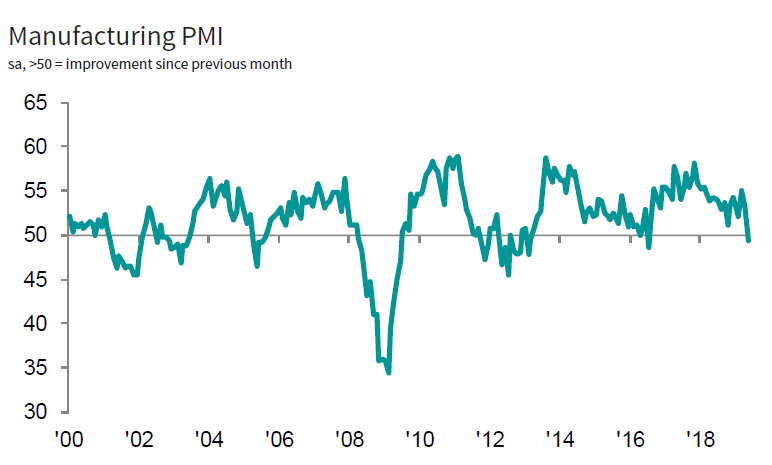
UK PMI manufacturing dropped to 49.4 in May, down from 53.1 and missed expectation of 52.2. That's also the lowest level in 34 months. Markit noted that manufacturers reported increased difficulties in convincing clients to commit to new contracts during May, due to high level of inventories from pre-Brexit stockpiling. New order inflows also deteriorated from both domestic and overseas sources.
Rob Dobson, Director at IHS Markit, which compiles the survey:
"The UK manufacturing sector was buffeted by ongoing Brexit uncertainty again in May. The headline PMI posted 49.4, moving back into contraction territory for the first time since July 2016, the month directly following the EU referendum result. The trend in output weakened and, based on its relationship with official ONS data, is pointing to a renewed downturn of production
"New order inflows declined from both domestic and overseas markets, as already high stock levels at manufacturers and their clients led to difficulties in sustaining output levels and getting agreement on new contracts. Demand was also impacted by ongoing global trade tensions, as well as by companies starting to unwind inventories built up in advance of the original Brexit date. Some EU-based clients were also reported to have shifted supply chains away from the UK.
"Although the consumer goods sector remained a positive growth spot, the intermediate and investment goods industries are still comparatively weak, in part reflecting the reverberation of the recent sharp slowdown the autos sector. With these demand, purchasing and inventory trends likely to stay in play for the foreseeable future, the current manufacturing downturn may have further to run and will have negative ramifications for growth in the broader economy in the months ahead."
USD/CAD Possible 1.3564 If 1.3480 Holds
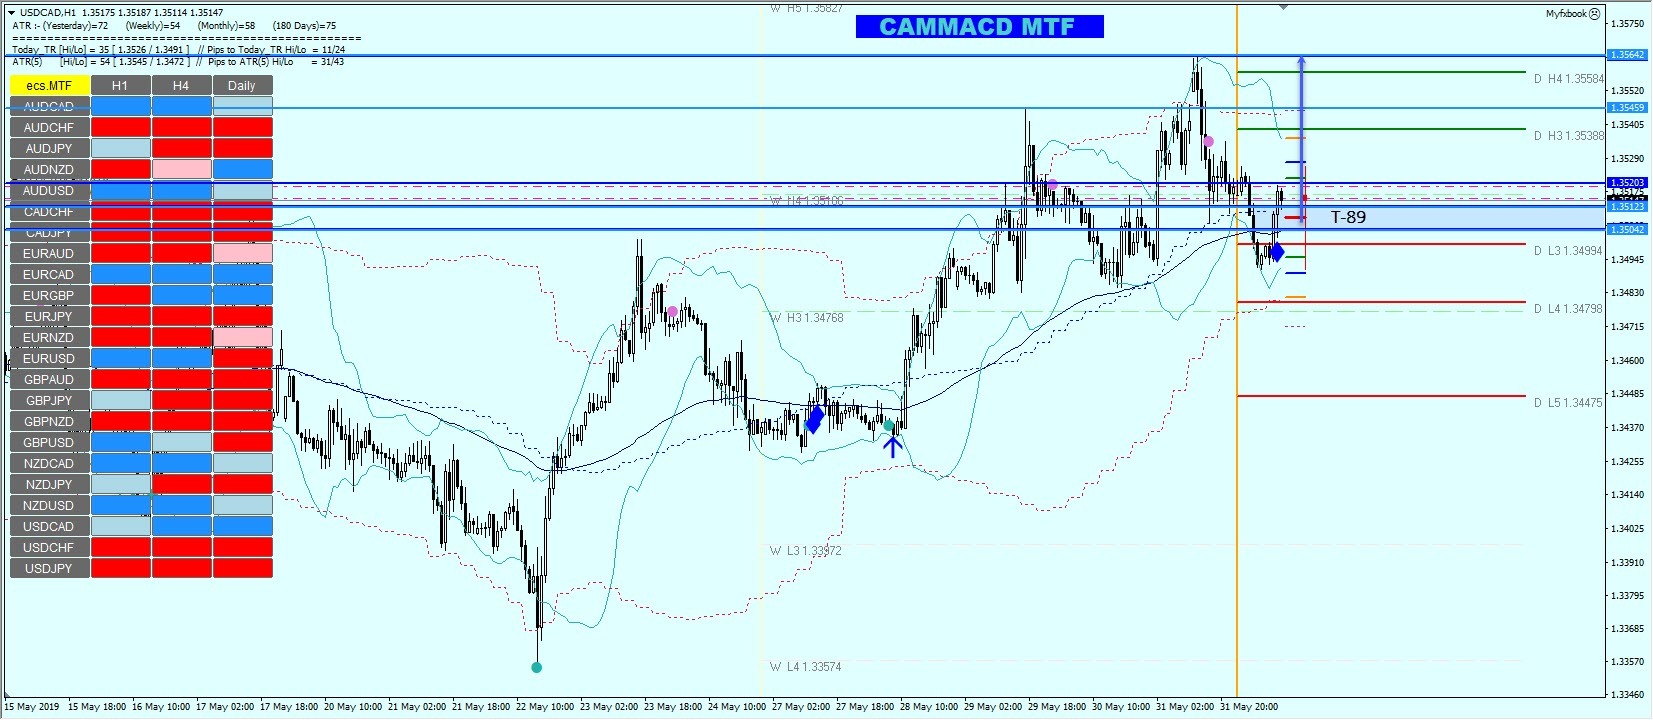
The USD/CAD has made a T-89 pattern within the concept of a bullish trend. We could see a bullish continuation.
If the price manages to reject from 1.3510-20 we should see a continuation towards 1.3528 and 1.3545. However, a close above 1.3545 is needed for the final target projection 1.3564. This bullish scenario is valid only if the price manages to hold above 1.3480. Have in mind that the ATR (5) is 54 pips, so the pair is slower. If you take a look at the chart you will also notice a nice bullish zig-zag so pay attention to further bullish continuation.
Markets Assessed The Trade Wars Effect
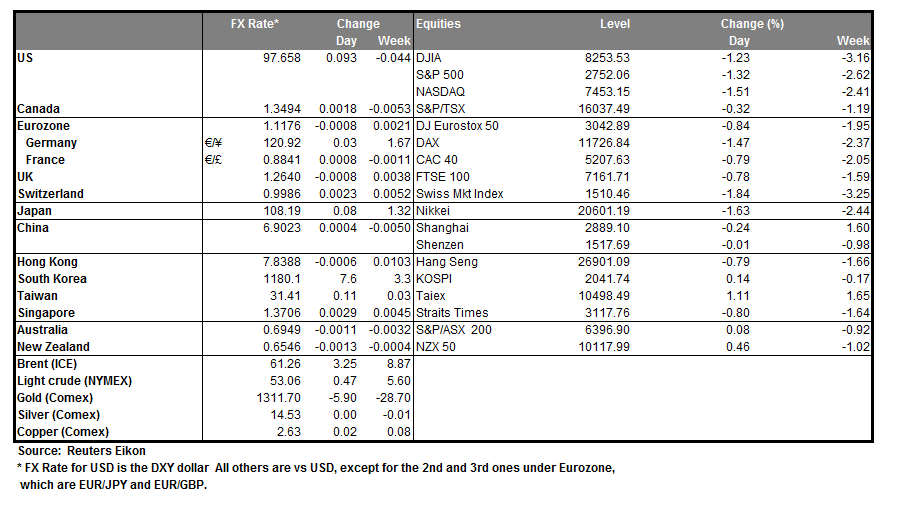
Trade disputes have an increasingly significant negative impact on the global economy. The manufacturing PMIs for Asian countries published this morning showed a decline in manufacturing activity from Japan to Taiwan. Chinese data showed a constant level of 50.2, which reflects a very weak growth. During the day, relevant figures for Europe and America will be published. European indicators are expected to be below 50, reflecting a decline in production activity. In U.K. and the United States, by contrast, analysts expect to see some acceleration of growth.
Stocks
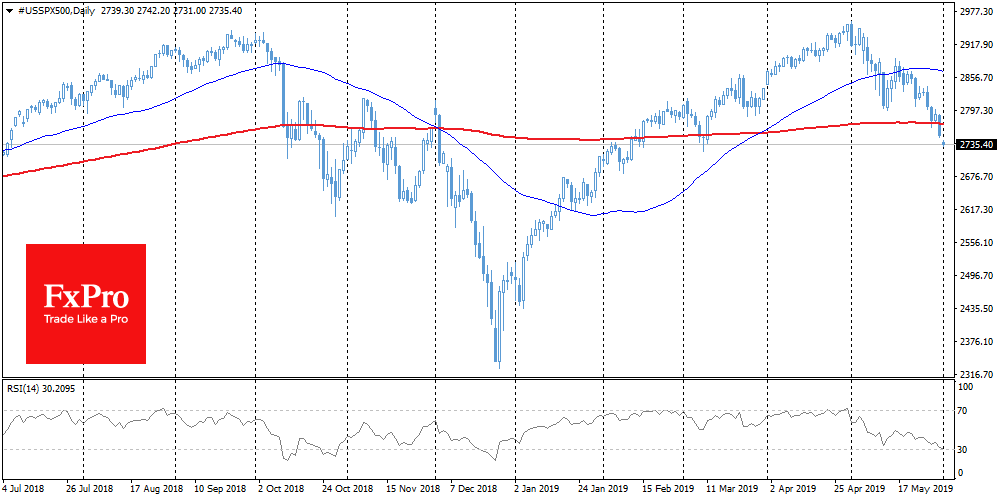
Asian indices show a decline in the area of multi-month lows. Heng Seng Index fell to its 4.5-months lows. The Japanese Nikkei and the American SPX are near their lows since early February on fears that trade disputes would have a significant negative impact on business activity. Market participants are worried that the situation is worse than previously expected. Reduced bond yields and pressure on stock markets make it clear that the current central banks' measures are not enough to sustain long-term economic growth.
EURUSD
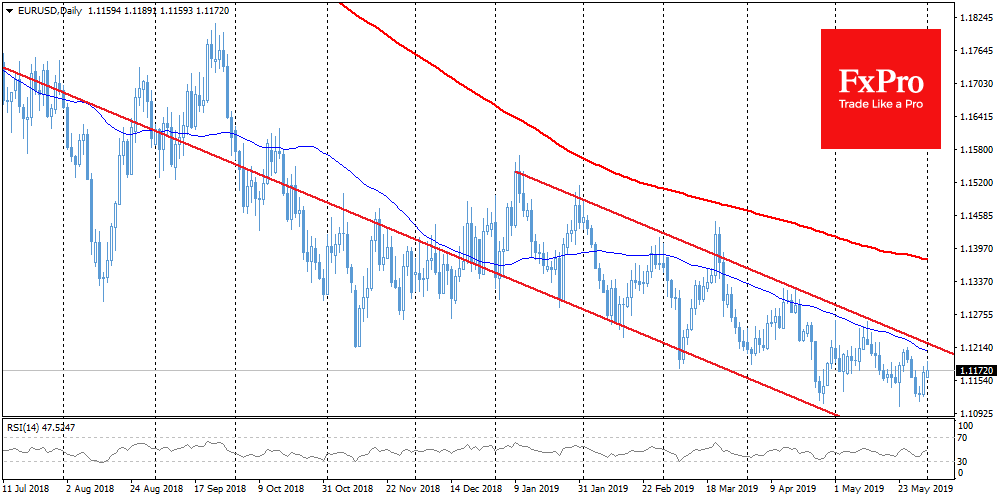
The euro again received support in the downturn to 1.1130. The demand for defensive bonds increases the momentum of demand for the single currency. German 10-year yields fell below -0.2%, updating historic lows. Even the Greek bonds yield is fell to the lowest in the recent years, reflecting the growth in demand for these bonds. The EURUSD’s 50-day moving average may again serve as an important resistance level, but market participants can avoid going beyond 1.1130-1.1200 in the first half of the week, waiting for comments from the ECB on Thursday and data on the US labour market on Friday.
Gold
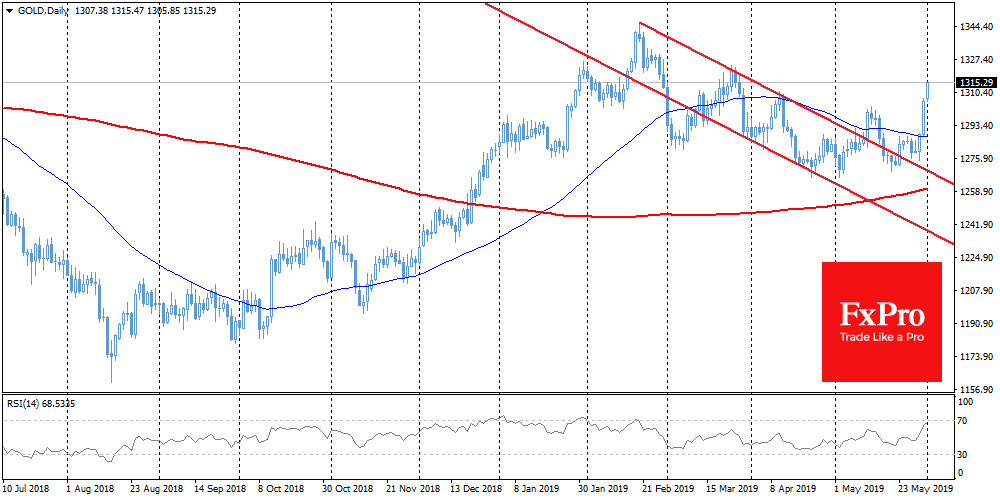
Gold rose to 1310, touching the maximum levels since March, climbing 2.4% during the rally over the past 3 days. The momentum towards defensive assets allowed gold to break the downtrend, which was in force from February to May of this year. In case of continued growth, gold bulls can rely on the previous local maximums at $1,320 and $1,340. Among the more distant growth targets is the region above $1,360 near the highs of the last four years. And in this case, it will strengthen the fight of gold bugs for a long-term trend.
Eurozone PMI manufacturing finalized at 47.7, toughest spell since 2013 continued
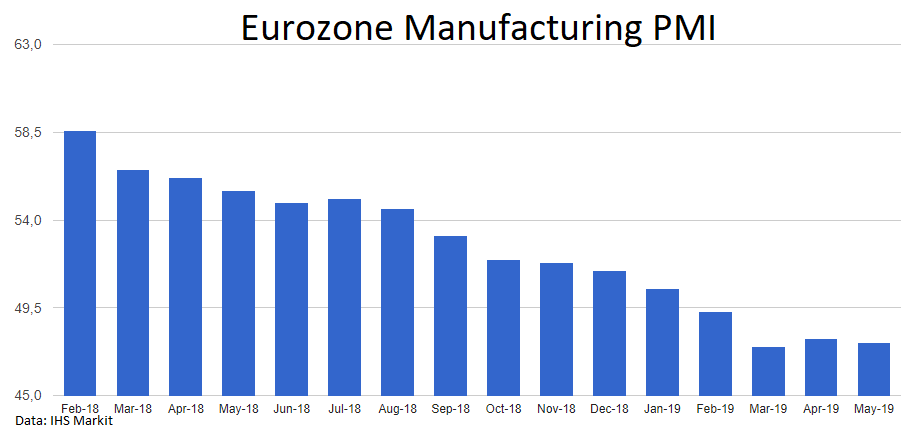
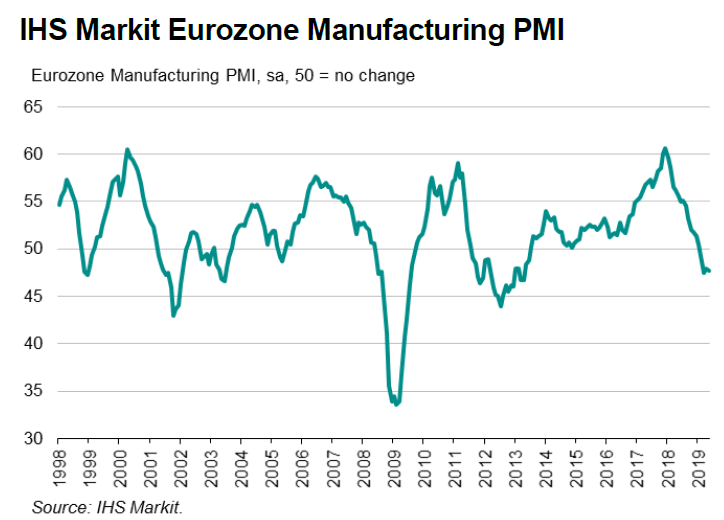
Eurozone PMI Manufacturing was finalized at 47.7 in May, unrevised, down from April's 47.9. That's also very close to six year low at 47.5 made in March. Looking at the member states, German PMI manufacturing was worst at 44.3. Austria reading dropped to 50-month low at 49.5. Italy reading improved to 8-month high at 49.5 but stayed below 50. Spain reading dropped to 3-month low at 50.2. France reading improved to 3-month high at 50.6, barely expanding.
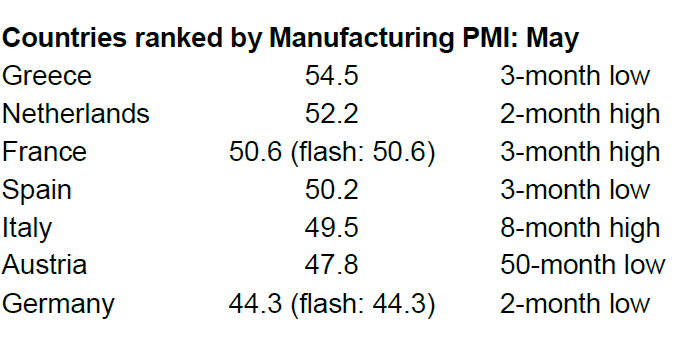 Commenting on the final Manufacturing PMI data, Chris Williamson, Chief Business Economist at IHS Markit said:
"Euro area manufacturing remained in contraction during May, suggesting the sector will act as a drag on the wider economy in the second quarter.
"A fourth successive monthly drop in output and further steep decline in new orders underscored how the sector remains in its toughest spell since 2013. Companies are tightening their belts, cutting back on spending and hiring. Input buying, inventories and employment are all now in decline as manufacturers worry about being exposed to a further downturn in demand.
"That said, although the headline PMI fell in May, the decline masked slower rates of decline for both output and new orders. The forward-looking orders- to- inventory ratio also picked up for a second month running to reach a six-month high, the improvement of which augurs well for the downturn to moderate in June.
"However, trade wars, slumping demand in the auto sector, Brexit and wider geopolitical uncertainty all remained commonly cited risks to the outlook, and all have the potential to derail any stabilisation of the manufacturing sector."
Also released, Swiss CPI slowed to 0.6% yoy in May, down from 0.7% yoy and matched expectation. Swiss PMI manufacturing rose 0.2 to 48.6 in May, below expectation of 48.8.
The Analytical Overview Of The Main Currency Pairs
The EUR/USD currency pair
Technical indicators of the currency pair:
Prev Open: 1.11288
Open: 1.11603
% chg. over the last day: +0.34
Day's range: 1.11599 – 1.11900
52 wk range: 1.1111 – 1.2009
EUR/USD started to grow. The trading instrument updated the local maximums. The investors are worried about the escalation in the trading conflict. Donald Trump said that on June 10, Washington will introduce 5% fees o the goods from Mexico should the local leaders fail to stop the stream of illegal immigrants into the US. The EUR/USD quotes are consolidating around 1.11700-1.11900. Further growth of EUR is highly probable. Expect more economic releases and open positions from the key levels.
The Economic News Feed for 03.06.2019:
Industrial PMI (GER) – 10:55 (GMT+3:00);
Industrial PMI (US) – 17:00 (GMT+3:00);
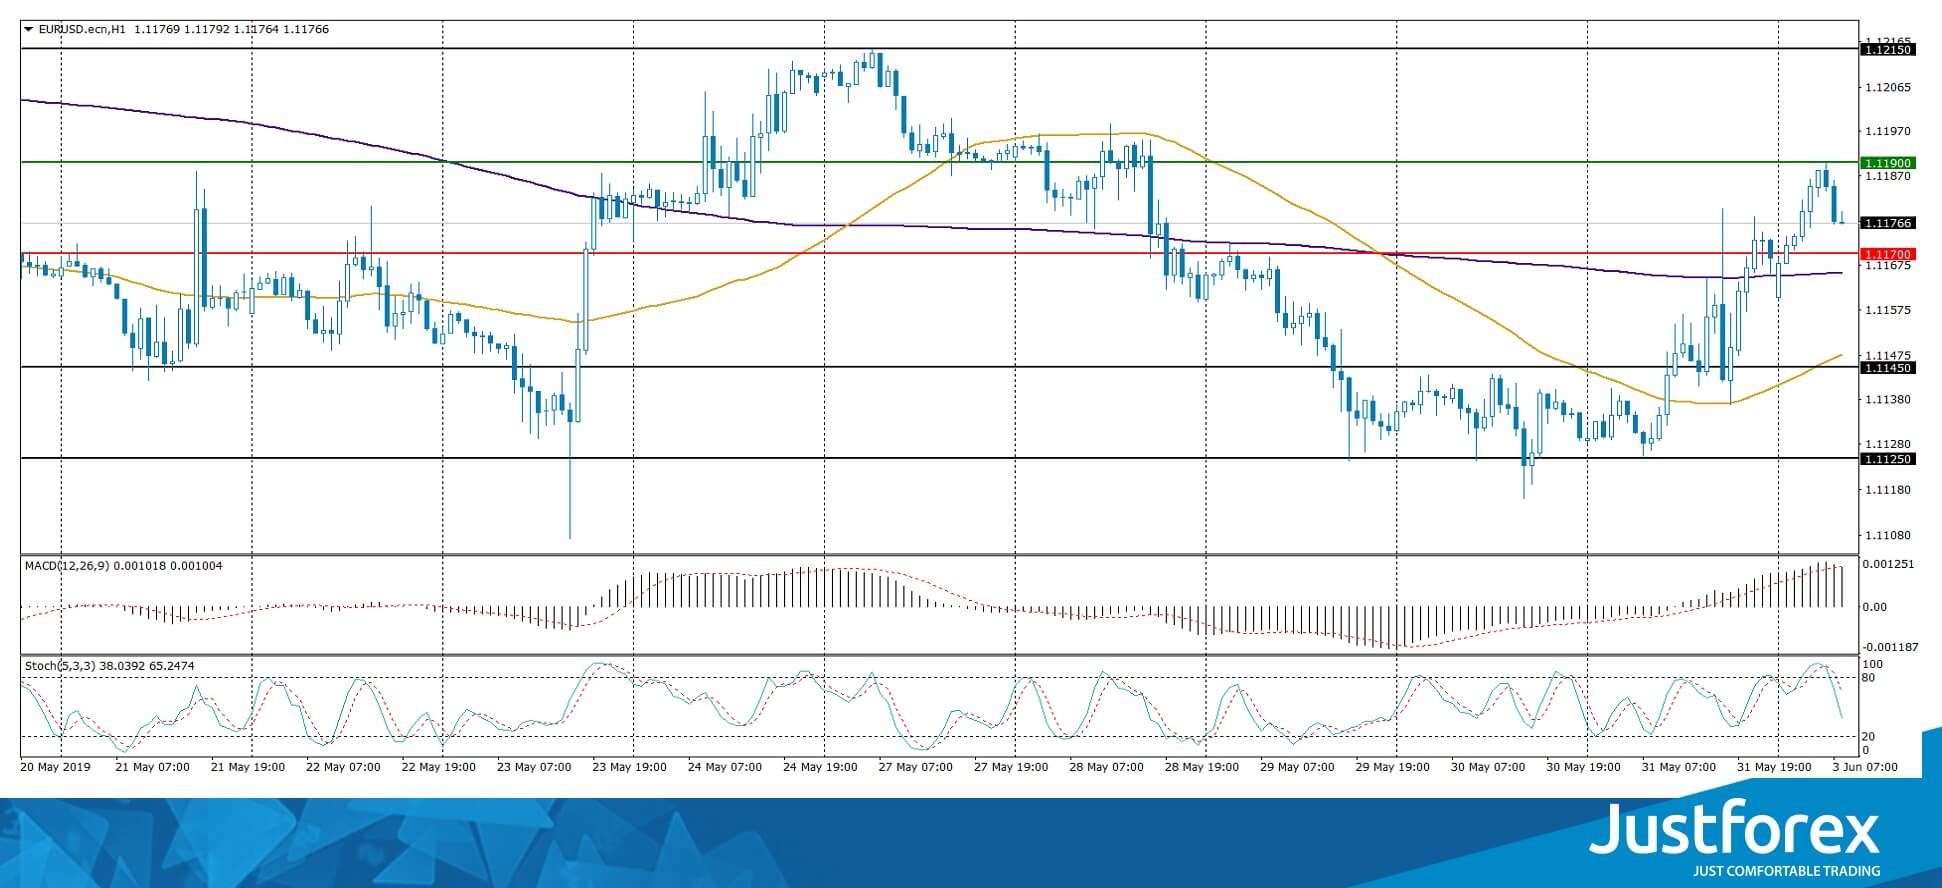
The price fixed above 200 MA which points to the power of the buyers.
The MACD histogram is in the positive zone and above the signal line which gives a strong signal to buy EUR/USD.
The Stochastic Oscillator is in the neutral zone, the %K line is below the %D line which points to the bearish mood.
Trading recommendations
Support levels: 1.11700, 1.11450, 1.11250
Resistance levels: 1.11900, 1.12150
If the price fixes above 1.11900, expect further growth towards 1.12150-1.12300.
Alternatively, the quotes can fall towards 1.11450-1.12300.
The GBP/USD currency pair
Technical indicators of the currency pair:
Prev Open: 1.26091
Open: 1.26264
% chg. over the last day: +0.19
Day's range: 1.26178 – 1.26552
52 wk range: 1.2438 – 1.3631
GBP/USD started to recver. Trading instrument set the new local maximums. The financial market participants started to fix the USD positions. Today Donald Trump will visit Great Britain. GBP/USD is consolidating. Local support and resistance are 1.26250 and 1.26550. GBP can correct further. You should open positions from the key levels.
At 11:30 (GMT+3:00) Great Britain will publish an industrial PMI.
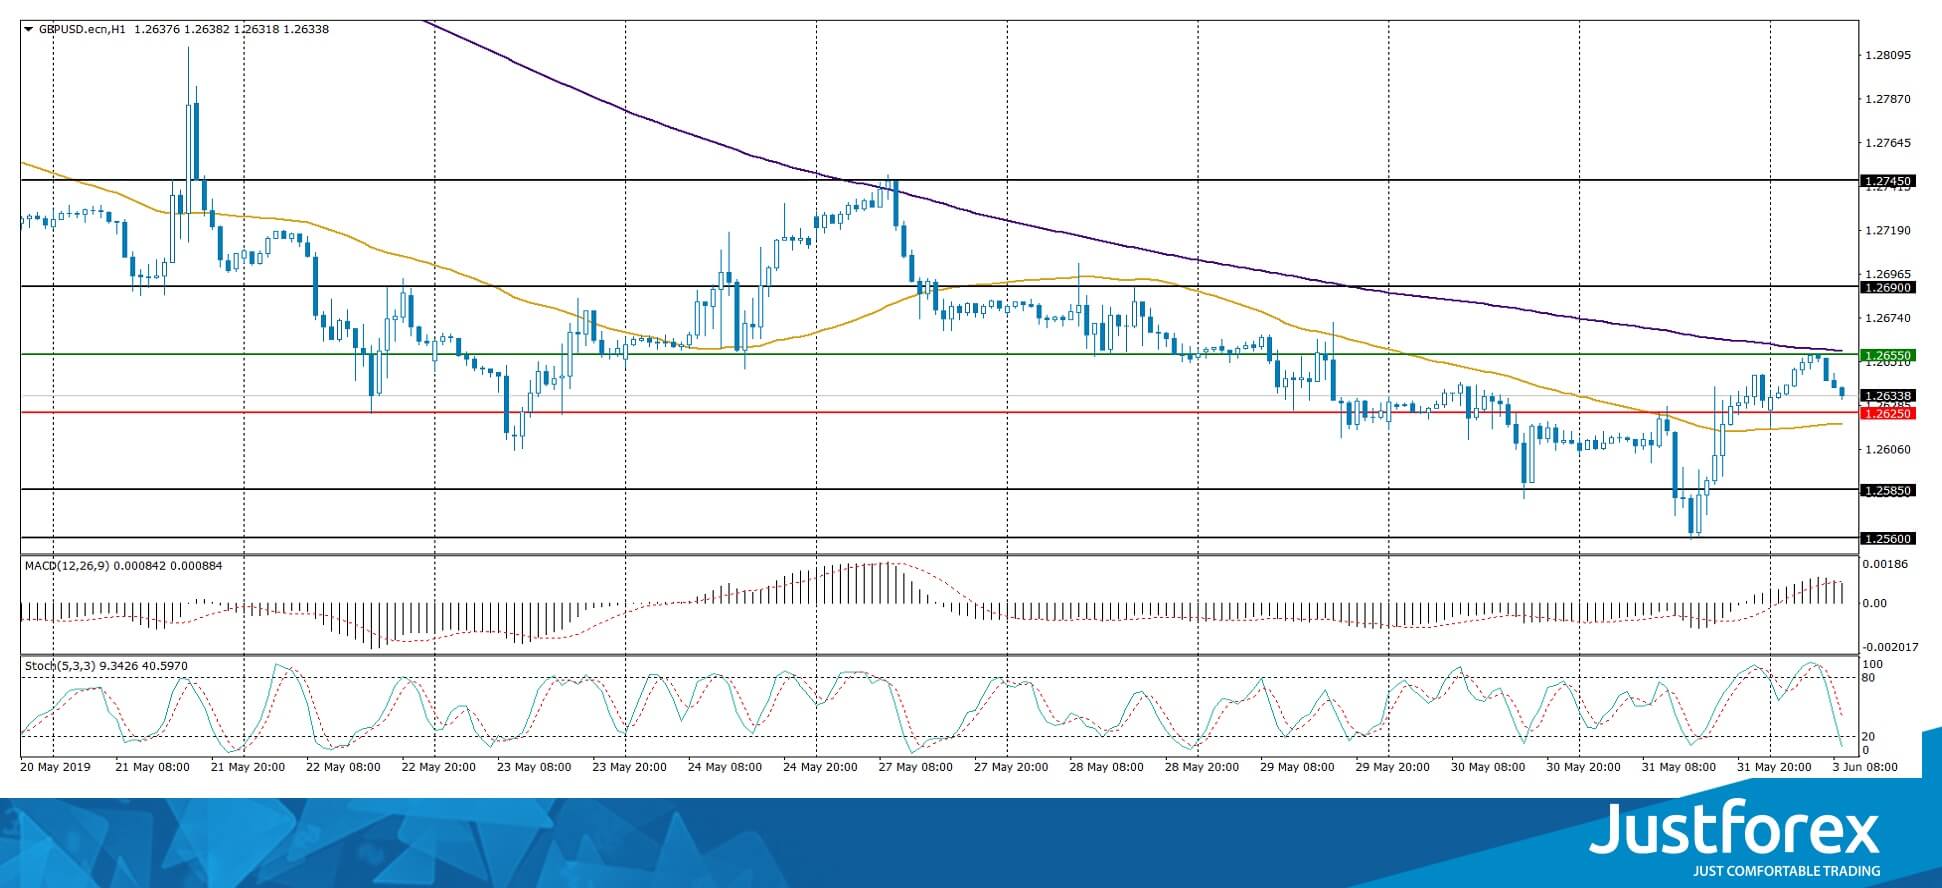
The indicators do not provide precise signlas, the price fixed between 50 MA and 200 MA.
The MACD histogram is in the positive zone but below the signal line which gives a weak signal to sell GBP/USD.
The Stochastic Oscillator is in the neutral zone, the %K line is below the %D line which points to a bearish mood..
Trading recommendations
Support levels: 1.26250, 1.25850, 1.25600
Resistance levels: 1.26550, 1.26900, 1.27450
If the price fixes above 1.26550, expect further correction towards 1.27000.
Alternatively, the quotes can fall towards 1.25850-1.25600.
The USD/CAD currency pair
Technical indicators of the currency pair:
Prev Open: 1.35164
Open: 1.35168
% chg. over the last day: +0.06
Day's range: 1.34918 – 1.35270
52 wk range: 1.2727 – 1.3664
USD/CAD has an ambiguous technical picture. CAD is moving sideways. The key support and resistance levels are 1.34850 and 1.35250. USD/CAD has prospects for correction after a long rally. We expect reports from the US. Keep an eye on the oil quotes dynamics and open positions from the key levels.
The Economic News Feed for 03.06.2019 is calm.
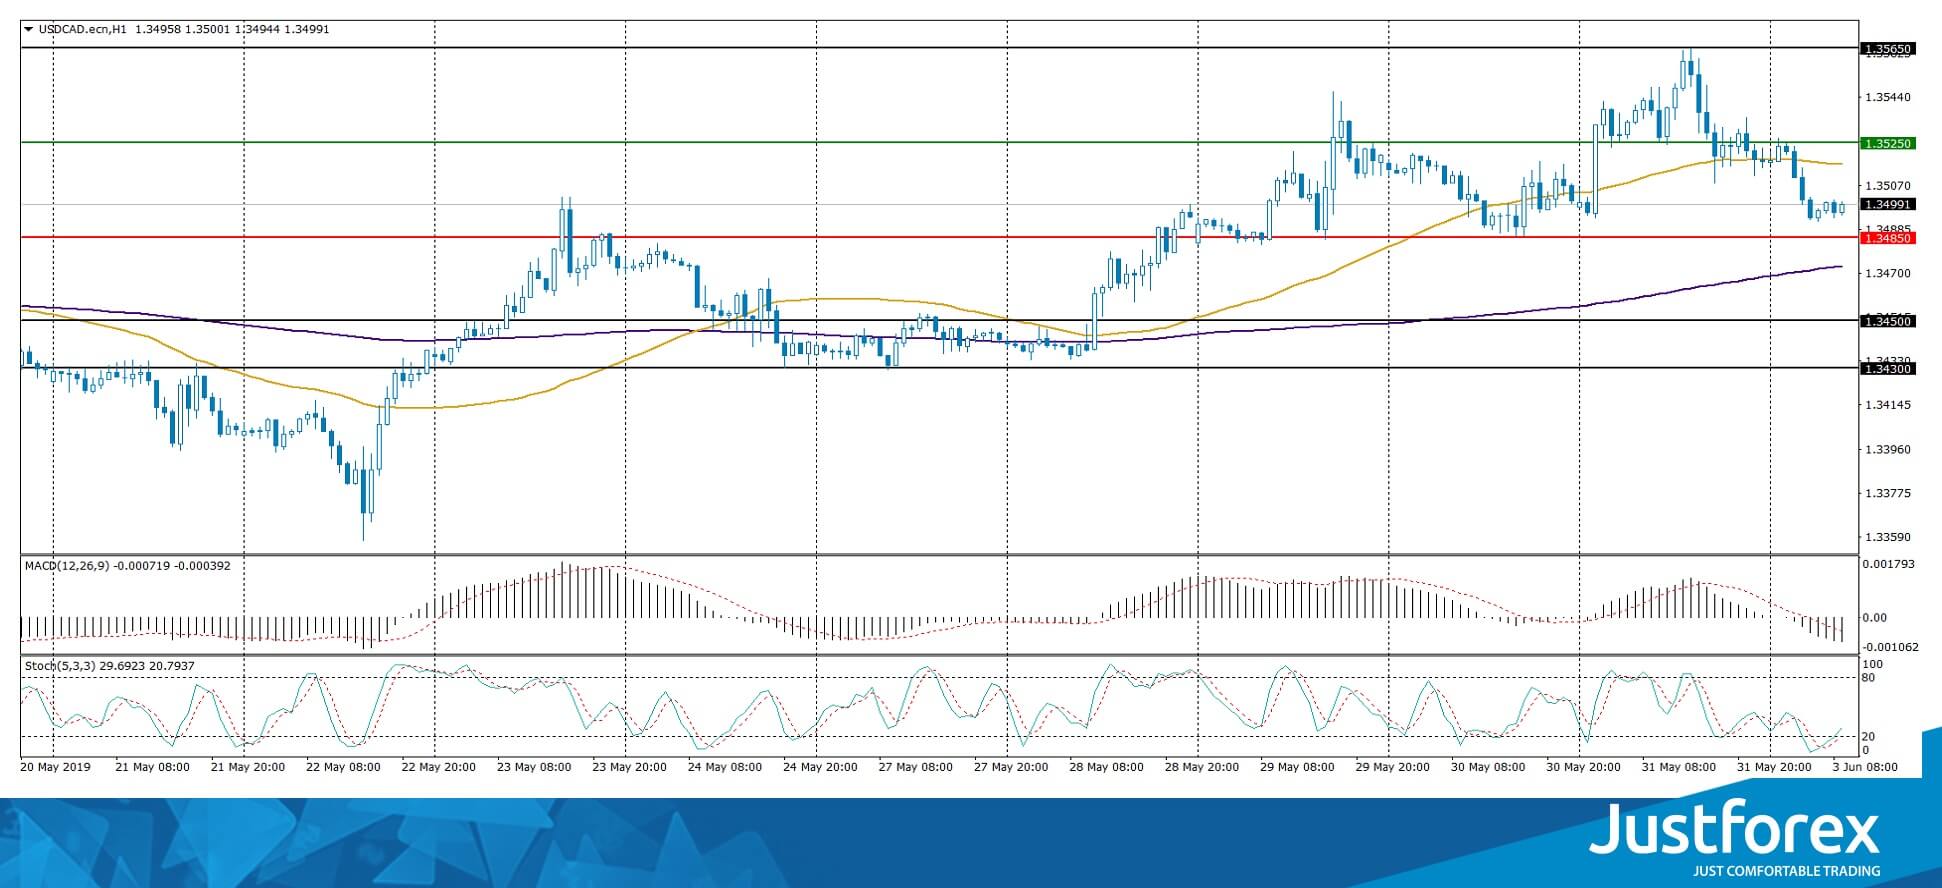
The indicators do not provide precise signals, the price fixed between 50 MA and 200 MA.
The MACD histogram is in the negative zone and keeps descending which gives a signal to sell USD/CAD.
The Stochastic Oscillator is in the oversold zone, the %K line is crossing the %D line. There are no signals at the moment.
Trading recommendations
Support levels: 1.34850, 1.34500, 1.34300
Resistance levels: 1.35250, 1.35650
If the price fixes below 1.34850 expect correction towards 1.34500-1.34300.
Alternatively, the qutoes can grow toward 1.35500-1.35700.
The USD/JPY currency pair
Technical indicators of the currency pair:
Prev Open: 109.596
Open: 108.264
% chg. over the last day: -1.21
Day's range: 108.070 – 108.343
52 wk range: 104.97 – 114.56
USD/JPY shows agressive sales. On Friday, May 31 the quotes fell by 130 points and updated the key minimums. The demand on the safe assets grew after a trading conflict escalation. Donald Trump aanounced a 5% fee on the imported goods from Mexico, starting on June 10. The quotes are consolidating around 108.000 with 108.400 acting as a local resistance. USD/JPY can descend further.
Keep an eye on the US news feed.
Economic Event (JPY) – 00:00 (GMT+3:00);
Economic Event (JPY) – 00:00 (GMT+3:00);
Economic Event (JPY) – 00:00 (GMT+3:00);
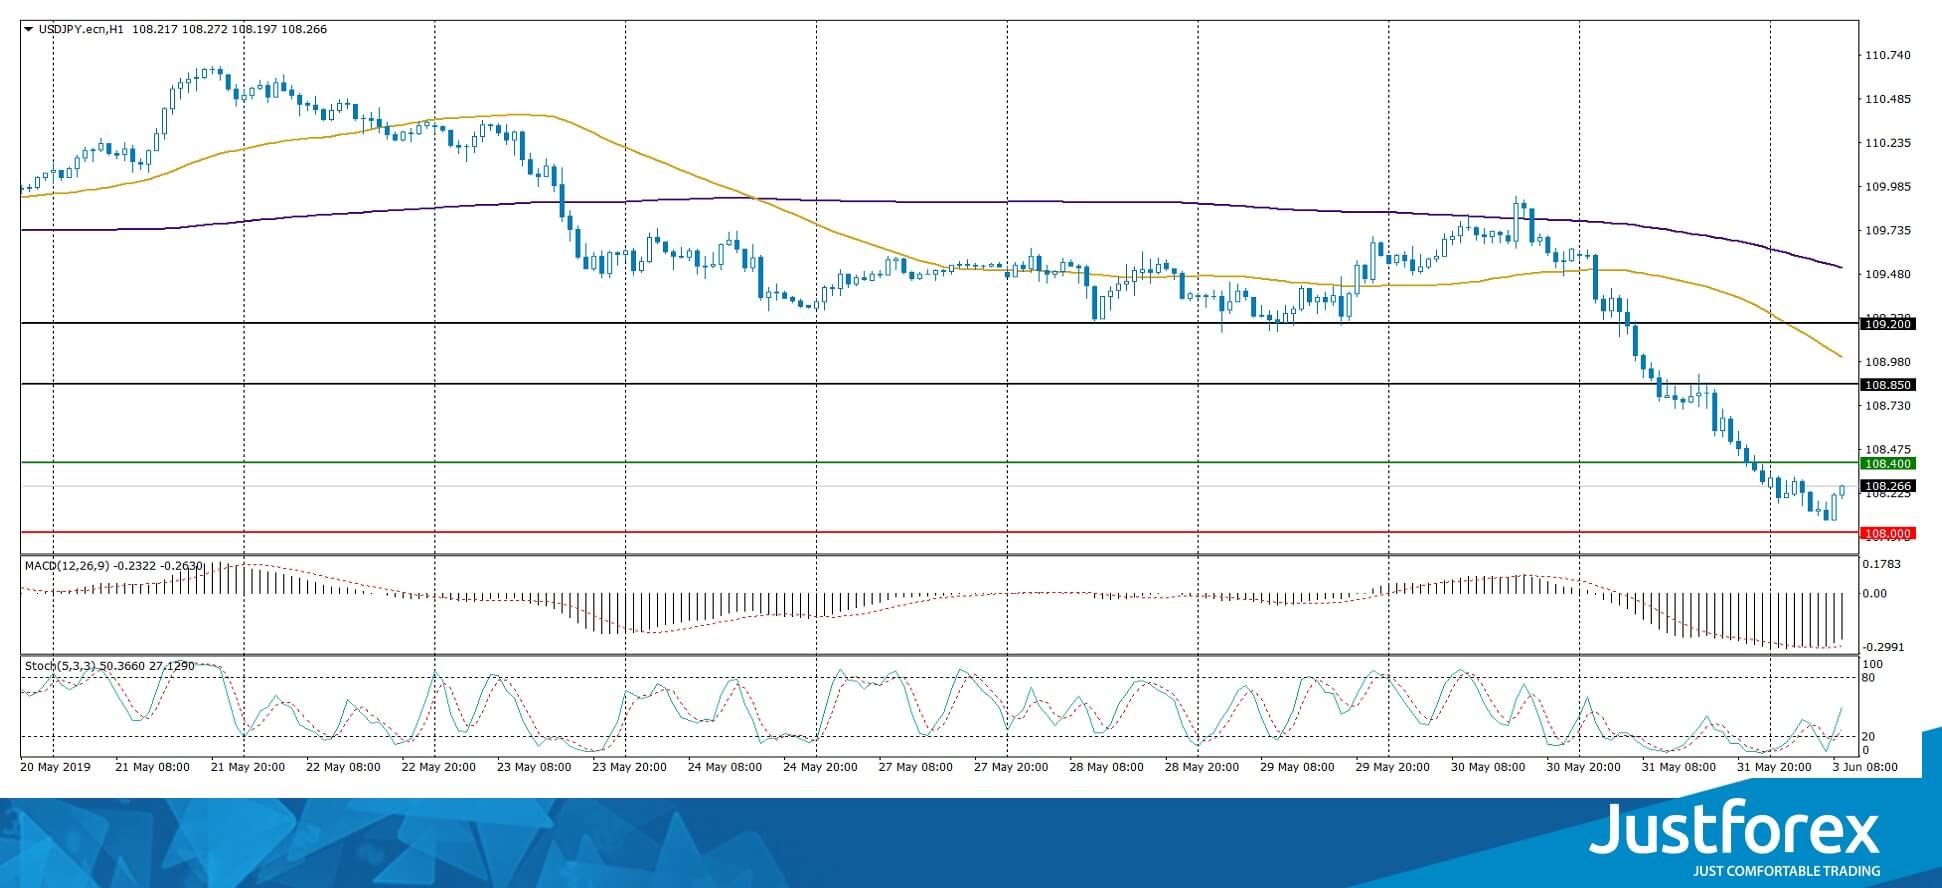
The price fixed below 50 MA and 200 MA which points to the power of the buyers.
The MACD histogram is in the negative zone but above the signal line which gives a weak signal to sell USD/JPY.
The Stochastic Oscillator started to leave the oversold aone, the %K line is above the %D line which points to a correction.
Trading recommendations
Support levels: 108.000, 107.500
Resistance levels: 108.400, 108.850, 109.200
If the price fixes below the round 108.000 expect further descend towards 107.600-107.400.
Alternatively, the qutoes can recover towards 108.700-109.000.
Trump Should Not Be Allowed To Architecture Brexit
The month of June has some serious work to do, recover from the brutal losses of the previous month. Safe haven is the name of the trade as China retaliated with tariff hikes on US goods on Saturday.
Treasury yields have tumbled and gold price has gone through the roof, thanks to the on going trade war between the two biggest economies of the world. Traders pushed the price of gold higher, surpassing the critical level of 1300 on Friday, as many investors see a higher chance of recession taking place if both countries do not change their stubborn behaviour.
Well, Beijing has always welcomed the idea of drawing the line under this on the basis of mutual respect. However, the Trump administration is determined to do whatever it takes to bully its way in, and so far, China has made it clear; Mr Trump has picked up a fight with a wrong country.
Nonetheless, the appetite for riskier assets have really waned among investors and the heavy sell off which we experienced on Friday is back on track.
US futures and European markets are trading lower as investors factor in the full force of the trade war storm. Mr Trump has also added India to his tariff list, it seems like this storm is going to destroy all the relationships which the previous administrations built.
Back in Europe, another storm is brewing, Donald Trump will be visiting the UK. The fear is that he is going to create more divide among the law makers and this is the last thing which Britain need. The fact is that why we need to care about who Mr Trump supports, the UK's future should not be architecture by someone like him. The country's law maker should understand this and they should not be afraid of him. They must stop him trying to divide the country.
Despite all of this, it is wise to keep an eye on Sterling's volatility, we are expecting higher volatility for the currency this week. Business owners do not want to leave Europe without any deal. Well most of them are actually hopeful that perhaps another meaningful referendum will be able to save the UK from this Brexit chaos.
To conclude, candidates for the British prime minister positions are busy in fine tuning their Brexit plans and this is going to keep the traders on the edge this week.
GBP/JPY Daily Outlook
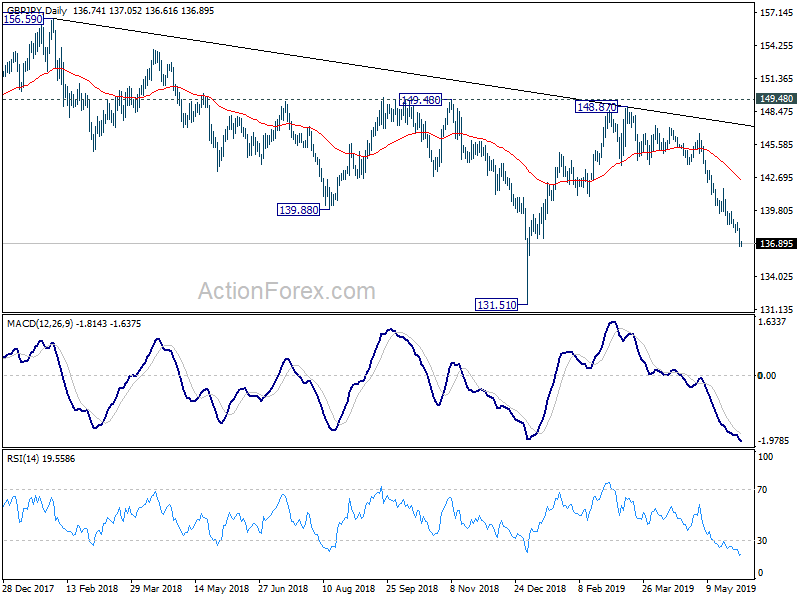
Daily Pivots: (S1) 136.18; (P) 137.22; (R1) 137.81; More...
Intraday bias in GBP/JPY remains on the downside at this point. Current fall from 148.87 is in progress for retesting 131.51 low. On the upside, break of 138.73 minor resistance will turn intraday bias neutral and bring consolidations first, before staging another fall.
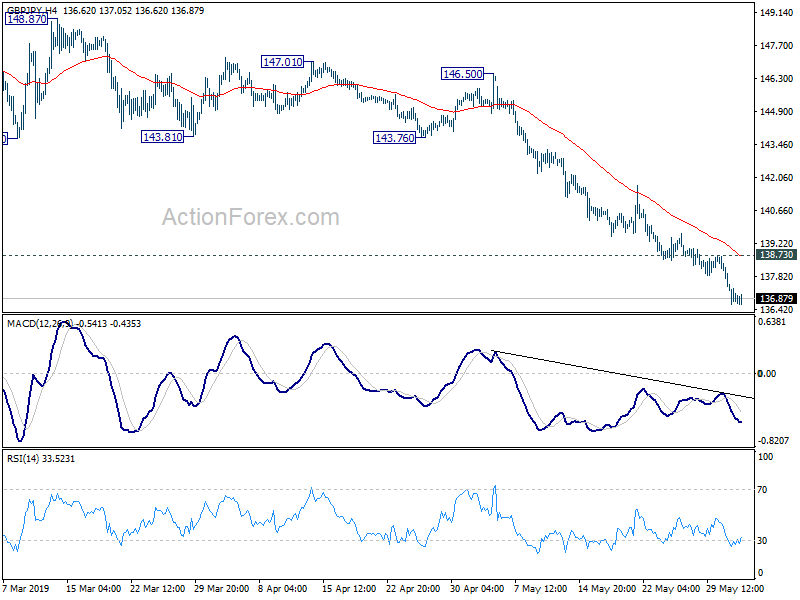
In the bigger picture, current development suggests that GBP/JPY medium term fall from 156.59 (2018 high) is still in progress. Break of 131.51 will target 122.36 (2016 low). Structure of such decline is corrective looking so far, arguing that it's just the second leg of consolidation from 122.36. Thus, we'd expect strong support from 122.36 to contain downside to bring reversal.
EUR/JPY Daily Outlook
Daily Pivots: (S1) 120.56; (P) 121.31; (R1) 121.69; More....
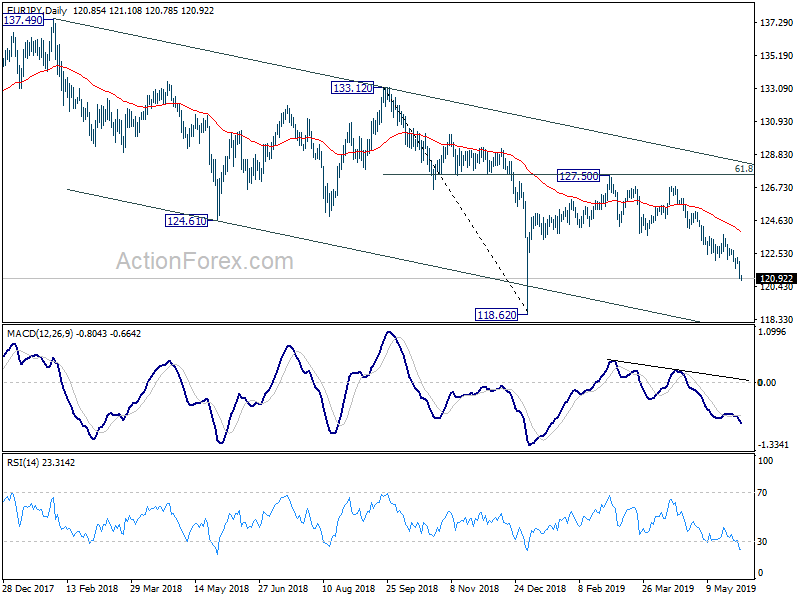
Intraday bias in EUR/JPY remains on the downside as this point. Current fall from 127.50 is targeting a retest on 118.62 low next. On the upside, above 122.08 support turned resistance will turn intraday bias neutral first. But recovery should be limited below 123.73 resistance to bring fall resumption.
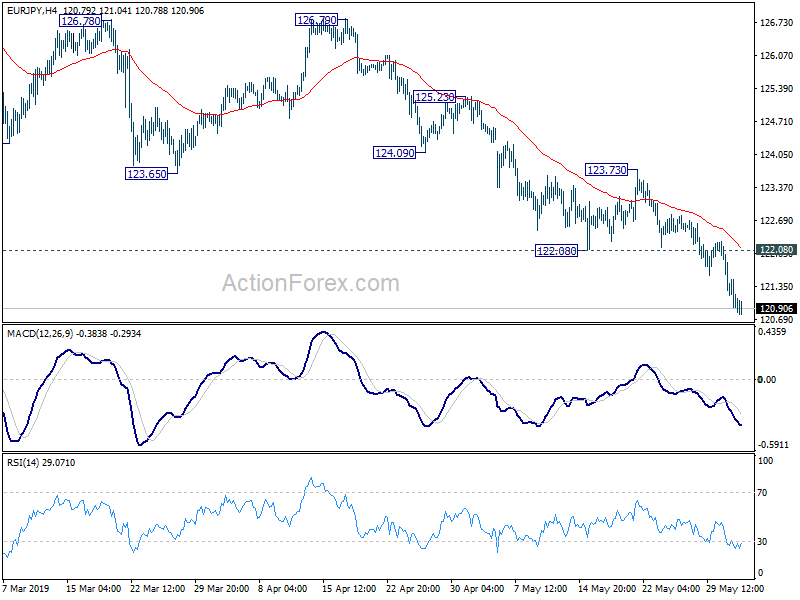
In the bigger picture, down trend from 137.49 is still in progress with the cross staying inside long term falling channel. Break of 118.62 will extend the fall to 109.48 (2016 low). On the upside, break of 123.73 resistance is needed to be the first sign of medium term reversal. Otherwise, outlook will remain bearish in case of strong rebound.
USD Weakens While Yen Strengthens As Refuge To Safety
JPY strengthened the most since mid-January as the flight to safety caused by the trade wars, continued on Friday and during today’s Asian session. US and Mexican officials prepare for negotiations, after the US announced its intentions to impose tariffs on Mexican imports. The US tariffs on Mexican imports caught the markets by surprise analysts noted, as Mexico is considered a major trading partner of the US. Mexico’s president had hinted that his country could tighten controls at the US border, in an effort to defuse the tensions with President Trump. Simultaneously the US-Sino trade wars are also still ongoing, with eyes turned to the Osaka G20 meeting and a possible meeting between the leaders of the US and China. If tensions continue to fuel a risk averse climate in the markets, then safe havens could strengthen further. USD/JPY dropped below the 108.50 (R1) support line (now turned to resistance). We could see the pair maintaining its current bearish trendline and for our opinion to change we would require a clear breaking of it. Please note that the RSI indicator in the 4 hour chart is below the reading of 30, implying a rather overcrowded short position. Should the bears control the pair’s direction, we could see it breaking the 107.90 (S1) support line and aim for the 107.20 (S2) support barrier. Should the bulls dictate the pair’s direction, we could see it breaking the 108.50 (R1) line and aim for the 109.15 (R2) resistance hurdle.
RBA Interest rate decision
In the late Asian session tomorrow (04:30,GMT), RBA is to announce its interest rate decision and is widely expected to cut rates by 25 basis points reaching +1.25%, if compared to current level of 1.50%. The market seems to have priced in such a development and currently AUDOIS imply a probability of 85.68% for such a scenario. According to analysts the bank’s intention may be to cut rates further and some even speculate up to 3 rate cuts in 2019. Should the bank cut rates and accompany its decision with a dovish accompanying statement to pave the way for further rate cuts, we could see the Aussie weakening substantially. AUD/USD broke its sideways movement yesterday by breaking the 0.6920 (S1) resistance line (now turned to support). We could see the pair weakening in anticipation of the RBA interest rate decision, yet trade tensions could also affect the pair’s direction. Should the pair’s long positions be favored by the market, we could see it aiming for the 0.7000 (R1) resistance line. Should the pair come under the selling interest of the market, we could see it breaking the 0.6920 (S1) support line and aim for the 0.6860 (S2) support level.
Other economic highlights, today and early tomorrow
Today during the European session we get UK’s manufacturing PMI for May and in the American session we get the US ISM manufacturing PMI for May.
As for the rest of the week:
On Tuesday, we get from the UK the Construction PMI for May and Eurozone’s preliminary CPI for May. On Wednesday, we get from Australia Q1’s GDP from the UK the services PMI for May and the US ISM non Mfg PMI for May. On Thursday, we get from Australia April’s trade balance, Germany’s industrial orders for April, ECB’s interest rate decision and from Canada the Ivey PMI for May. On Friday, we get from Germany the industrial production for April, Germany’s Trade balance for April, the US employment report for May, as well as Canada’s employment data for May.
AUD/USD H4
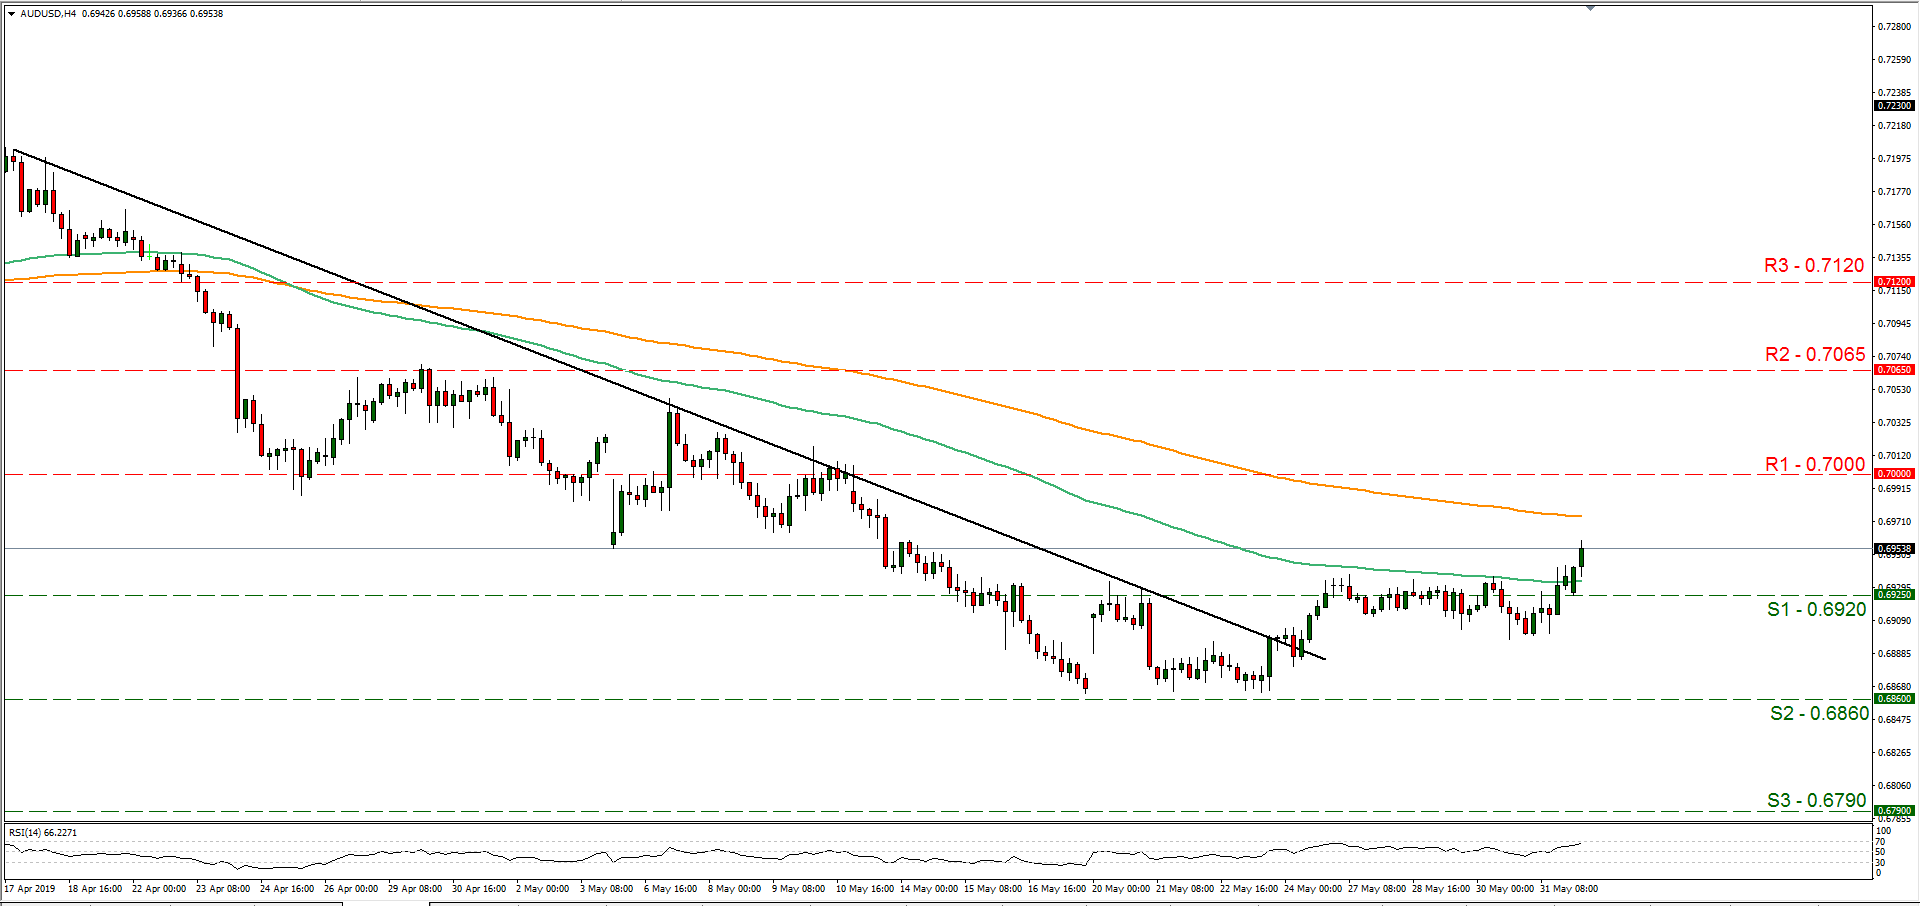
Support: 0.6920 (S1), 0.6860 (S2), 0.6760 (S3)
Resistance: 0.7000 (R1), 0.7065 (R2), 0.7120 (R3)
USD/JPY H4
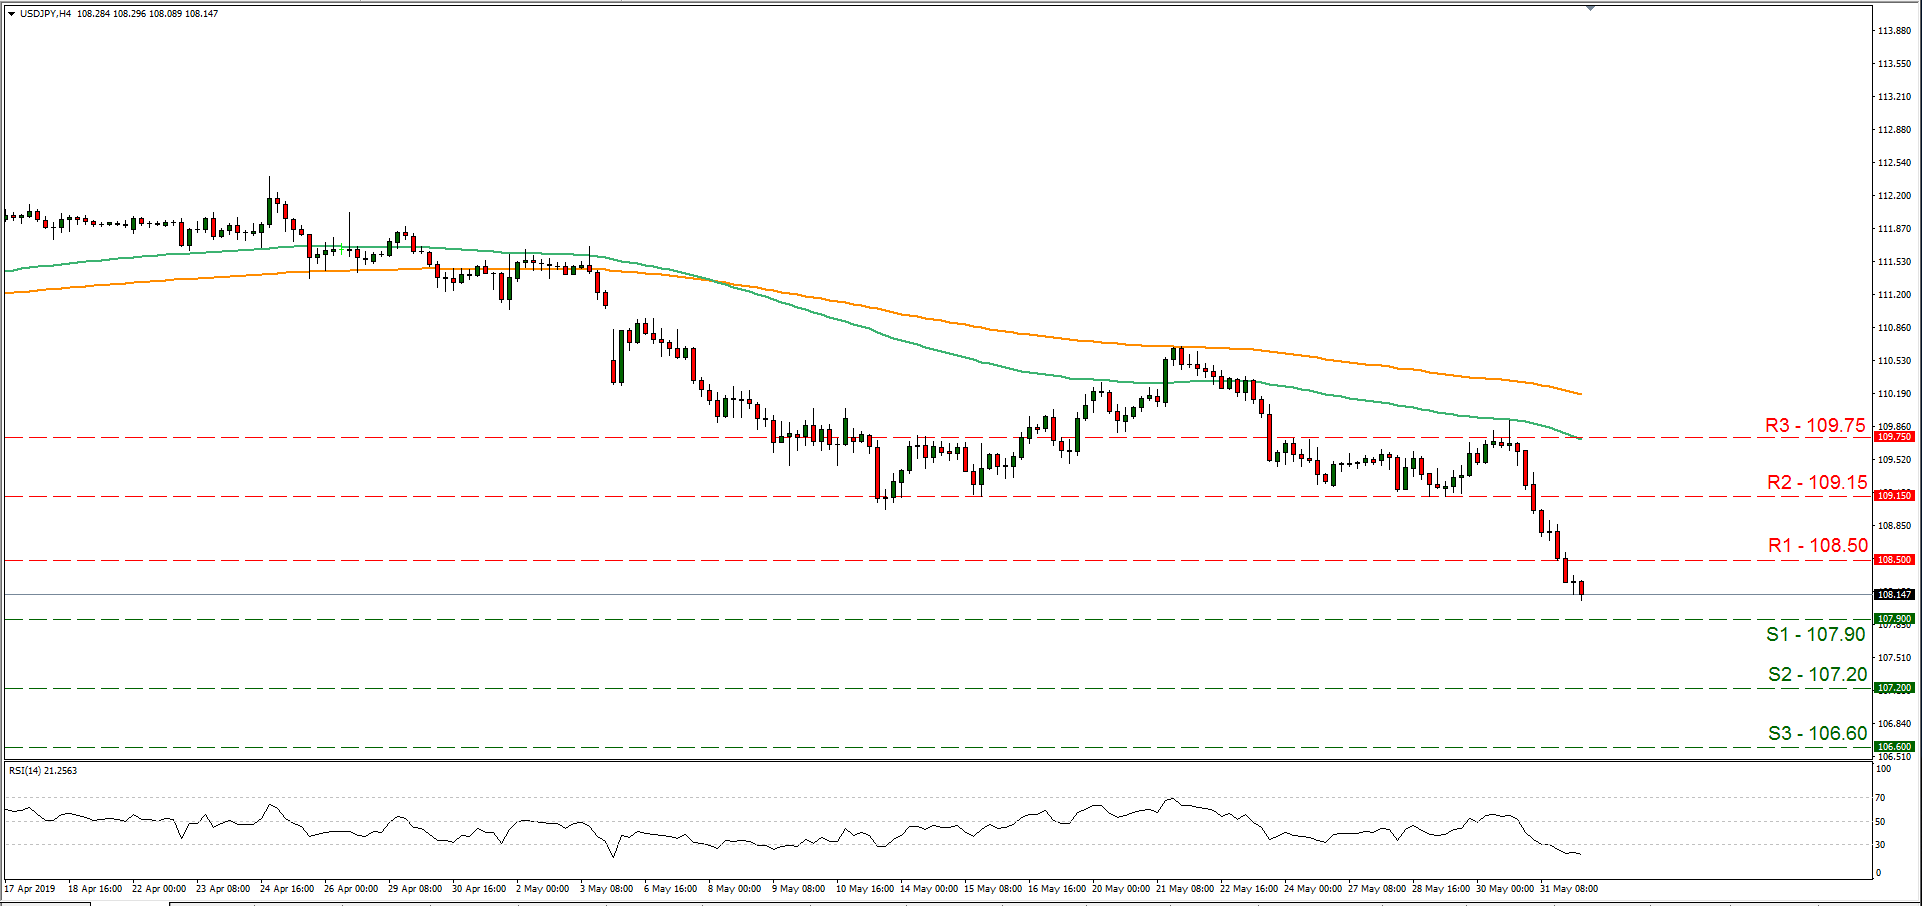
Support: 107.90 (S1), 107.20 (S2), 106.60 (S3)
Resistance: 108.50 (R1), 109.15 (R2), 109.75 (R3)
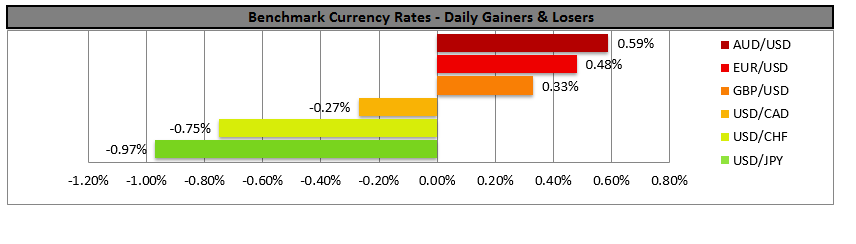
USDJPY Plummets Towards New 5-Month Trough Around 108
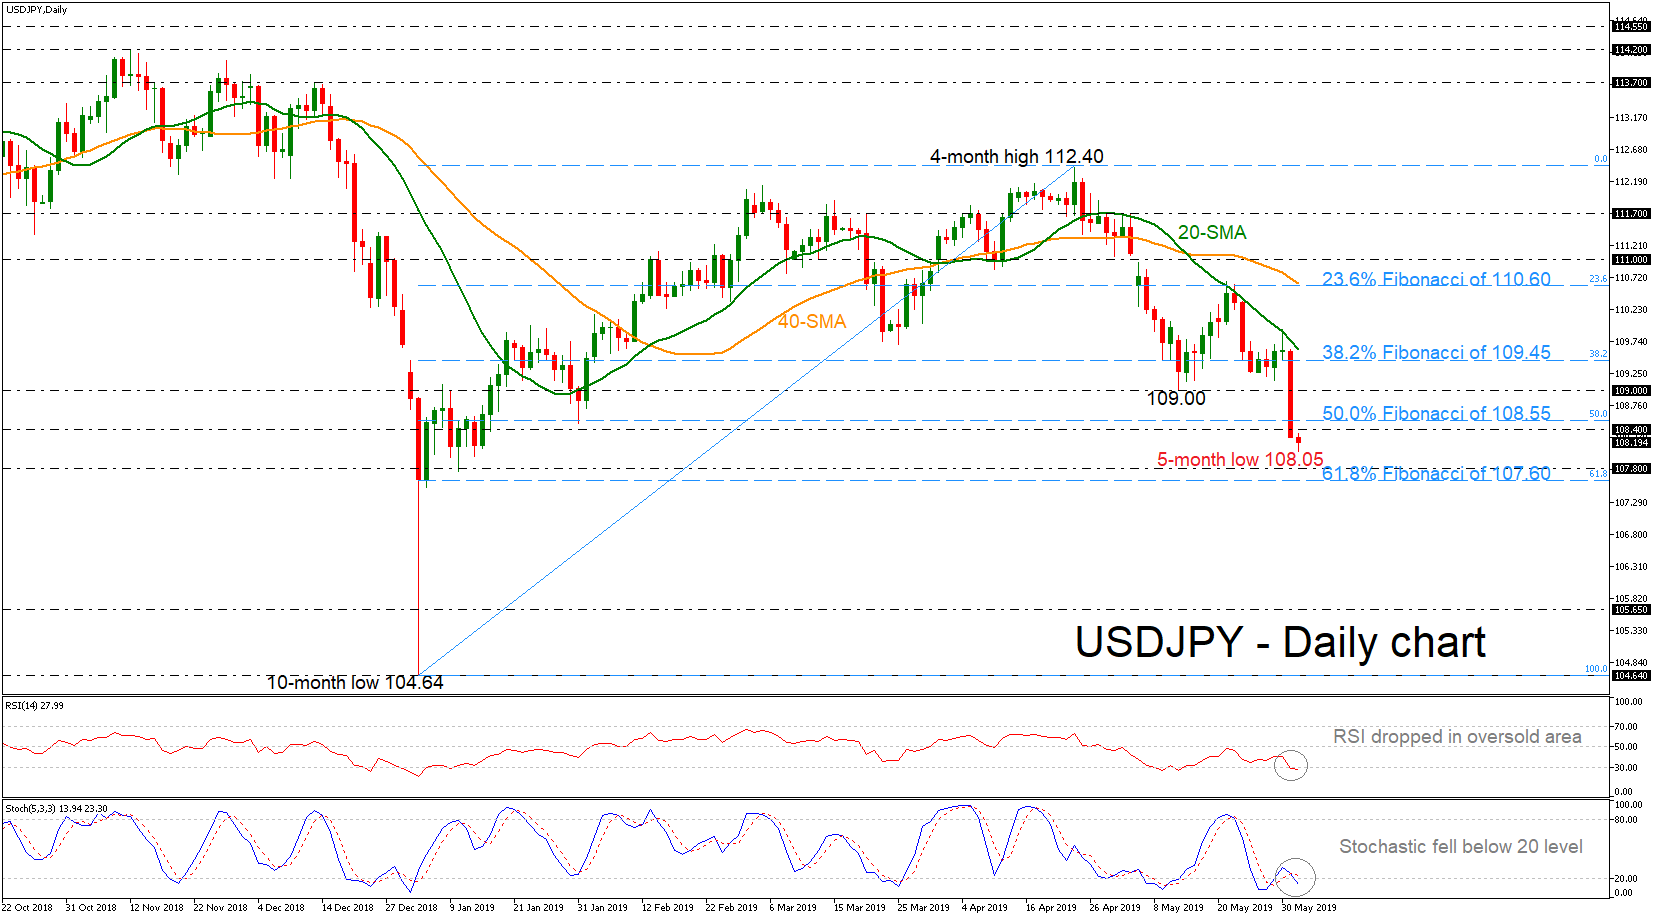
Since its deep fall towards five-month lows near 108.00 today, USDJPY has been plunging back below the 50.0% Fibonacci retracement level of the upleg from 104.64 to 112.40 near 108.55, creating a base beneath the short-term moving averages. The technical picture supports that the aggressive downfall is likely to continue in the short-term.
The %K line of the stochastic oscillator has fallen sharply into oversold levels and posted a bearish crossover with the %D line. Also, the RSI is dropping below the 30 level, suggesting more downside movement.
If prices continue to head lower, support should come from the 107.80 support and the 61.8% Fibonacci region of 107.60. A drop below this area would reinforce the short-term bearish view and open the way towards the 105.65 barrier, taken from the bottom on April 2018 before edging until the ten-month low of 104.64.
However, should an upside reversal take form, immediate resistance will likely come from the 108.40 – 108.55 zone. A break above these levels could send the market until the 109.00 psychological hurdle before re-challenging the 38.2% Fibonacci of 109.45.
Summarizing, traders should be waiting for a strong rebound before placing positive orders as the recent profile is negative in the near-term. A daily close under the 61.8% Fibonacci (107.80) could endorse the bearish outlook.