Sample Category Title
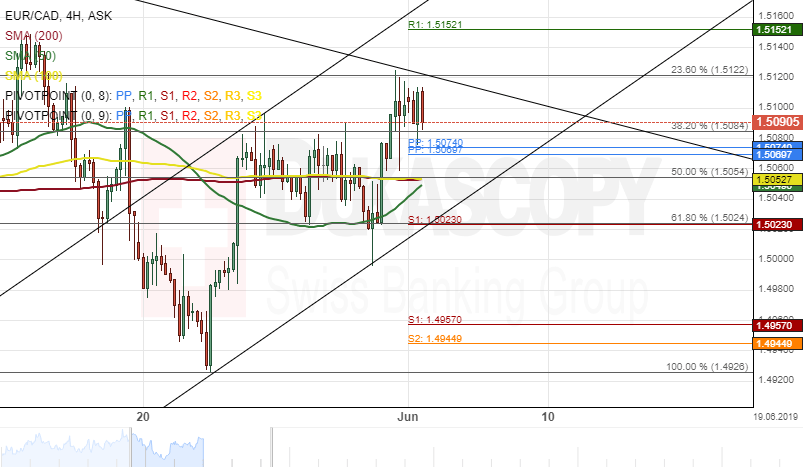
EUR/CAD 4H Chart: Reveals New Ascending Channel
Since May 27, the single European currency has appreciated about 1.33% in value against the Canadian Dollar. The currency pair tested the 23.60% Fibonacci retracement level at 1.5122.
Everything being equal, it is likely that the EUR/CAD exchange rate will continue to gain strength within this week's trading sessions. The potential target will be at 1.5182.
However, it is likely that the currency exchange rate makes a brief retracement towards a support cluster formed by the 50.00% Fibonacci retracement level and the combination of the 100– and 200-hour SMAs at 1.5054 in the short-term.
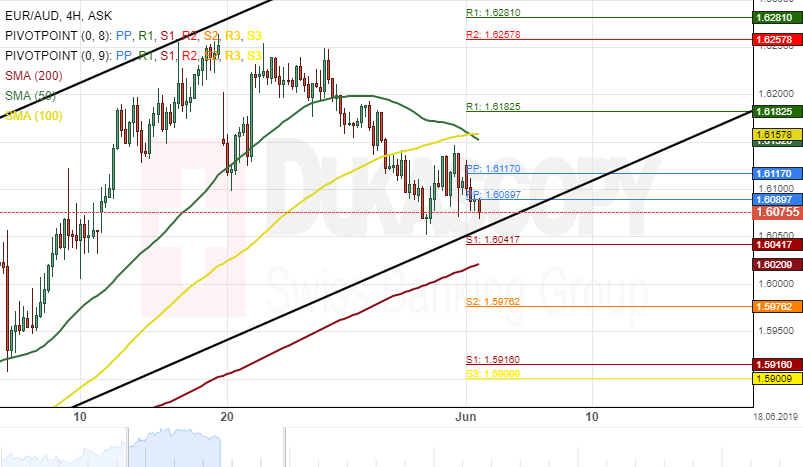
EUR/AUD 4H Chart: Potential Upside Reversal
During the past week, the common European currency has depreciated 180 base points against the Australian Dollar. The currency pair was near the bottom border of an ascending channel pattern at 1.6089 during the morning hours of Monday's trading session.
If the support level formed by the lower boundary of the channel pattern holds, a potential upside reversal will occur this week. The upward swing will be near a swing high at 1.6257.
However, if the currency exchange rate breaks the ascending channel pattern, bearish traders could aim for the weekly S2 at 1.5979 in the short-term.
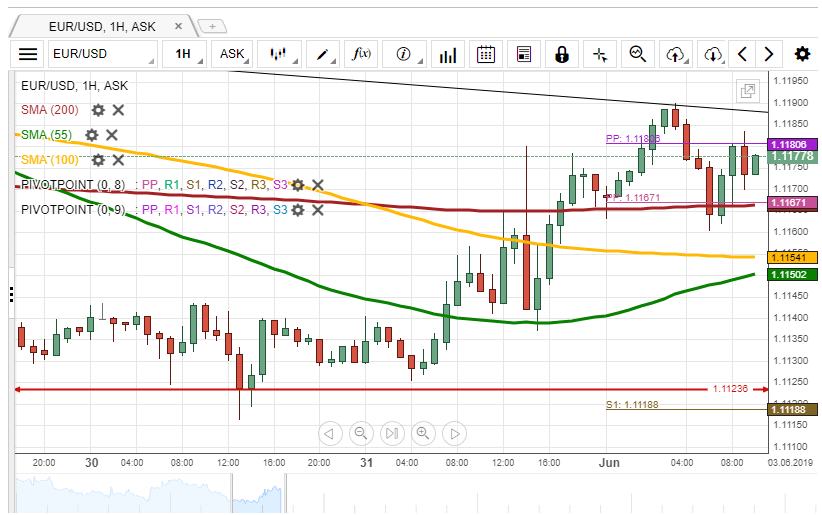
EUR/USD Tests Short-Term Channel
At the end of the previous week, the EUR/USD currency pair tested the upper boundary of the short-term descending channel at the 1.1190 mark.
From a theoretical point of view, it is likely, that a reversal south should occur within the following trading hours. However, note, that the pair has to surpass the support luster formed by the 55-, 100– and 200-hour SMAs, as well weekly PP in the 1.1150/1.1167 range.
If the given support holds, it is likely, that the exchange rate could try to breach the given channel north. If id does not hold, it is expected, that the rate could reach the Fibonacci 38.20% retracement at 1.1200.
GBP/USD Pressured By 200-Hour SMA
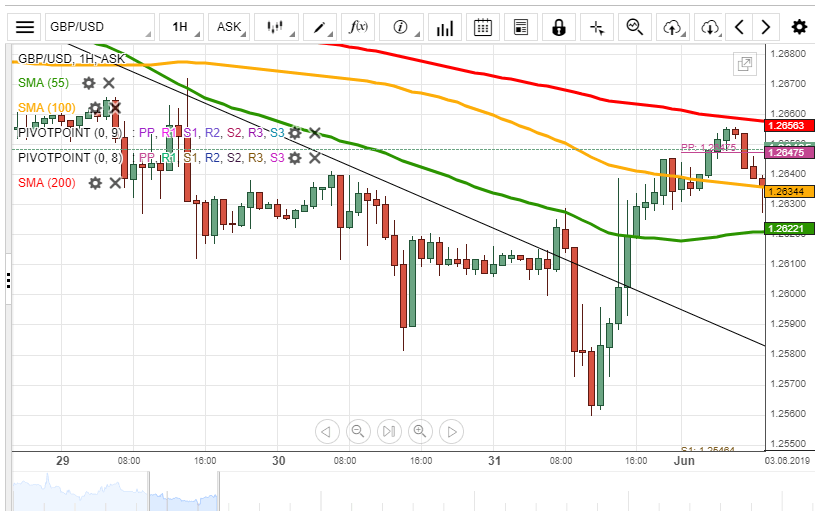
During Friday, the GBP/USD exchange rate breached the short-term descending channel north. During today's morning, the rate was testing the resistance level formed by the 200-hour SMA and the weekly PP at 1.2648.
Note, that the currency pair is supported by the 55– and 100-hour moving averages, currently located circa 1.2630. Thus, the pair could breach the given resistance and maintain its growth. A possible upside target is the 1.2700 level.
Otherwise, it is expected, that the rate could trade sideways round the given moving averages in the short-term. If the given support does not hold, the pair could decline to the 1.2580 level.
USD/JPY Could Extend Gains
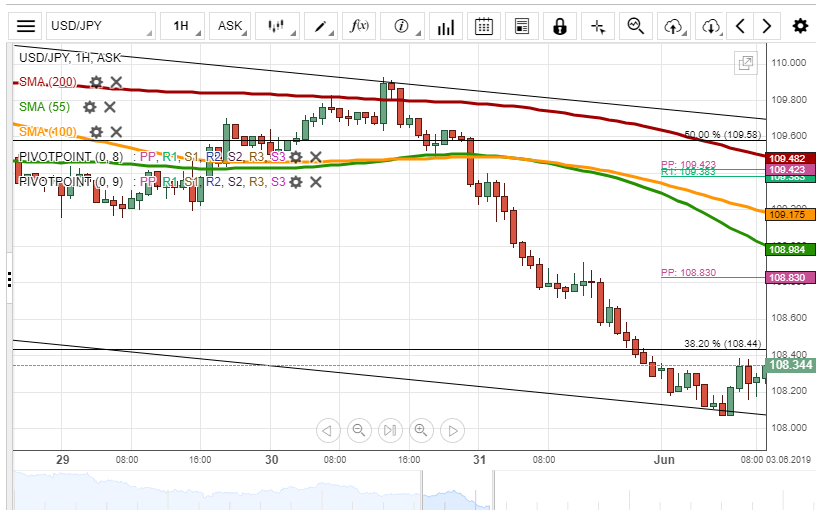
On the previous trading session, the USD/JPY currency pair traded down and reached the Fibonacci 38.20% retracement at 108.44. During Monday's session, the pair reversed north from the lower boundary of the short-term descending channel at 108.10.
From a theoretical perspective, it is expected, that the exchange rate could continue to extend gains. In this case, the rate has to surpass the given Fibonacci retracement.
If the given level holds, it is likely, that the pair could trade down along the lower channel line located circa 108.00.
It is unlikely, that the rate could drop lower than the 107.73 due to the support of the weekly S1.
XAU/USD Likely To Trade Sideways
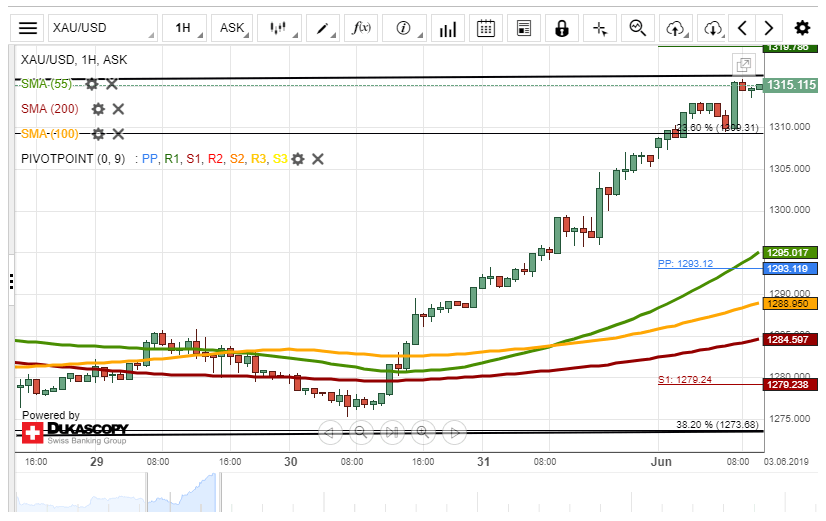
During Friday, the XAU/USD exchange rate surpassed important psychological level at the 1,300.00 mark. During Monday's morning, the rate reached the upper boundary of the short-term ascending channel at 1,316.34.
From a theoretical point of view, it is expected, that a reversal south could occur in the nearest future. In this case, the rate has to surpass the Fibonacci 23.60% retracement at 1,309.31.
If the given support level holds, it is likely, that gold could trade sideways between it and the upper channel line.
It is unlikely, that the price for gold could jump higher than 1,319.79 due to the resistance of the monthly R1.
Gold Advances Considerably Towards 2-Month High
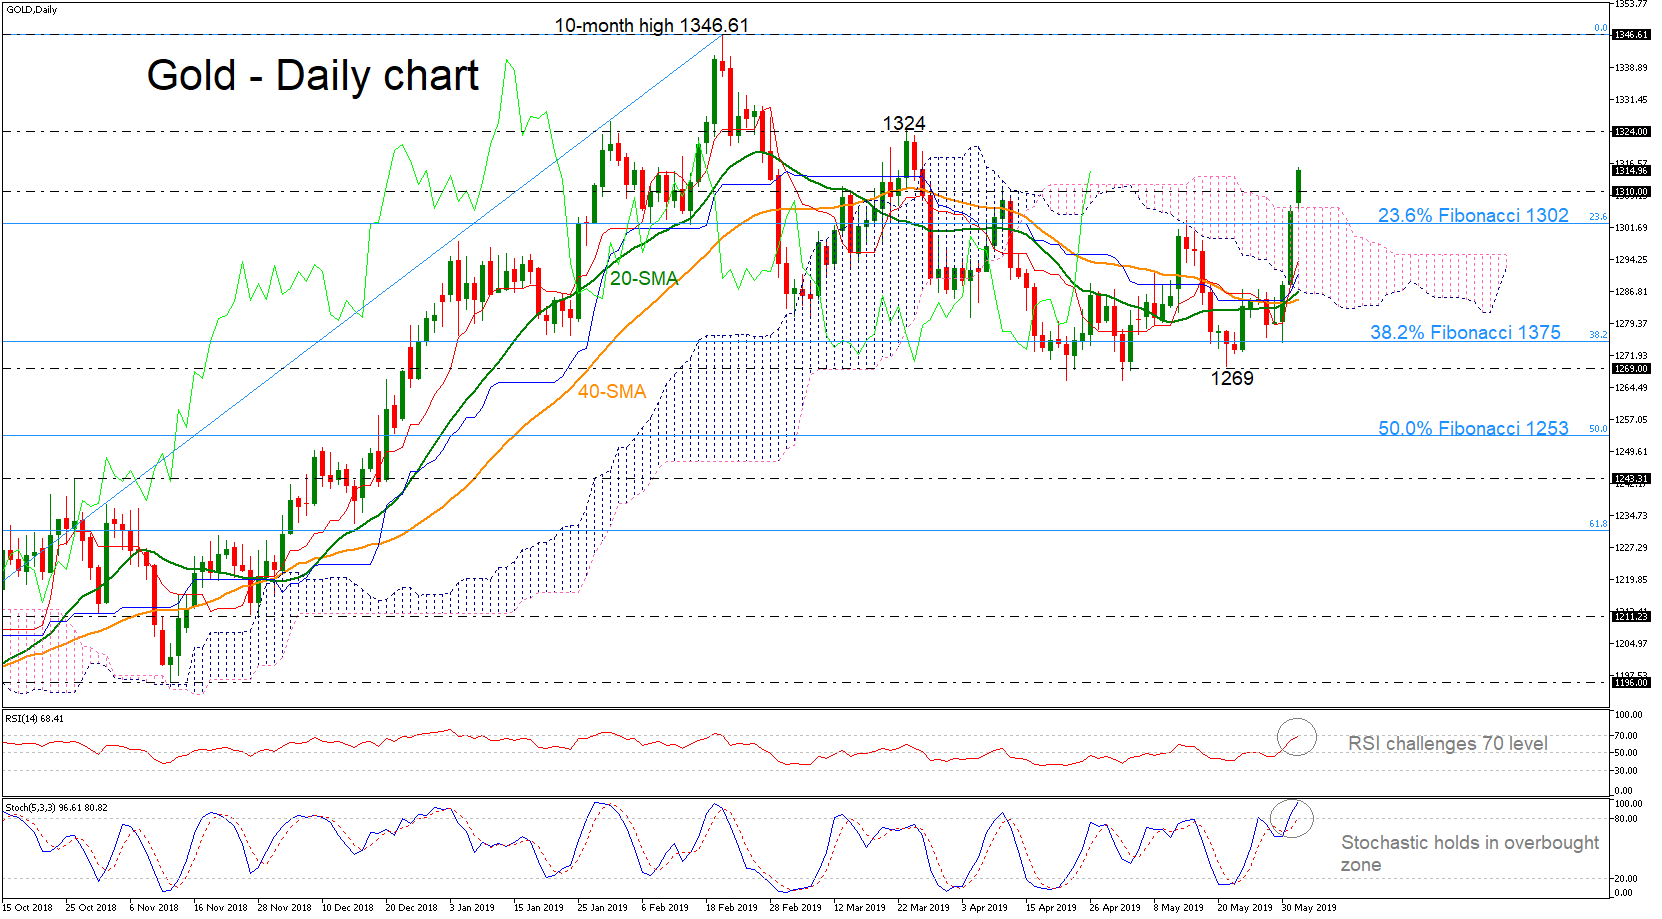
Gold prices have been in a flying mode over the last couple of days, hitting a new two-month high around 1,315. The yellow metal jumped above the Ichimoku cloud and the 23.6% Fibonacci retracement level of the upleg from 1,160 to 1,346.61, near 1,302 as well as above the 1,310 barrier.
The RSI and the stochastic oscillator signal that room for improvement is limited as the former is approaching the 70 overbought mark and the latter is rising above the 80 level in the daily timeframe. Yet the bullish cross between the 20- and 40-day simple moving averages is a positive signal for the market trend.
If the price continues the recent sharp positive movement the door could open for the 1,324 resistance, identified by the peaks on March 25. Should the bulls beat this level, the next level to watch should be the ten-month high of 1,346.61.
In case of a bearish correction below the 23.6% Fibonacci (1,302), prices could touch the 38.2% Fibonacci of 1,375. Another key barrier is located around 1,269 taken from the latest lows.
In the very short-term picture, the sentiment turned bullish from neutral.
The US Dollar Is In The Red Due To Trade Conflicts
The US dollar declined on Friday against a basket of major currencies due to threats by US President Donald Trump to impose duties on Mexican goods. The dollar index (#DX) closed in the negative zone (-0.39%). The demand for “safe” assets is still high. The Swiss franc and the Japanese yen have significantly strengthened against the greenback. US trade conflicts with China and Mexico had a negative impact on economic indicators. So, on Friday, Michigan consumer expectations and sentiment were published, which counted to 93.5 and 100.0 in May, respectively, and were worse than the expected values of 95.2 and 102.0.
On Friday, Canada GDP was also published. Thus, GDP (y/y) grew by 1.3%; GDP (q/q) increased by 0.5%, which turned out to be better than the forecasted growth by 0.4%. Today, during the Asian trading session, Chinese Caixin manufacturing PMI has been published, which has counted to 50.2 and has occurred to be better than the forecasted value of 50.0. We expect a number of important releases on economic activity.
The "black gold" prices are declining. At the moment, futures for the WTI crude oil are testing the mark of $53.00 per barrel.
Market Indicators
- On Friday, aggressive sales were observed in the US stock market: #SPY (-1.35%), #DIA (-1.45%), #QQQ (-1.60%).
- The 10-year US government bonds yield fell significantly. Currently, the indicator is at the level of 2.08-2.09%.
The news feed on 2019.06.03:
- German manufacturing PMI at 10:55 (GMT+3:00);
- UK manufacturing PMI at 11:30 (GMT+3:00);
- US ISM manufacturing PMI at 17:00 (GMT+3:00).
Threat of Dumping US Treasury Signals China is Running Out of Weapons in Trade War
China’s White Paper, entitled “China's Position on the China-U.S. Economic and Trade Consultations” on recent escalations of trade war has weighed on the fragile market. While the majority of market participants judges that China has opted for a hardliner approach, interpretations of the outcomes are diverse. While some judge that the deadlock would be dragged longer, others believe that this would force the US return to the negotiation table. Meanwhile, the market again discusses the potential weapons China could adopt to retaliate. Besides retaliatory tariff, many believe that sharp depreciation of renminbi and reduction of holdings of US Treasury bonds are China’s “nuclear options” in the trade war. In our opinion, these moves would be self-defeating for China, if not internecine, hurting both countries.
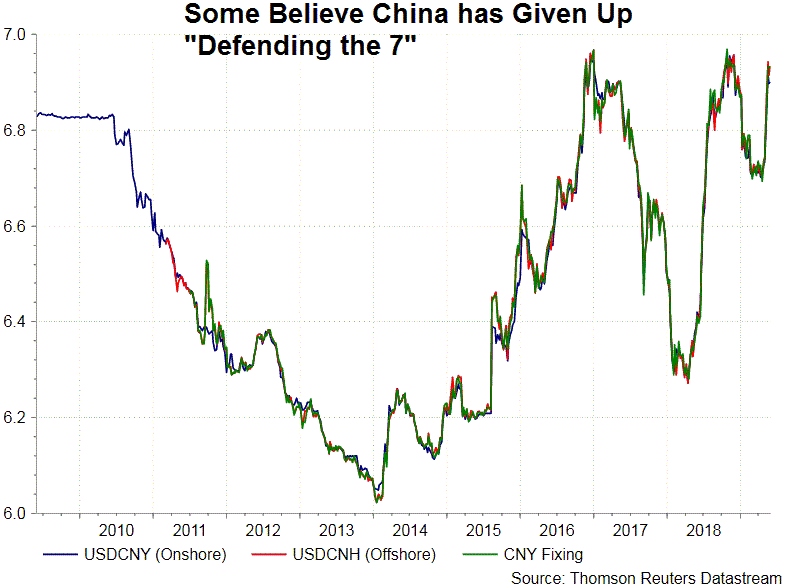
As mentioned in the previous report, we mentioned that depreciation of renminbi is a dilemma for the Chinese government. While a weaker renminbi might help exports and retaliate to US demand for a stronger renminbi, excessive depreciation would trigger capital outflow and instability in China’s domestic financial markets. USDCNY rallied after Donald Trump’s tariff announcement on May 10, before stabilizing. The pair has continued hovering below 7 since then. There have been rumors that “defending the 7” is no longer a core mission in the authority, amidst the escalations of trade war. Yet, even a breach of 7 would not change China’s strategy to maintain stable renminbi valuation.
FX Reserve as a Tool to Maintain Renminbi Stability
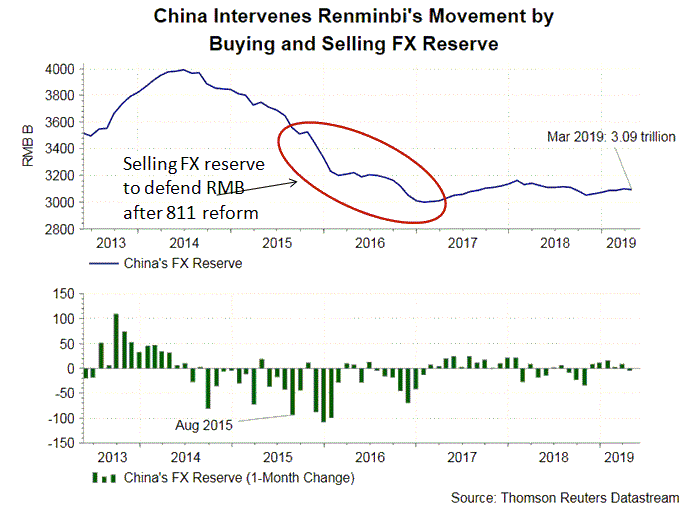
Intervention of the FX reserve is a key strategy that the government uses to maintain a stable currency. Back in 2015, the disastrous reform on renminbi valuation had triggered massive amounts of capital flowing out of China. Originally, renminbi’s daily fixing was determined by asking market makers for price quotations before the market opens. Under the new arrangement in August 11m 2015, it was determined by three factors, namely, closing rate of the previous day, the demand and supply of the FX market, and the exchange rate of the world’s major currencies. While it appears that more “market-determined” ingredient has been added, the government also announced an one-off devaluation of its currency by -2%. It is this move that had shocked the market, drive global capital away and causing a sharp selloff in renminbi. PBOC had to aggressively sell its FX asset in order to stabilize the market. China’s FX reserve contracted an aggregate of -US$830B in 2015 and 2016. During the period, renminbi depreciated -12% against US dollar. The selling process had not finished until FX reserve fell below US$ 3 trillion in January 2017.
Dumping US Treasury Not Much a Threat
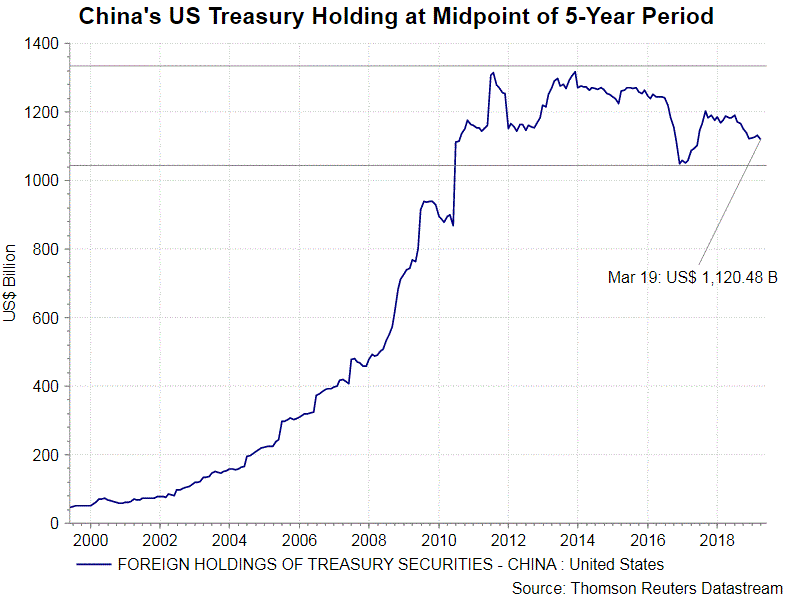
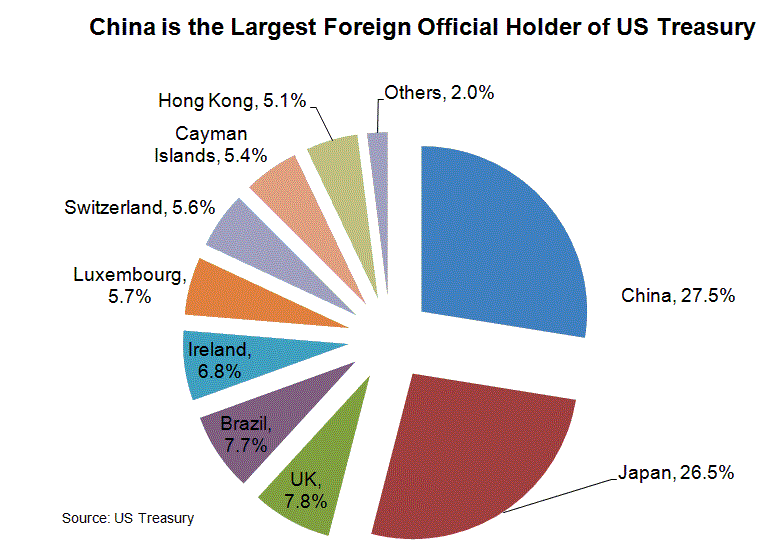
China is the largest foreign holder of US Treasury (including bills, notes and bonds). As of March 2019, the country holds US$1.12 trillion, or 28% to total foreign holdings. However, the size is less than 1% of US$14 trillion US Treasury market. About 70% of the market is held by domestic financial institutions. For instance, the Federal Reserve alone holds over US$ 2 trillion of the share. Considering the small size of Chinese holdings in the huge and deep US Treasury market, the Chinese authority realizes that this move is not effective. Despite monthly fluctuations, China's holding has been stable, hovering around the midpoint of 5-year range.
Despite the twin deficits, the USD has remained the world’s largest reserve currency. The US Treasury market remains the biggest, deepest and most liquid, making it a virtually “risk-free” asset. These characteristics not only are crucial for China which rely heavy on intervention of FX reserve to stabilise its currency, but also for it to convert the enormous exports revenue, mainly earned from the US, to low- risk, highly- liquid assets with stable return.
To us, strong renminbi depreciation and selling of US Treasury are contradictory to China’s exchange and financial policies. Nonetheless, media in China, as well as a number of economists claimed to have close tie with authority, have not tired of proposing these as retaliatory measures against the US. Such phenomenon only reveals that China is running out of appropriate measures to handle the current situation
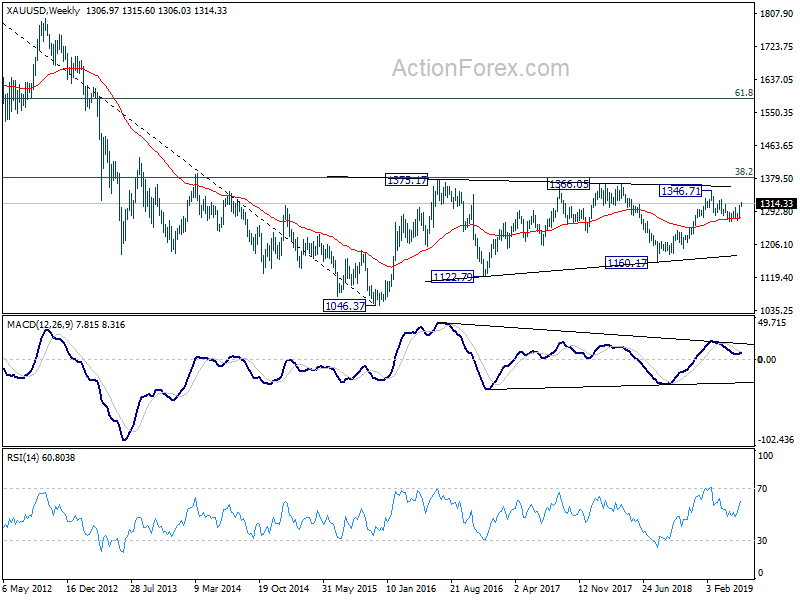
Gold breaches 1315 as rebound accelerates, heading back to 1346.7 resistance
Gold's strong rally since last week firstly suggests resumption of rebound from 1266.26. More importantly, it argues that corrective fall from 1346.71 has completed at 1266.26 already. Further rise is now in favor back to retest 1346.71 first.
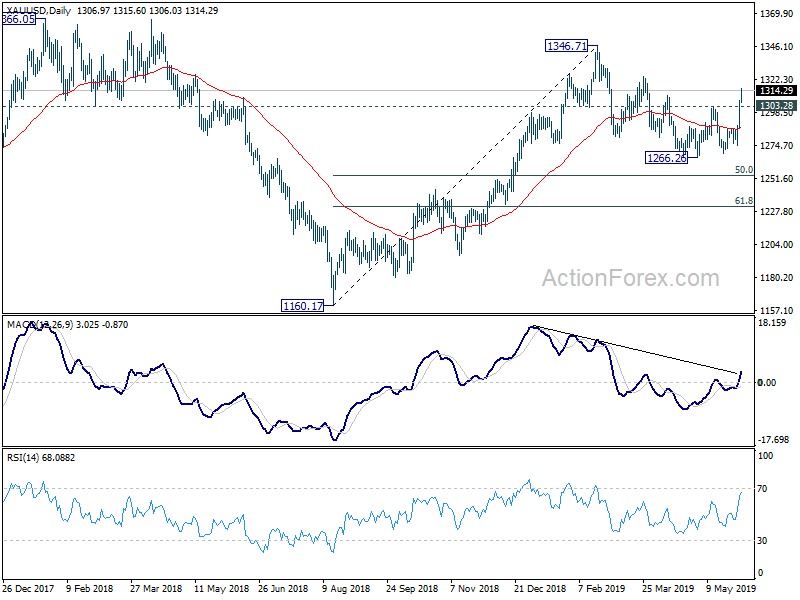
The strong support from 55 week EMA is taken as a rather bullish signal. It's also raising the change that gold would finally overcome long term fibonacci resistance of 38.2% retracement of 1920.70 (2011 high) to 1046.37 (2015 low) at 1380.36. If that happens, it could also markets bearish reversal in Dollar for medium term term. But of course, gold has to take out above mentioned 1346.71 near term resistance first. Let's see how it goes.