Sample Category Title
Forex Technical Analysis: EUR/USD, USD/JPY, GBP/USD
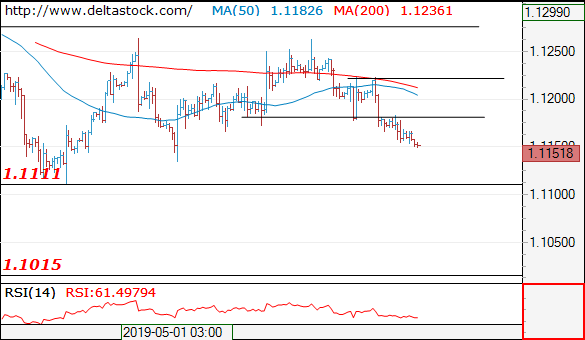
EUR/USD
Current level - 1.1151
The downtrend is intact, heading towards 1.1110. Initial reistance lies at 1.1180.
| Resistance | Support | ||
| intraday | intraweek | intraday | intraweek |
| 1.1180 | 1.1330 | 1.1110 | 1.1010 |
| 1.1275 | 1.1450 | 1.1110 | 1.0860 |
USD/JPY
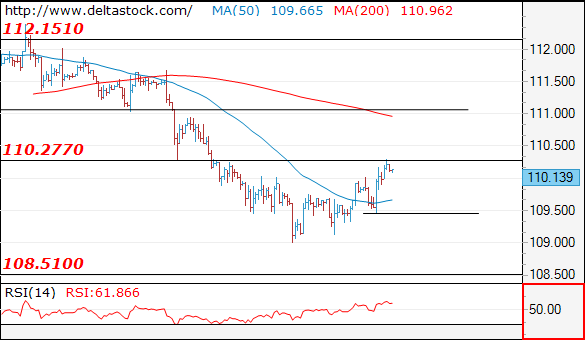
Current level - 110.13
The initial test of 110.30 failed and a break through 109.50 crucial low will signal a reversal, for 108.50.
| Resistance | Support | ||
| intraday | intraweek | intraday | intraweek |
| 110.30 | 113.20 | 109.50 | 108.50 |
| 111.00 | 114.50 | 108.50 | 107.40 |
GBP/USD
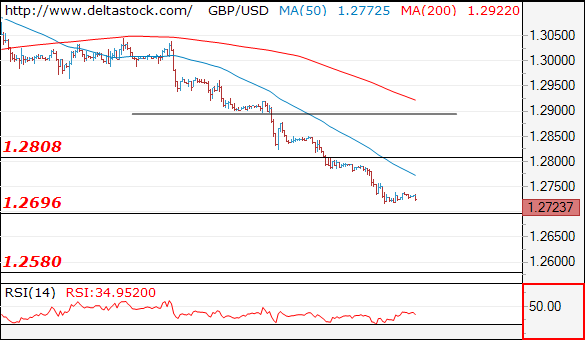
Current level - 1.2723
The overall bias remains bearish, as the pair is currently testing 1.2690 support area. A break through the latter is to be expected, for a continuation of the slide towards 1.2580 zone. Initial resistance lies at 1.2760, followed by the crucial 1.2810.
| Resistance | Support | ||
| intraday | intraweek | intraday | intraweek |
| 1.2760 | 1.2960 | 1.2690 | 1.2690 |
| 1.2810 | 1.3170 | 1.2580 | 1.2580 |
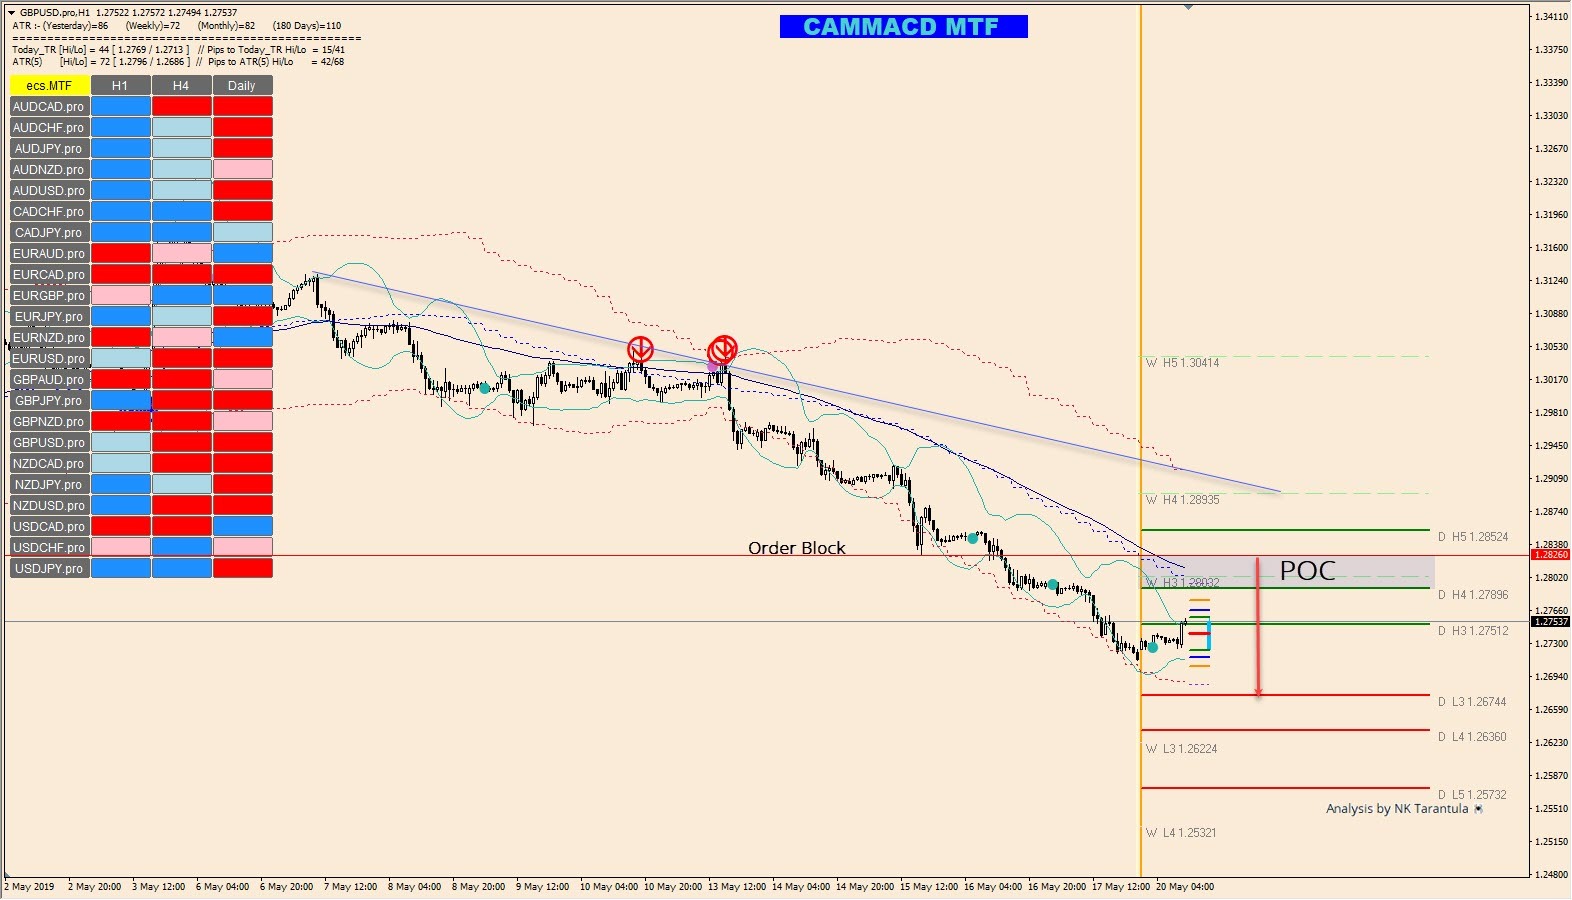
GBP/USD Bearish Continuation After A Pullback
The POC zone shows a nice confluence between W H3 and Bearish order block. We might see a rejection if the price gets in the zone.
1.2800-25 should reject the price. Watch for a reversal candle formation in the zone or any other trigger that should mark the beginning of fresh selling. Moreover, we can also see a limited pullback that signifies a strong bearish trend. Targets are 1.2750 and 1.2674. If we don’t see a pullback within the POC, watch for a momentum below 1.2750 that might also lead to a retest of 1.2713 and below. Only a close above 1.2850 will negate this bearish scenario.
EUR/JPY Two Scenarios Likely
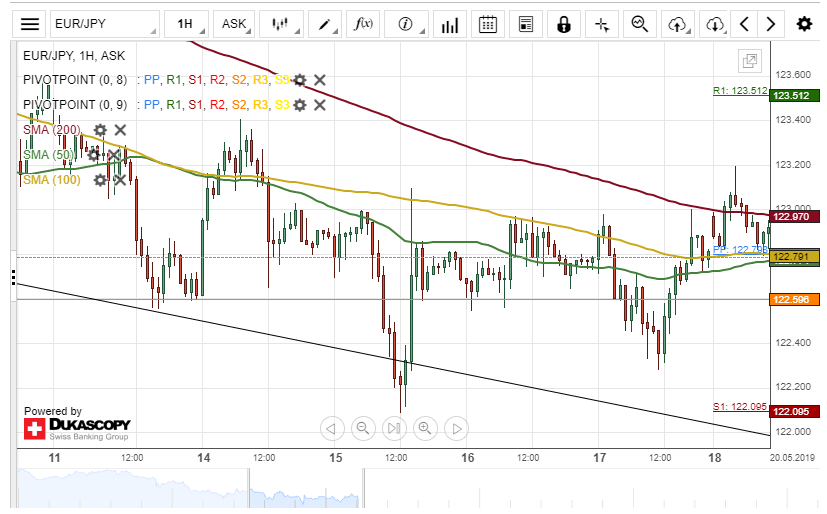
The common European currency appreciated about 75 base points against the Japanese Yen on Friday. The exchange rate breached the 200-hour simple moving average at 122.84 at the end of Friday's trading session.
If the downside risks continue to prevail in the market, the currency pair could maintain the descending channel pattern today. The EUR/JPY pair could aim for a support level at 122.09.
On the other hand, if bulls continue on their last Friday's momentum, a potential breakout through the upper boundary of the descending channel pattern could occur during the following trading session.
AUD/USD Surges After Election Surprise
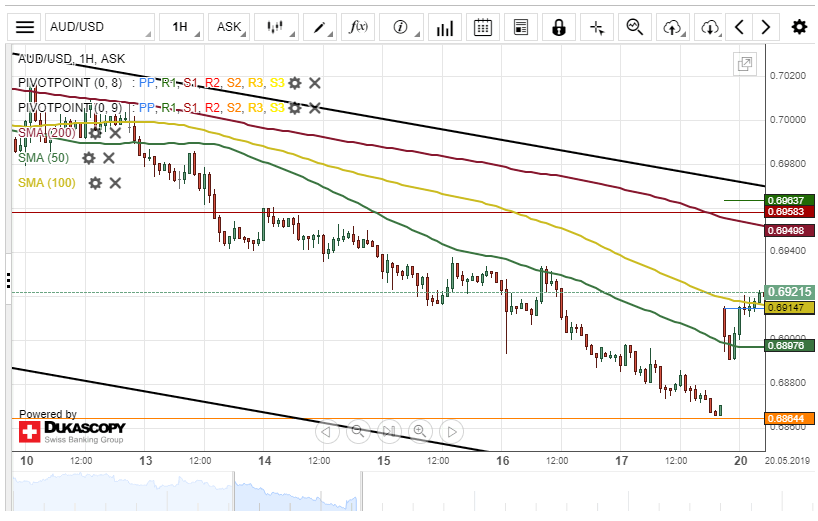
The Australian Dollar appreciated about 0.81% in value against the US Dollar on Monday. The surge was attributed to a surprise victory by the country's conservative government.
Currently, the exchange rate is trading above a resistance cluster formed by the combination of the weekly pivot point and the 100-hour simple moving average at 0.6915.
If this resistance line holds, bulls could aim for the upper boundary of a descending channel pattern at 0.6940 within this session.
However, if the currency exchange rate passes the 100-hour SMA, a decline towards the 0.6886 mark could be expected in the short-term.
USD/CAD Sets For Breakout
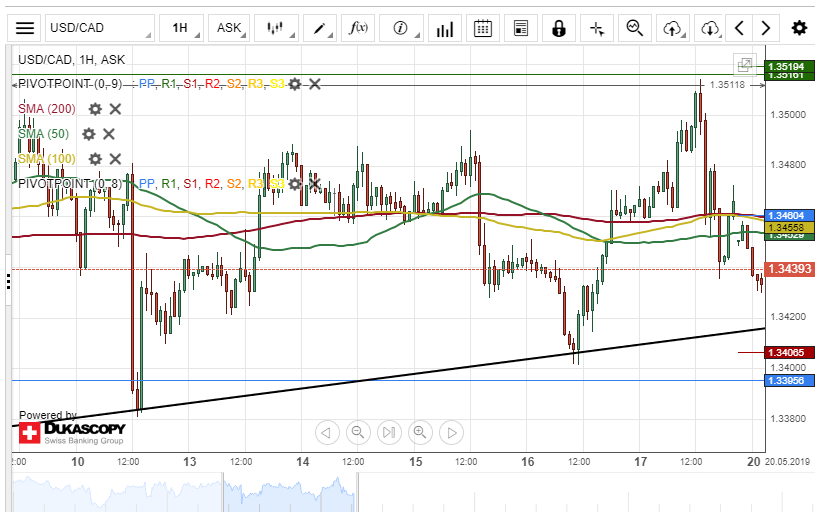
The US Dollar depreciated more than 70 base points against the Canadian Dollar on Friday. The currency pair breached the 50-, 100– and 200-hour SMAs during Friday's trading session.
The exchange rate is currently trading near the bottom border of an ascending channel pattern at 1.3425 and could be set for a breakout.
If this breakout occurs, the currency exchange rate might aim for a swing low of 1.3380 within this session.
However, a support level formed by the weekly S1 at 1.3406 could hinder bears from dragging the USD/CAD pair lower.
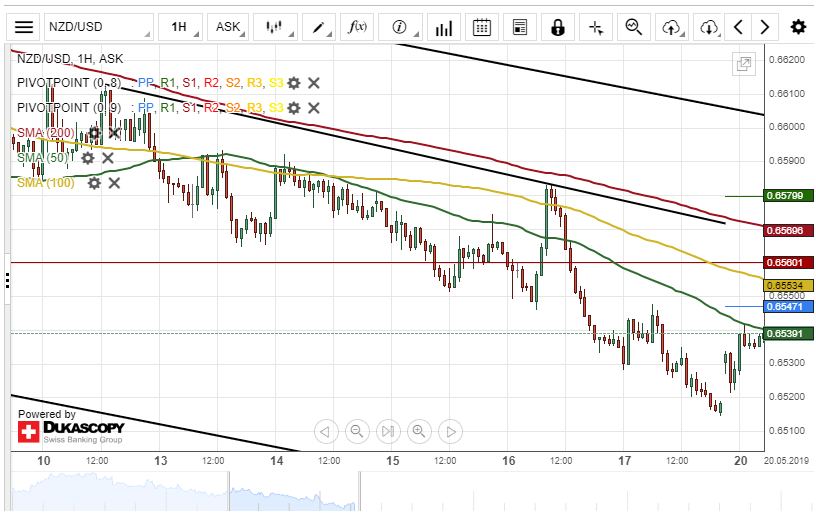
NZD/USD Remains Near 0.6547
The New Zealand Dollar depreciated about 33 base points against the US Dollar on Friday. The currency pair tested the 0.6520 mark during Friday's trading session.
Everything being equal, it is likely that the Kiwi will continue to strengthen against the Greenback during the following trading session. The potential upside targets will be near the 200-hour simple moving average at 0.6570.
However, technical indicators demonstrate that the currency exchange rate could continue its decline in the short-term.
The important resistance level to watch will be at the weekly pivot point at 0.6547. If the pair breaks that resistance line, a surge is imminent today.
EUR/USD – Euro Yawns In Light-Data Session
EUR/USD has started the new trading week quietly. Currently, the pair is trading at 1.1161, up 0.03% on the day. On the release front, there are no major events, so traders can expect the pair to continue to drift in the Monday session. German PPI gained 0.5%, following two successive declines. Later in the day, eurozone trade balance is expected to show a surplus of EUR 24.2 billion, down from EUR 26.8 billion a month earlier. On Tuesday, the eurozone releases consumer confidence and the U.S. posts existing home sales.
The euro lost some ground last week, but there were bright signs in Germany and the eurozone, as GDP and inflation headed upwards. German Preliminary GDP improved to 0.4% in the first quarter, after a flat zero reading in Q4 of 2018. In the eurozone, Flash GDP also climbed to 0.4% in the first quarter, up from 0.2% in Q4. On the inflation front, inflation indicators impressed, with sharp gains in April. Final CPI climbed 1.7%, matching the forecast. This was up sharply from 0.8% in March. Final Core CPI rose 1.3%, edging above the estimate of 1.2%. This marked the strongest gain since March 2013. The ECB recently stated that it had no plans to raise interest rates prior to the spring of 2020, but if GDP and inflation numbers continue to improve, the ECB could raise rates earlier than this timeline.
Federal Reserve Chair Jerome Powell will speak at an event on Monday, and there are a dozen Fed speakers at various venues during the week. Still, investors don’t expect to hear anything new from the Fed, which has said that the next rate move could be in either direction. The markets have priced in a rate cut later this year, and some analysts are predicting a second rate cut before 2020. This could take dampen enthusiasm for the strong U.S. dollar, as rate cuts would make the greenback less appealing to investors.
Elections In India & Australia & Trade War Simmers
European stock markets are kick-starting the week on the back foot as most of the major indices are trading lower. This is due to the trade war fear. China has warned the US that if it wants to negotiate the deal, it needs to do that on equal footing. One thing is for certain, the US cannot bully its way in. Foreign minister Wang Yi made it clear in his phone call to Secretary of State Mike Pompeo that the door is still open to form a deal however, China needs to make sure that its interest is fully protected.
In the currency markets, there have been some serious movements due to the series of major elections. Conservative Prime Minister Scott Morrison won the election in Australia with a surprise victory and this pushed the Aussie dollar higher against the basket of major currencies. The Aussie stock market also jumped higher as a result of this. The exit polls over in India shows that Prime Minister Narendra Modi is poised to remain in power. The stock market valuation remains stretched and the INR also jumped on the back of this exit poll results.
As for the Brexit update, Theresa May is going to try her luck for the last time by pushing her deal for the final time in the parliament. She is betting that her new bold offer will persuade the lawmakers and the members of the parliament. Perhaps, fourth time lucky. She was unable to form any kind of a deal with the labour party leader, Jeremy Corbyn and the talks collapsed on Friday. Mr. Corbyn has said that any deal should be put in front of public in the form of another referendum. The British pound has gained some strength but it is still trading below the critical level of 1.30. The technical analysis shows that the path of least resistance is skewed to the downside.
In the commodity space, crude and brent prices are back in green as investors are betting on the optimism that Saudi Arabia is going to keep the oil supply under control. Key producers in OPEC have signaled their willingness that they are going to keep a tight lid on the supply for the rest of the year but also made a pledge that they will do anything in their power to prevent any genuine shortages.
WTI OIL Outlook: Oil Price Hit Three-Week High On Rising Tensions Between The US And Iran
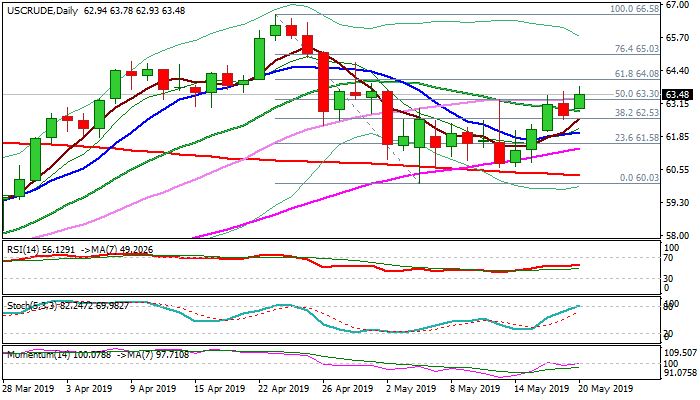
WTI oil opened with 25 pips gap higher on Monday and rallied to the highest level ($63.78) since 1 May, boosted by rising tensions in Persian Gulf and signals that OPEC+ group would probably maintain production cut.
Though rhetoric from the US following last week's attack on Saudi Arabia's oil assets and Sunday's rocket attack on Baghdad, increase fears of military conflict with Iran that would involve a number of countries in the region and could easily spread further.
Fresh strength moves again above important barrier at $63.30 (30SMA/50% retracement of $66.58/$60.03) following repeated attacks last week that failed to register close above and generate bullish signal.
Sustained break higher is needed to confirm an end of corrective phase from $66.58 high and open way for further recovery.
The action remains supported by thick rising daily cloud, with daily momentum emerging into positive territory and adding to positive stance.
On the other side, overbought stochastic warns that recovery may slow, but bullish outlook is expected to remain while the price holds above broken 20SMA ($62.82).
Res: 63.78, 64.08, 64.73, 65.03
Sup: 63.30, 62.82, 62.54, 62.02
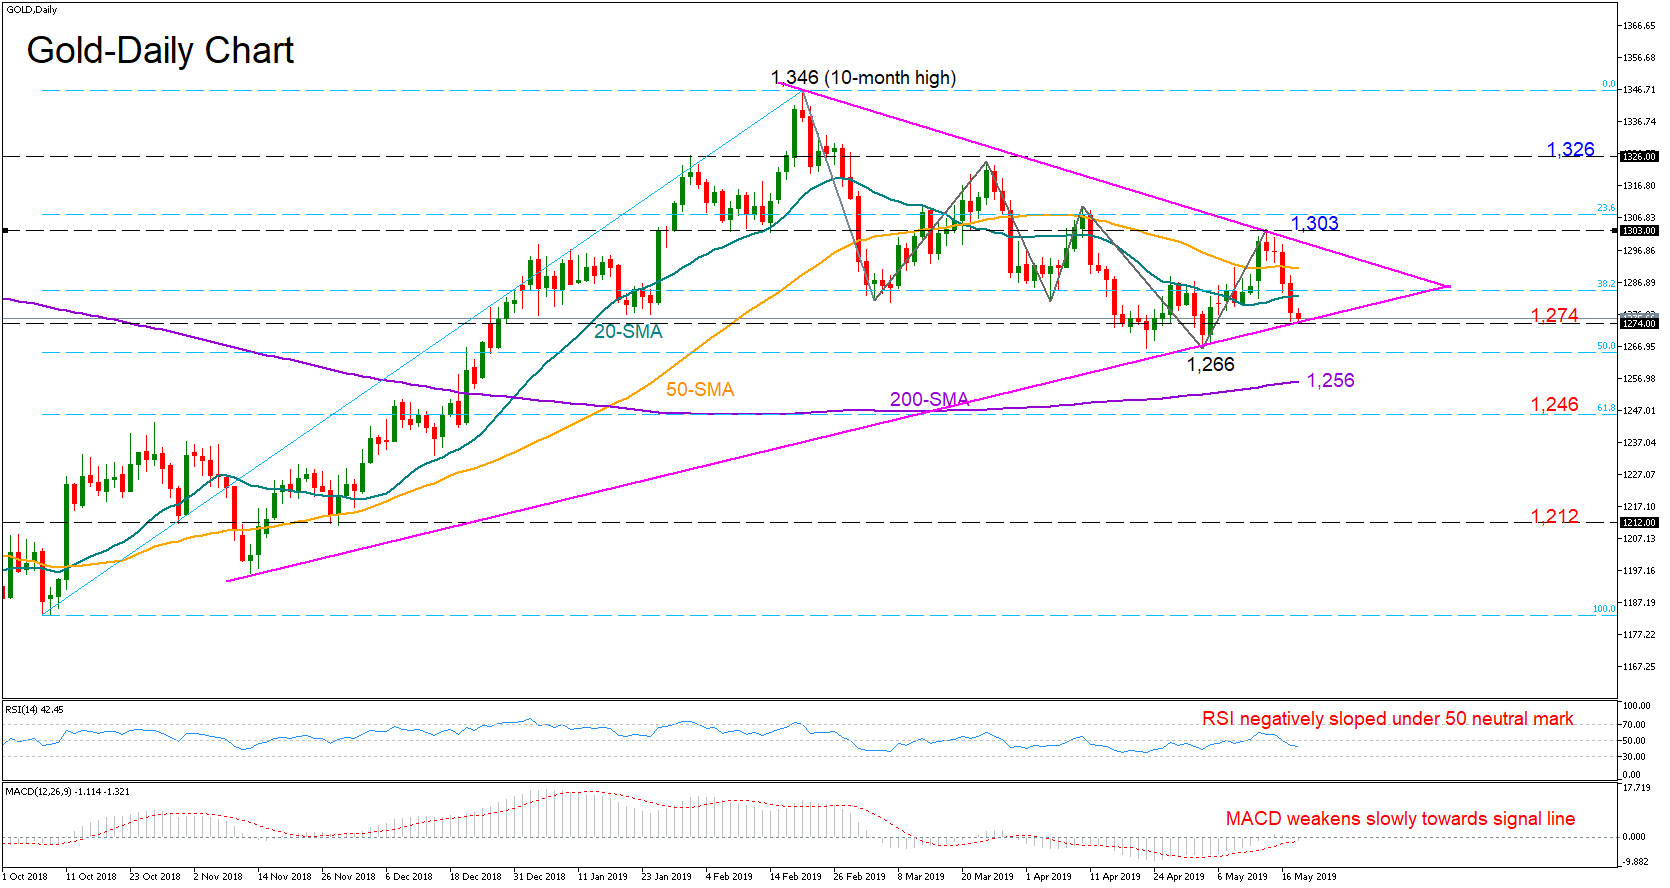
Gold Eyes Key Support Around 1,266
Gold made another lower high last week after finding resistance at 1,303.
The market action is currently taking place at the bottom of the symmetrical triangle and both the RSI and the MACD signal that the next move in the price is more likely to be on the downside as the former is negatively sloped below its 50 neutral mark and the latter continues to weaken slowly towards its red signal line.
While a cross under the triangle (1,274) could be discouraging, a decisive close under the previous low of 1,266, which is also the 50% Fibonacci of the upleg from 1,183 to 1.346 could give the green light for a steeper decline. Should the bears beat the 200-day simple moving average. (SMA) currently around 1,256, the February downtrend may turn more permanent, pushing support towards the 61.8% Fibonacci of 1,246 and 1,212.
Alternatively, for investors to resume a strong buying interest, the price would need to stage a descent rally above the triangle and the previous high of 1.303. Another key resistance is also located around 1,326, while higher the bulls would have to fight harder to overcome the 1.346 top.
In the medium-term picture, the sentiment remains bearish as long as the market keeps stretching it’s February downward pattern. The reducing distance between the 50- and the 200-day SMAs could be also a sign for caution.