Sample Category Title
China Vice Premier Still Planning To Attend Trade Talks In Washington This Week
Notes/Observations
- China Vice Premier still attending planned trade talks in Washington later this week
- German Mar Factory Orders continue to highlight the headwinds of the EU economy
- China Apr FX reserves registers its 1st decline in 7 months while its gold holding continue to climb
Asia:
- RBA left the Cash Rate Target unchanged at 1.50% (not expected). To pay close attention to the labour market in coming meeting. Still had spare capacity in the economy
- Australia Mar Trade Balance registered its 15th straight surplus (A$5.0B v A$4.3Be)
- Australia Mar Retail Sales: 0.3% v 0.2%e
Europe/Mideast:
- EU's Barnier stated that EU was willing to revise Brexit blueprint on future EU/UK ties and reiterated that cancelling Brexit was still an option for UK
- Turkey Election Board reportedly has nullified the mayoral vote in Istanbul; AKP party rep says election will be re-run on June 23
Americas:
- USTR Lighthizer confirmed US would raise China tariffs effective 12:01ET on Friday if no deal; confirmed that China was reneging on commitments and that US had not had no contact with China's Liu in 24 hours
- US Treasury Sec Mnuchin: US-China trade deal was 90% done; talks saw big change in direction as China moved away from language in the agreement that would have changed it substantially. If Chinese changed position, US would be willing to keep talking
SPEAKERS/FIXED INCOME/FX/COMMODITIES/ERRATUM
Equities
- Indices [Stoxx600 -0.18% at 386.20, FTSE -0.58% at 7,338.05, DAX -0.30% at 12,250.30, CAC-40 -0.44% at 5,459.56, IBEX-35 +0.20% at 9,350.10, FTSE MIB +0.27% at 21,466.50, SMI -0.10% at 9,648.50, S&P 500 Futures -0.46%]
- Market Focal Points/Key Themes: European Indices trade mixed this morning, with Indices coming off earlier highs, following a generally higher session in Asia after China Commerce Min Vice Premier Liu said he will visit the US this week for trade talks. US Index futures trade lower, after recouping the majority of opening losses yesterday. On the corporate front Illiad shares rise over 5% following their Q1 Revenue and strategic cooperation with Cellnex Telecom; Uniper rises after a rise in Revenue and affirmed outlook, while DSM, Adecco, Wacker Neuson, Hanover Re, Anheuser Busch among other notable names rising on earnings. Meanwhile shares of German car giant BMW declines on a sharp decline in profits and adjusted outlook; Henkel declines 4% after Q1 results signaled a weak start the year; with Domino's Pizza, Westwing Group, Infineon and Outokumpu among other names declining on orders. In other news Vectura rises sharply after wining patent litigation against Glaxo, QSC gains on the ale of Plusnet, while Thomas Cook gains as Lufthansa is to bid for its Condor unit. Looking ahead notable earners include Emerson Electric, Dean Foods, Crocs, Jacob's Engineering and Owen and Minor among others.
Equities
- Consumer discretionary: Lagardere [MMB.FR] +2% (sales), Domino's Pizza [DOM.UK] -6% (trading update), G4S [GFS.UK] -3.5% (statement on no intention to make offer), Hellofresh [HFG.DE] +5% (earnings), Thomas Cook [TCG.UK] +8% (Lufthansa to make offer for Condor), Adecco [ADEN.CH] +1.5% (earnings)
- Financials: Societe Generale [GLE.FR] -2% (investor day)
- Materials: DSM [DSM.NL] +5.5% (earnings)
- Industrials: BMW [BMW.DE] -1% (earnings), Alstom [ALO.FR] +2.5% (earnings), Evonik [EVK.DE] +2% (earnings; raises outlook), Henkel [HEN3.DE] -4% (earnings), Varta [VAR1.DE] +8% (earrings), Outokumpu [OUT1V.FI] -4.5% (earnings)
- Technology: Infineon [IFX.DE] -0.5% (earnings), Axel Springer [SPR.DE] +2.5% (earnings)
- Telecom: Iliad [ILD.FR] +5% (sales; divestment), QSC [QSC.DE] +11% (acquisition)
Speakers
- EU's Tusk said to discuss potential picks for top EU positions at the upcoming informal EU meeting on May 9th and could propose fast process for filling top EU positions
- Italy Stats Agency (Istat) Monthly Economic Note: Leading indicator declined in April but at a slower pace compared to prior months
- Sweden Central Bank (Riksbank) Apr Minutes: Global economy was still fraught with uncertainty; questions about strength of inflationary pressures
- Sweden Central Bank (Riksbank) Gov Ingves: Inflation target attainment continued to be good and that interest rates could be cautiously raised. Postponement of next rate hike felt natural in light of lower inflation forecast
- US Commerce Sec Ross: Imbalance in US-India trade needs to be address as imbalances due to IT business. India's trade barriers were a disadvantage for foreign companies
- China Commerce Ministry (MOFCOM) confirmed that Vice Premier Liu He would visit the US this week for trade talks (scheduled for Thur-Fri, May 9-10th)
- China Foreign Ministry spokesperson Geng Shuang: Raising tariff will not resolve issues; reiterated that hope to meet the US half-way on trade issues
- Malaysia Central Bank (BNM) Policy Statement noted that Adjustment to OPR was intended to preserve degree of monetary accommodativeness. Inflation expected to be broadly stable in 2019 compared to year ago levels. Inflation expected to remain low mainly due to policy measures in the immediate term
Currencies/Fixed Income
- Risk-on appetite trying to find some momentum in the session as China's Vice Premier Liu He was still planning to attend the trade talks in Washington later in the week; Liu attendance seem as a potentially positive sign for a trade agreement between the US and China
- GBP was softer as the prospect of a cross-party Brexit deal lacked optimism. GBP/USD at 1.3100 just ahead of the NY morning.
- TUR currency (Lira) was weaker after Turkey ordered a re-run of Istanbul's mayoral elections. USD/TRY testing above 6.16 with Lira weaker by 1.3%
- AUD saw a relief rally in the aftermath of a surprise RBA hold in its key rate. AUD/USD higher by 0.4% at 0.7015 area
Economic Data
- (NL) Netherlands Apr CPI M/M: 0.7% v 0.4% prior; Y/Y: 2.9% v 2.8% prior
- (NL) Netherlands Apr CPI EU Harmonized M/M: 1.1% v 0.5% prior; Y/Y: 3.0% v 2.9% prior
- (DE) Germany Mar Factory Orders M/M: 0.6% v 1.4%e; Y/Y: -6.0% v -5.4%e
- (CH) Swiss Q1 Real Estate Bubble Index: No est v 0.88 prior
- (DE) Denmark Mar Industrial Production M/M: +1.0% v -1.4% prior
- (FR) France Mar Trade Balance: -€5.3B v -€4.5Be
- (FR) France Mar Current Account Balance: -€1.3B v v -€0.6B prior
- (MY) Malaysia Central Bank (BNM) cut the Overnight Policy Rate by 25bps to 3.00% (as expected) for its 1st rate cut since July 2016)
- (MY) Malaysia End-Apr Foreign Reserves: $103.4B v $103.5B prior
- (CH) Swiss Apr Foreign Currency Reserves (CHF): 771.6B v 758.3Be
- (CZ) Czech Mar Retail Sales Y/Y: 2.7% v 1.9%e; Retail Sales (ex-auto) Y/Y: 4.3% v 4.5%e
- (AT) Austria Apr Wholesale Price Index M/M: 0.7% v 0.3% prior; Y/Y: 2.2% v 2.9% prior
- (DE) Germany Apr Construction PMI: 53.0 v 55.6 prior
- (SE) Sweden Mar Private Sector Production M/M: -0.5% v +0.2%e; Y/Y: 1.1% v 1.8%e
- (SE) Sweden Mar Industrial Orders M/M: -4.9% v -2.4% prior; Y/Y: -8.1% v -3.5% prior
- (SE) Sweden Mar Industry Production Value Y/Y: -1.3% v 2.9% prior; Service Production Value Y/Y: 0.3% v 1.7% prior
- (UK) Apr New Car Registrations Y/Y: -4.1% v -3.4% prior
- (CZ) Czech Apr International Reserves: $142.9B v $143.0B prior
- (TW) Taiwan Apr CPI Y/Y: 0.7% v 0.5%e; CPI Core Y/Y: 0.6% v 0.6%e; WPI Y/Y: % v 1.4%e
- (TW) Taiwan Apr Trade Balance: $2.7B v $3.1Be; Exports Y/Y: -3.3% v -3.1%e; Imports Y/Y: 2.6% v 1.0%e
- (CN) China Apr Foreign Reserves: $3.0950T v $3.100Te (1st decline in 7 months)
- (IS) Iceland Apr Preliminary Trade Balance (ISK): -15.9B v -8.8B prior
- (SG) Singapore Apr Foreign Reserves: $296.8B v $295.8B prior
Fixed Income Issuance
- (EU) ESM opened its to sell €1.0B in Jan 2022 bond; guidance seen -17bps to mid-swaps
- (ID) Indonesia sold total IDR21.6T vs. IDR15.0T target in 3-month and 12-month Bills and 5-year, 10-year, 15-year, and 20-year Bonds
- (ES) Spain Debt Agency (Tesoro) sold total €4.145B vs. €3.5-4.5B indicated range in 3-month and 6-month Bills
- (AT) Austria Debt Agency (AFFA) sold total €1.38B vs. €1.38B indicated in 2023 and 2029 RAGB bonds
- (SE) Sweden sold SEK5.0B in 3-month bills; Avg Yield: -0.4578% v -0.4626% prior; Bid-to-cover: 1.70x v 1.92x prior
Looking Ahead
- (EU) EU Commission Spring Economic Forecasts
- (RU) Russia Feb Sovereign Wealth Funds: Wellbeing Fund: No est v $59.1B prior TradeTheNews.com EU Mid-Market Update:
- (IL) Israel Apr Foreign Currency Balance: No est v $118.2B prior
- 05:30 (UK) Weekly John Lewis LFL sales data
- 05:30 (ZA) South Africa Apr Sacci Business Confidence: 91.7e v 91.8 prior
- 05:30 (EU) ECB allotment in 7-Day Main Refinancing Tender (MRO
- 05:30 (HU) Hungary Debt Agency (AKK) to sell in 3-month Bills
- 05:30 (DE) Germany to sell €700M in 2026 and 2046 I/L Bonds (Bundei)
- 05:30 (BE) Belgium Debt Agency (BDA) to sell 3-month and 6-month Bills
- 05:30 (UK) BOE allotment in 6-month GBP-enhanced liquidity repo operation (ILTR)
- 06:00 (IE) Ireland Mar Industrial Production M/M: No est v -0.1% prior; Y/Y: No est v 0.8% prior
- 06:15 (SE) Sweden Central Bank (Riksbank) Gov Ingves Speech
- 06:30 (EU) ESM to sell €2.0B in 3-month bills
- 06:45 (US) Daily Libor Fixing
- 07:00 (US) Fed's Kaplan (dove, non-voter)in Beijing on Moderated Panel
- 07:45 (US) Weekly Chain Store Sales data
- 08:00 (PL) Poland Apr Official Reserves: No est v $112.9B prior
- 08:00 (BR) Brazil CONAB Sugar Production Report
- 08:00 (UK) Baltic Bulk Index
- 08:00 (RU) Russia announces upcoming OFZ Bond issuance
- 08:15 (BR) Brazil Apr Vehicle Production: No est v 240.6K prior; Vehicle Sales: No est v 209.2K prior; Vehicle Exports: No est v 39.0K prior
- 08:30 (CL) Chile Apr Trade Balance: $1.0Be v $0.6B prior; Total Exports: No est v $6.2B prior; Total Imports: No est v $5.6B prior
- 08:30 (CL) Chile Apr International Reserves: No est v $38.8B prior
- 08:55 (US) Weekly Redbook Retail Sales data
- 09:00 (MX) Mexico Feb Gross Fixed Investment: -2.5%e v +1.6% prior
- 09:00 (MX) Mexico Apr Vehicle Production: No est v 346.9K prior; Vehicle Exports: No est v 323.6K prior
- 09:00 (CL) Chile Mar Nominal Wage M/M: No est v 0.1% prior; Y/Y: No est v 4.3% prior
- 09:00 (EU) Weekly ECB Forex Reserves
- 10:00 (US) Mar JOLTS Job Openings: 7.735Me v 7.087M prior
- 10:00 (CA) Canada Apr Ivey Purchasing Managers Index (Seasonally Adj): No est v 54.3 prior; PMI (unadj): No est v 57.6 prior
- 10:00 (MX) Mexico Weekly International Reserves data
- 10:30 (NZ) Fonterra Global Dairy Trade Auction
- 11:35 (US) Fed's Quarles (hawk, voter)
- 12:30 (UK) BOE's Haldane (chief economist) in Sheffield.
- 13:00 (TR) Treasury to sell 3-Year Notes
- 15:00 (US) Mar Consumer Credit: $16.0Be v $15.2B prior
- 16:30 (US) Weekly API Oil Inventory data
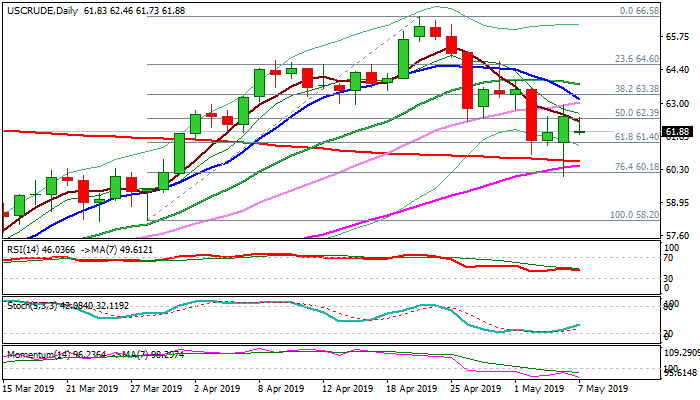
WTI Oil Outlook: Directionless N/T Mode Extends As Signals Remain Mixed
WTI oil holds in narrow range directionless mode on Tuesday, following Monday’s strong rejection at converged 200/55SMA’s ($60.64/49) and repeated failures to close below cracked Fibo pivot at $61.40 (61.8% of $58.20/$66.58 upleg).
This indicates that bears face strong headwinds, but factors that strongly influence near-term price action are mixed and lack direction signal.
Renewed trade tensions between US and China pressure oil price, as traders fear that escalation of conflict would affect global demand, while sanctions on Iran and Venezuela threaten of shortage in oil market and support the price.
Daily techs are also mixed as positive impact from rising bearish momentum and daily MA’s (10/20/30) in bearish setup is offset by reversed stochastic and support from converging 200/55SMA’s.
Initial bearish signal can be expected on eventual close below $61.40 Fibo support, with confirmation on sustained break below 200SMA.
At the upside, converging 30/10 SMA’s ($63.05/21) mark initial resistances, followed by 20SMA ($63.78), sustained break of which would generate reversal signal and shift near-term focus higher.
API weekly crude stocks report is due later today and can provide fresh signals, along with Wednesday’s release of US EIA crude inventories report.
Res: 62.46, 63.04, 63.38, 63.78
Sup: 61.73, 61.40, 60.64, 60.03
China-US Trade Deal Prospects ‘Wagging’ The Markets
Trade disputes do not subside, putting pressure on financial markets. Against the background of negative sentiment regarding the trade deal, more and more markets are involved in this "tornado". The United States announced that China had abandoned some previously agreed concessions, which fundamentally changed the basis for the agreement. Such an approach finally destroys hopes for a deal before the end of this week, despite the formal assurance of the Chinese side that they intend to arrive in Washington at the end of the week.
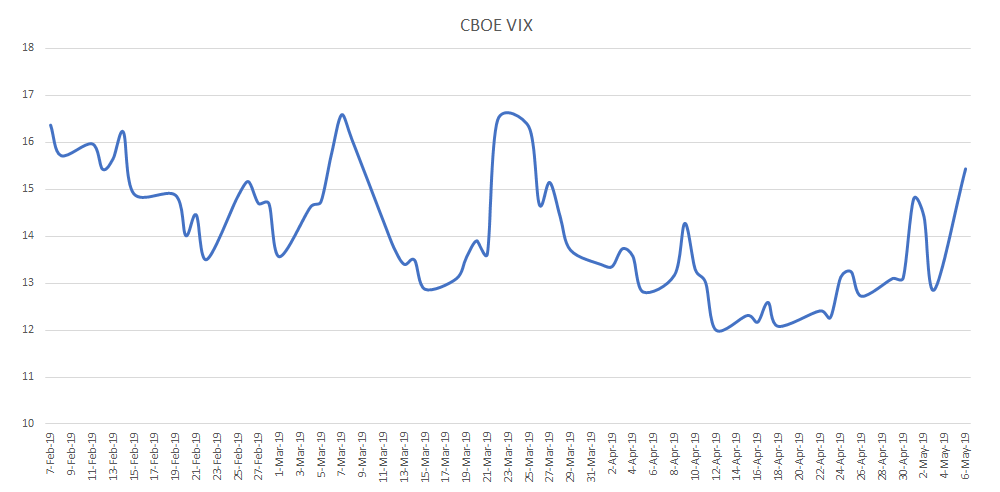
China A50 Shanghai Blue Chips Index turned to a decline, dropping by about 1% against Tuesday’s opening levels, being under pressure due to concerns about deal prospects. Futures on the S&P 500 show increased volatility since the end of last week, opening the day lower by 0.45%. The VIX index, the so-called “fear index,” rose to 15.55, the highest level since the end of March, pushing off from levels near 12 at the end of last month. This is a moderately negative signal for the market combined with RSI decline from the overbought area, which increases the chances of a corrective pullback.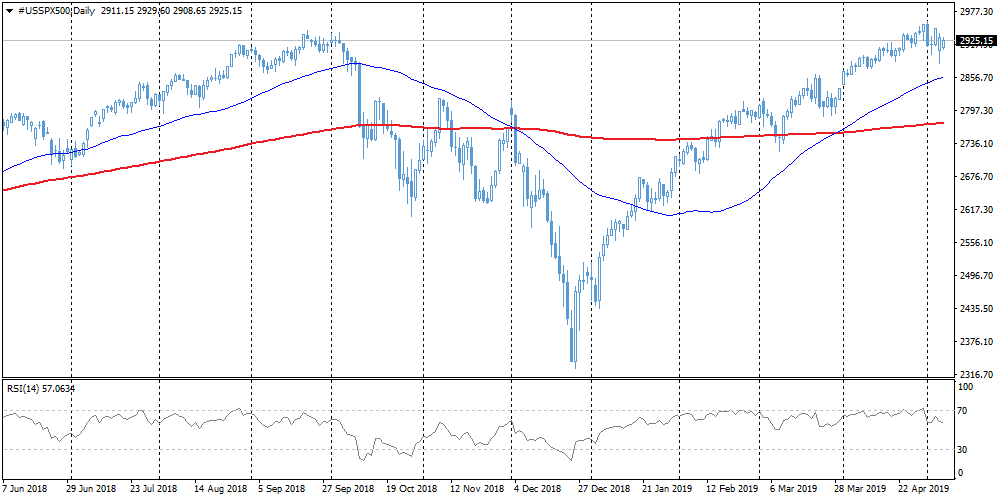
It seems that the series of bad economic data in the eurozone has been left behind. Monday's PMI indices in the service sector exceeded expectations in addition to strong inflation data at the end of last week. Due to this data, the EURUSD managed to return above 1.1200. Today, the focus of investors with positions in the euro is the publication of the European Commission forecasts. Optimistic forecasts can further support the euro.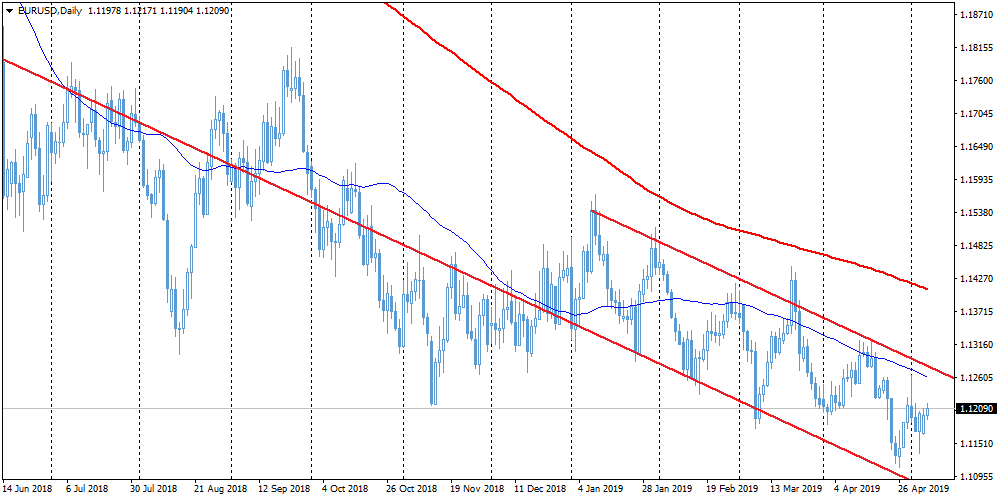
The Reserve Bank of Australia decided not to cut the interest rate, which was expected by most of the surveyed analysts. As a result, AUDUSD jumped 0.6% to 0.7040. The recovery of the pair, however, is restrained by concerns about the US / Chinese trade deal. Next on the agenda is tomorrow's meeting of the RBNZ. The economies of Australia and New Zealand are tied to exports to China, so the actual and planned steps of the PBOC related to monetary policy since the beginning of the year have somewhat relieved the pressure on the RBA and RBNZ.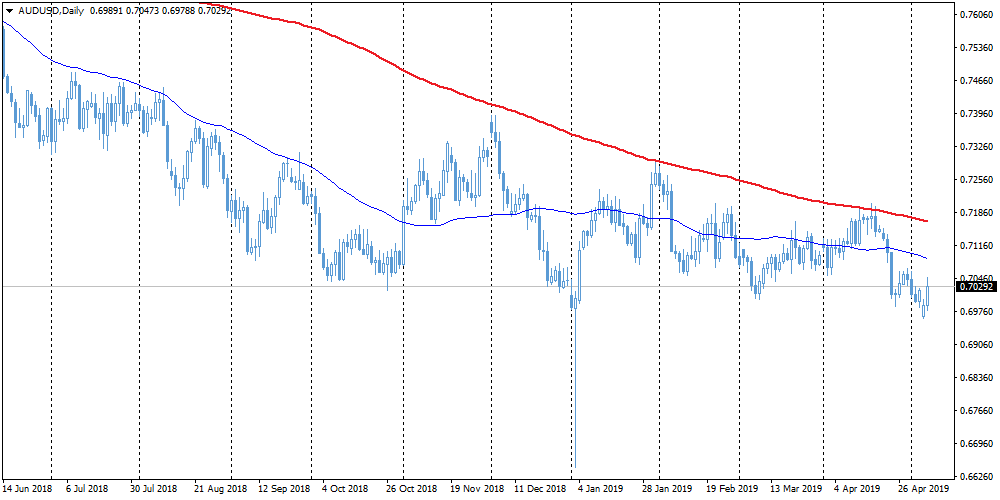
European Update – Tariffs Weigh On Risk Appetite
Investors calmer as dust settles on US/China setback
It won't come as a surprise to anyone to learn that attention is primarily on US/China trade talks again on Tuesday, after the prospect of a deal on Friday quickly turned into the threat of new tariffs.
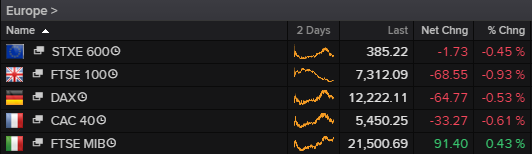
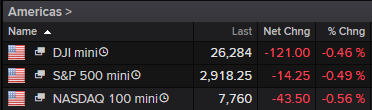
Trump sent investors into a tizzy after sending out a tweet claiming the White House is preparing to slap new tariffs on China on Friday as a result of slow progress in negotiations.
This may all just be last minute wrangling as both sides dot the I's and cross the t's and look to gain final concessions but investors are nonetheless quite wary about the possibility of talks collapsing so late in the day. A deal was pretty much priced in, with the rhetoric of recent months very much being focused around the timing of a deal rather than the prospect of one but that has suddenly changed.
The initial response to the latest development was understandably very negative but as the dust settled and it became clear that talks will continue this week, the hysteria passed and investors instead went into self-preservation mode telling themselves that surely this is only a negotiating tactic. Surely months of talks can't collapse this late in the day. The chances are they're probably right but the tone of the negotiations now appears to have become less friendly which means the deal is in jeopardy.
Chinese Trade Data Eyed As Tensions With US Simmer Again
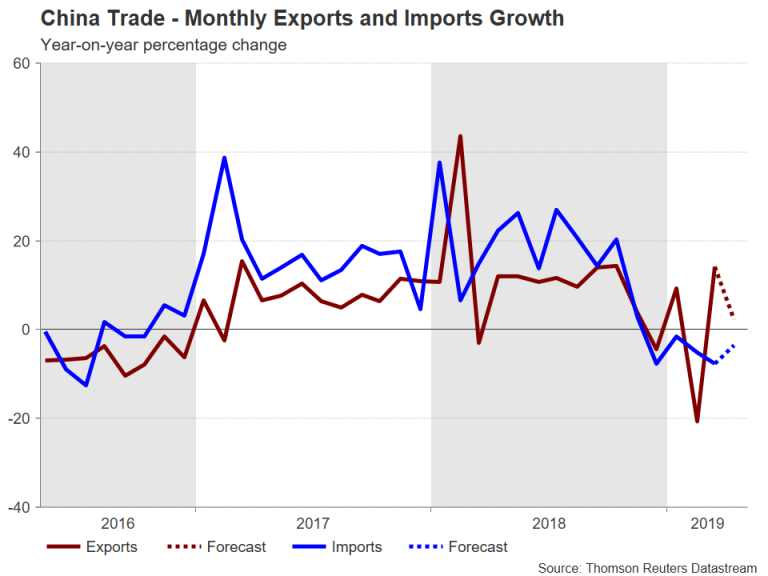
China will publish monthly trade numbers on Wednesday to be followed by inflation figures for April on Thursday. There is no confirmed release time for the trade data, but Thursday’s price readings are due at 01:30 GMT. The latest stats on goods inflow and outflow come amid a fresh spike in trade tensions with the United States. As talks between the two economic powerhouses look set to drag on, investors will be carefully sifting through the data as they search for signs of a rebound in economic growth.
After surging by 14.2% year-on-year in March, growth in exports is expected to have moderated to 2.3% in April. The strong figure in March was attributed to several temporary factors, including a rebound from the February slump when activity was disrupted from the Lunar New Year celebrations.
Is Chinese recovery floundering already?
But even when looking past these distortions, there are concerns that the mini-bounce in growth observed in March lost steam in April. Activity in the manufacturing sector – China’s main growth engine – eased in April according to both the official and private PMI readings. Therefore, a disappointing print in exports on Wednesday would reignite concerns about the growth outlook, while increasing pressure on authorities to devise more stimulus measures.
Import numbers will also be important as they are seen as a gauge of the strength of domestic demand. Imports into China have been falling on an annual basis since December and another month of negative growth would raise doubts about the government’s attempts to boost consumption. They are forecast to have declined by 3.6% y/y in April.
Inflation slowly inching higher
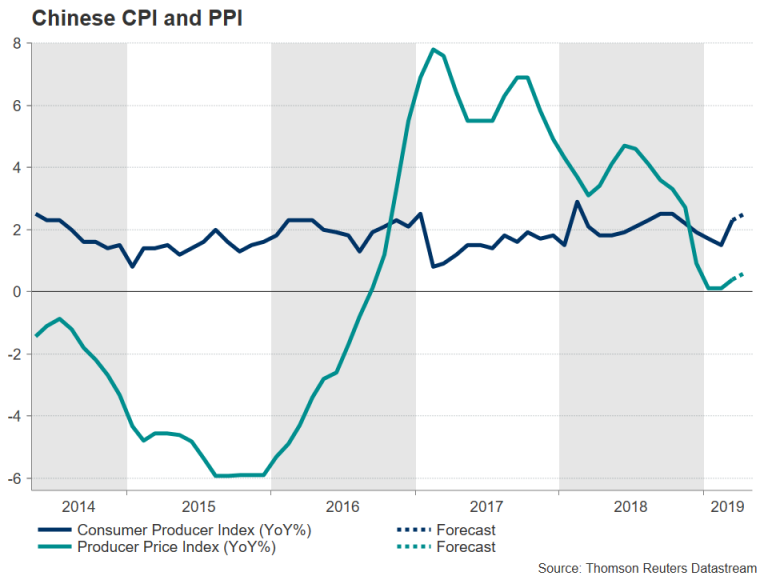
Another clue about the strength of the Chinese economy could come from the producer price index (PPI) on Thursday. The PPI rate has been steadily trending downwards since early 2017, in a sign of weakening demand for raw materials by factories as the slowdown took hold. It is expected to have edged up to 0.6% y/y in April from 0.4% previously. Meanwhile, the consumer price index (CPI), which also remains subdued, is forecast to rise by 0.2 percentage points to 2.5% y/y.
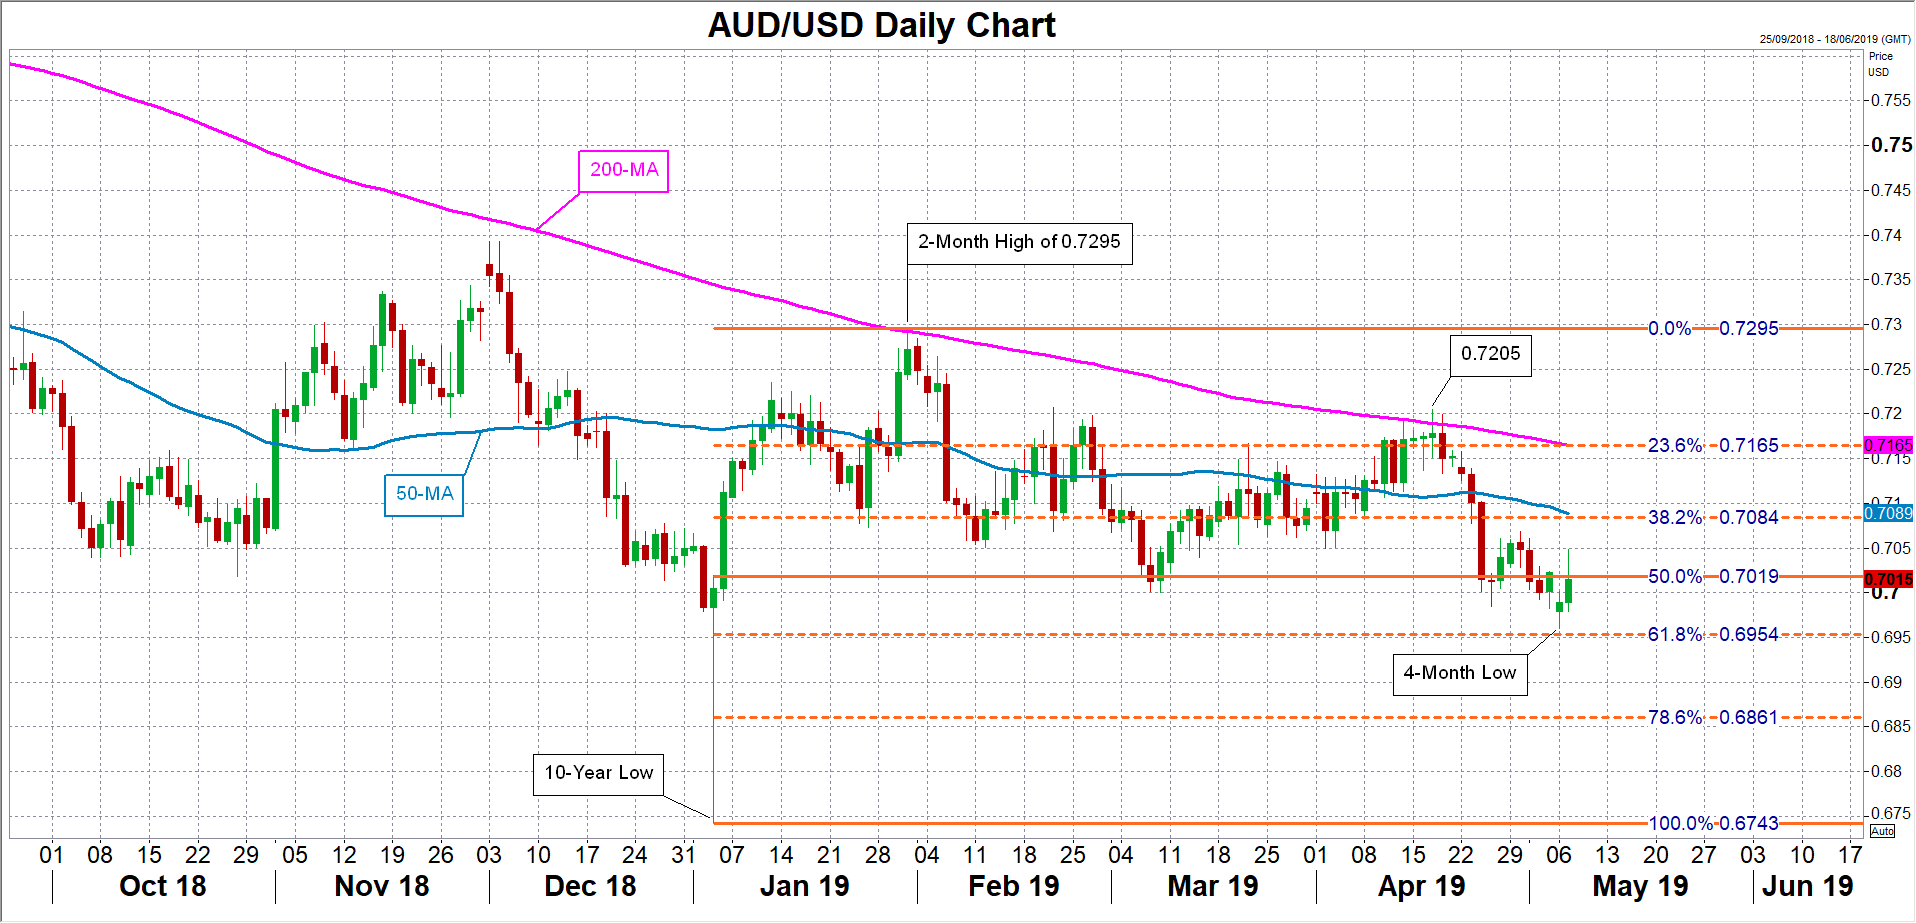
Any big surprises from this week’s releases are likely to spark volatility in the risk-sensitive Australian dollar, which is considered to be a good liquid proxy for China-related trades. The aussie, under pressure from the setback in the Sino-US trade negotiations, received a much-needed bump up on Tuesday from the RBA’s decision to keep rates on hold for now.
Should the Chinese data point to an improving economic picture, the aussie could set its sights on the 38.2% Fibonacci retracement of the upleg from $0.6743 to $0.7295, around $0.7084. This could prove a significant level as it’s also near the 50-day moving average. Alternatively, a weak set of numbers could pull the aussie back towards this week’s 4-month lows, just above the 61.8% Fibonacci at $0.6954.
Traders may cast aside data in favour of trade headlines
However, with the focus very much on the latest developments in the trade talks, traders may decide to sit on the sidelines and wait for the next round of discussions between Chinese and US negotiators to get underway before placing fresh bets. It was confirmed on Tuesday that China’s Vice Premier, Liu He, will travel to Washington on Thursday even as US President Trump threatens to raise tariffs on $200 billion worth of goods from 10% to 25%. A lack of progress in this week’s talks and a subsequent hike in tariffs poses a major downside risk for the Australian dollar as well as the overstretched rally in the equities market.
The Analytical Overview Of The Main Currency Pairs
The EUR/USD currency pair
Technical indicators of the currency pair:
Prev Open: 1.11659
Open: 1.11982
% chg. over the last day: +0.15
Day's range: 1.11907 – 1.12178
52 wk range: 1.1111 – 1.2009
USD remains under pressure due to the escalating US/China trading conflict. Earlier Donald Trump stated that he plans to increase the import fees on the Chinese ware worth more than 200 billion USD from 10% to 25%. The US representative Rober Lighthighser explained that such a sharp increase is caused by the attempts of Beijing to rewrite an already approved agreement. Keep an eye on this issue. The EUR/USD quotes are consolidating around 1.11900-1.12200. You should open positions from these levels.
At 17:00 (GMT+3:00) the US will publish the JOLTS report.
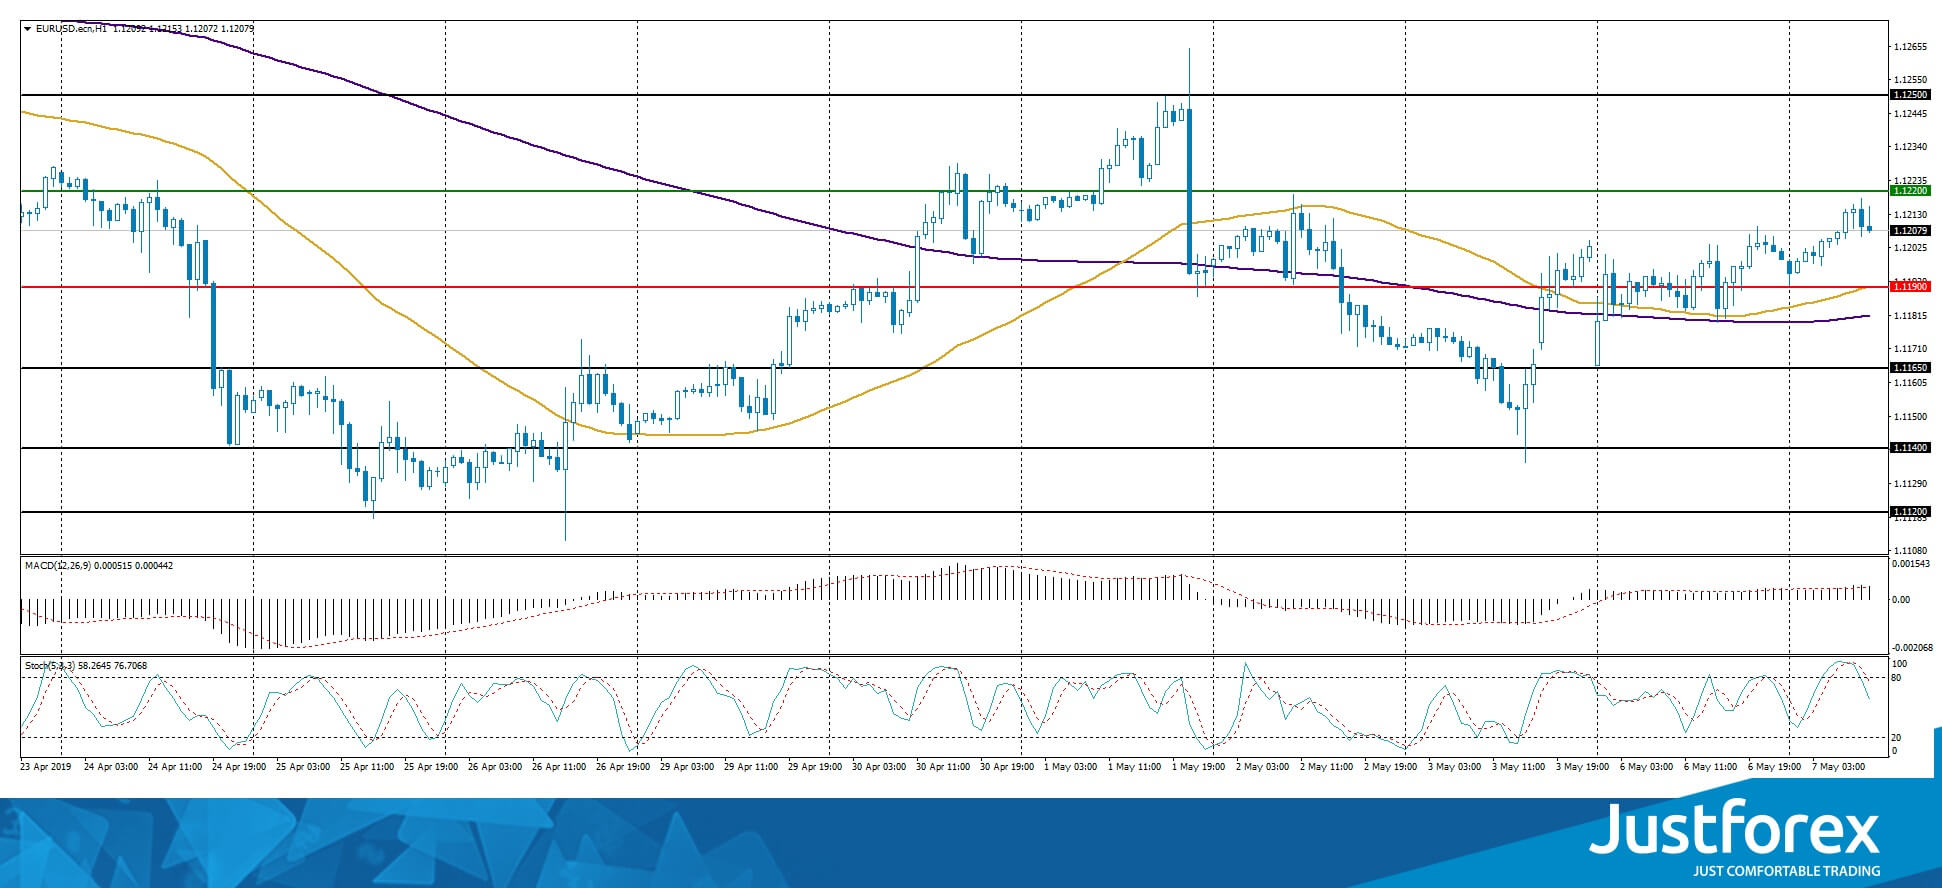
The indicators do not provide precise signals: 50 MA started to cross 200 MA.
The MACD histogram is in the positive zone and above the signal line which gives a signal to buy EUR/USD.
The Stochastic Oscillator started to leave the overbought zone, the %K line is below the %D line which points to the bearish mood.
Trading recommendations
Support levels: 1.11900, 1.11650, 1.11400
Resistance levels: 1.12200, 1.12500
If the price fixes above 1.12200, expect further growth toward 1.12500-1.12700.
Alternatively, the quotes can descend toward 1.11650-1.11500.
The GBP/USD currency pair
Technical indicators of the currency pair:
Prev Open: 1.31371
Open: 1.30954
% chg. over the last day: -0.40
Day's range: 1.30871 – 1.31313
52 wk range: 1.2438 – 1.3631
GBP/USD is consolidating after a long rally since the end of April. The local support and resistance levels are 1.31000 abd 1.31400. The financial market participants are evaluating the new Brexit information. Also, this week the UK will publish important economic releases. You should open positions from the key levels.
The Economic News Feed for 07.05.2019 is calm.
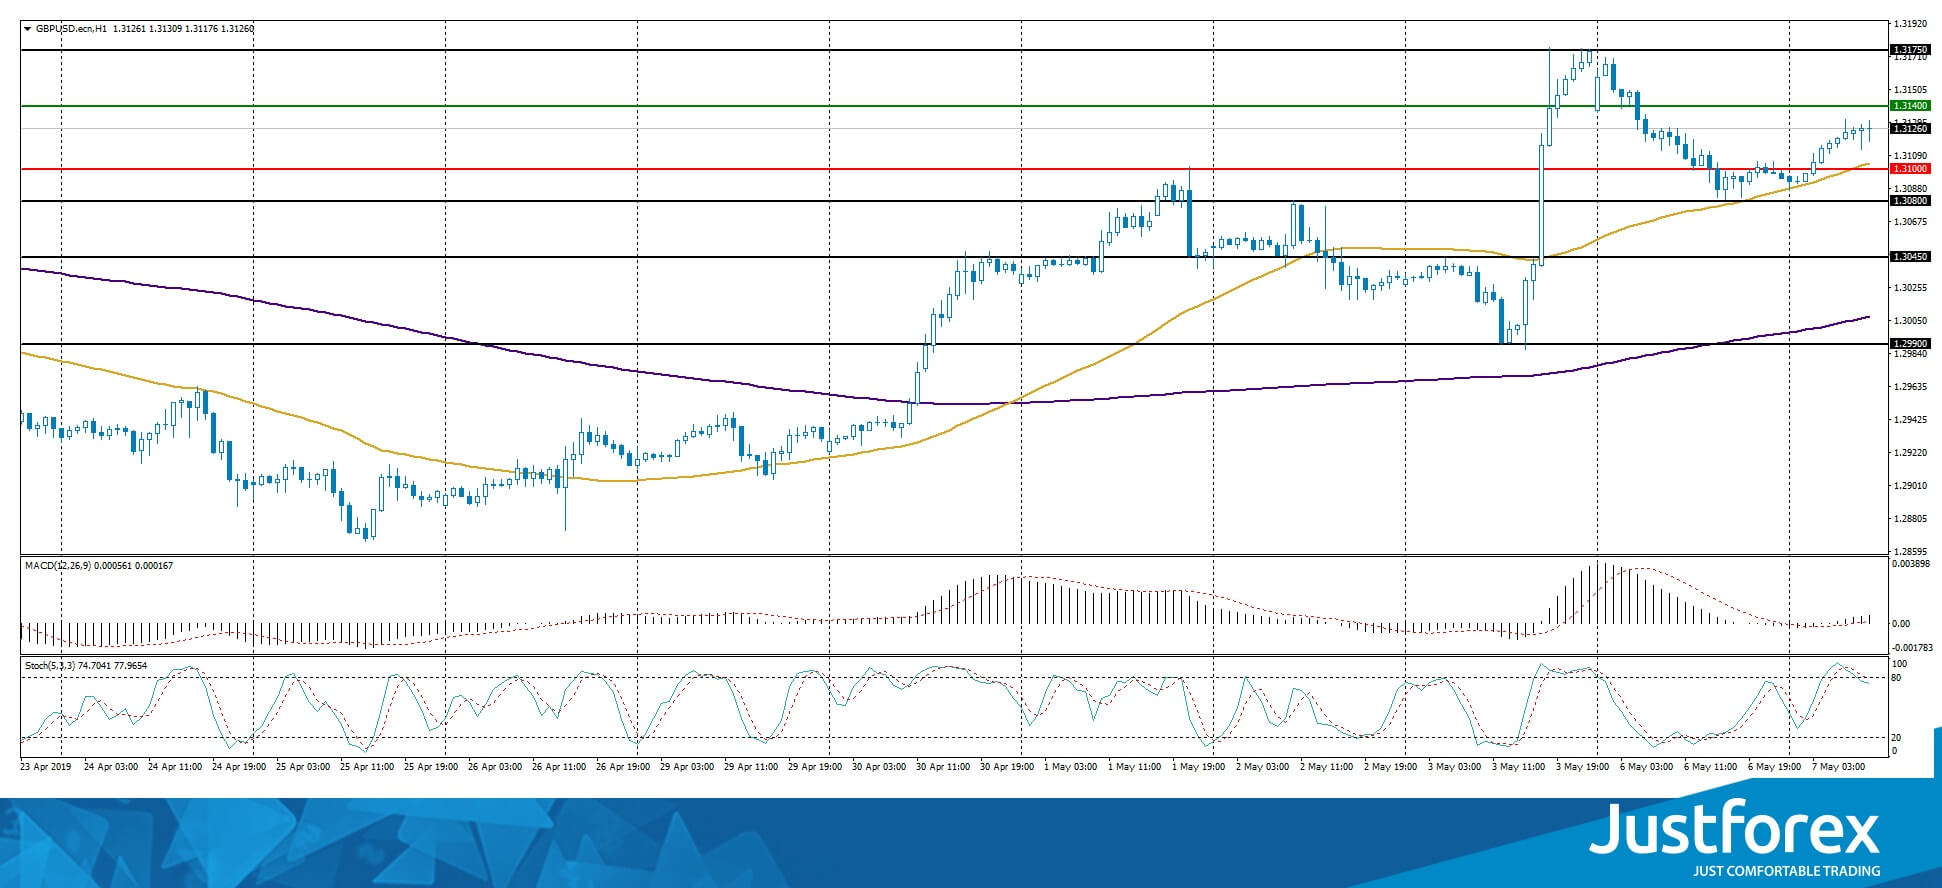
The price fixed above 50 MA and 200 MA which points to the power of the buyers.
The MACD histogram is in the postive zone and keeps rising which gives a strong signal to buy GBP/USD.
The Stochastic Oscillator started to leave the overbought zone, the %K line is below the %D line which points to the bearish mood.
Trading recommendations
Support levels: 1.31000, 1.30450, 1.29900
Resistance levels: 1.31400, 1.31750, 1.32000
If the price fixes above 1.31400, expect further growth toward 1.31750-1.32000.
Alternatively, the quotes can correct toward 1.30600-1.30500.
The USD/CAD currency pair
Technical indicators of the currency pair:
Prev Open: 1.34559
Open: 1.34436
% chg. over the last day: -0.19
Day's range: 1.34092 – 1.34626
52 wk range: 1.2727 – 1.3664
USD/CAD started to descend and updated the local minimums. The CAD is supported by the oil price recovering. The USD/CAD quotes are consolidating around 1.34150-1.34450 and have a tendency to descend further. You should open positions from these levels.
The Economic News Feed for 07.05.2019 is calm.
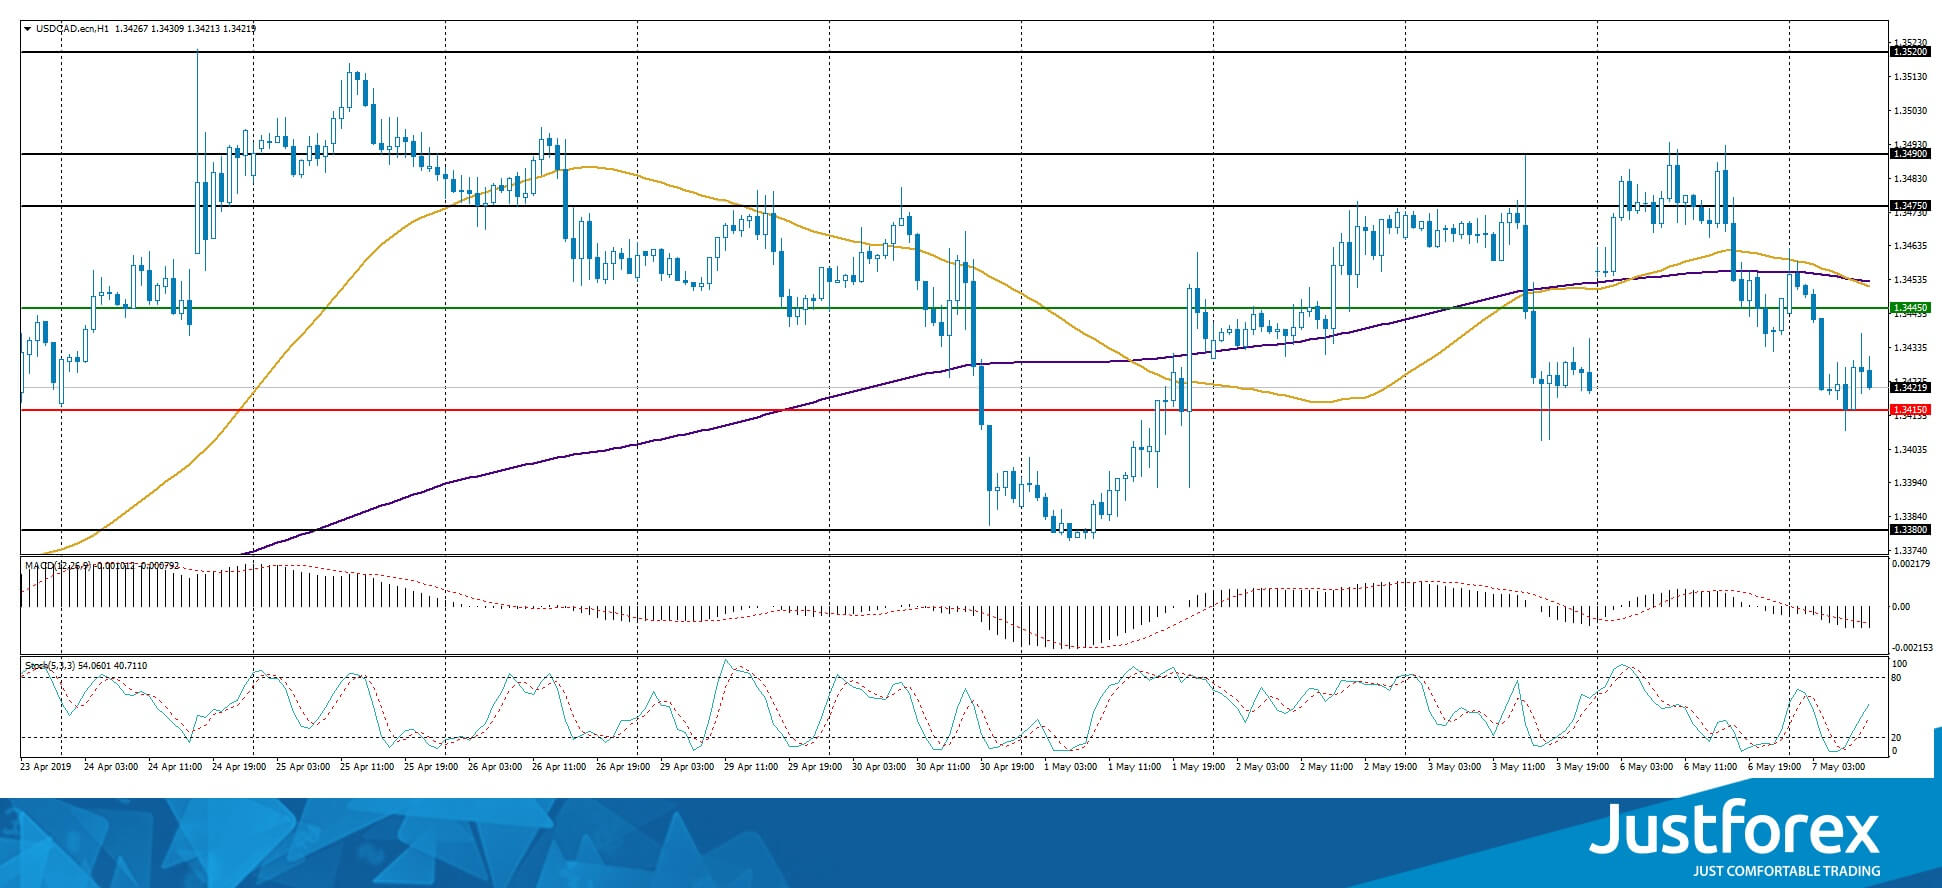
The indicators do not provide precise signals, 50 MA has crossed 200 MA.
The MACD histogram is in the negative zone and below the signal line which gives a strong signal to sell USD/CAD.
The Stochastic Oscillator is in the neutral zone, the %K line is above the %D line which points to a bullish mood.
Trading recommendations
Support levels: 1.34150, 1.33800
Resistance levels: 1.34450, 1.34750, 1.34900
If the price fixes below 1.34150, consider selling USD/CAD. The movement will tend toward 1.33800-1.33600.
Alternatively, the quotes can grow toward 1.34700-1.34900.
The USD/JPY currency pair
Technical indicators of the currency pair:
Prev Open: 110.598
Open: 110.713
% chg. over the last day: +0.15
Day's range: 110.542 – 110.847
52 wk range: 104.97 – 114.56
USD/JPY shows an ambiguous technical picture. The trading instrument is consolidating around 110.550 and 110.850. The demand for the safe currencies remains high due to the escalation of the US/China trading conflict. You should open positions from the key levels.
The Economic News Feed for 07.05.2019 is calm.
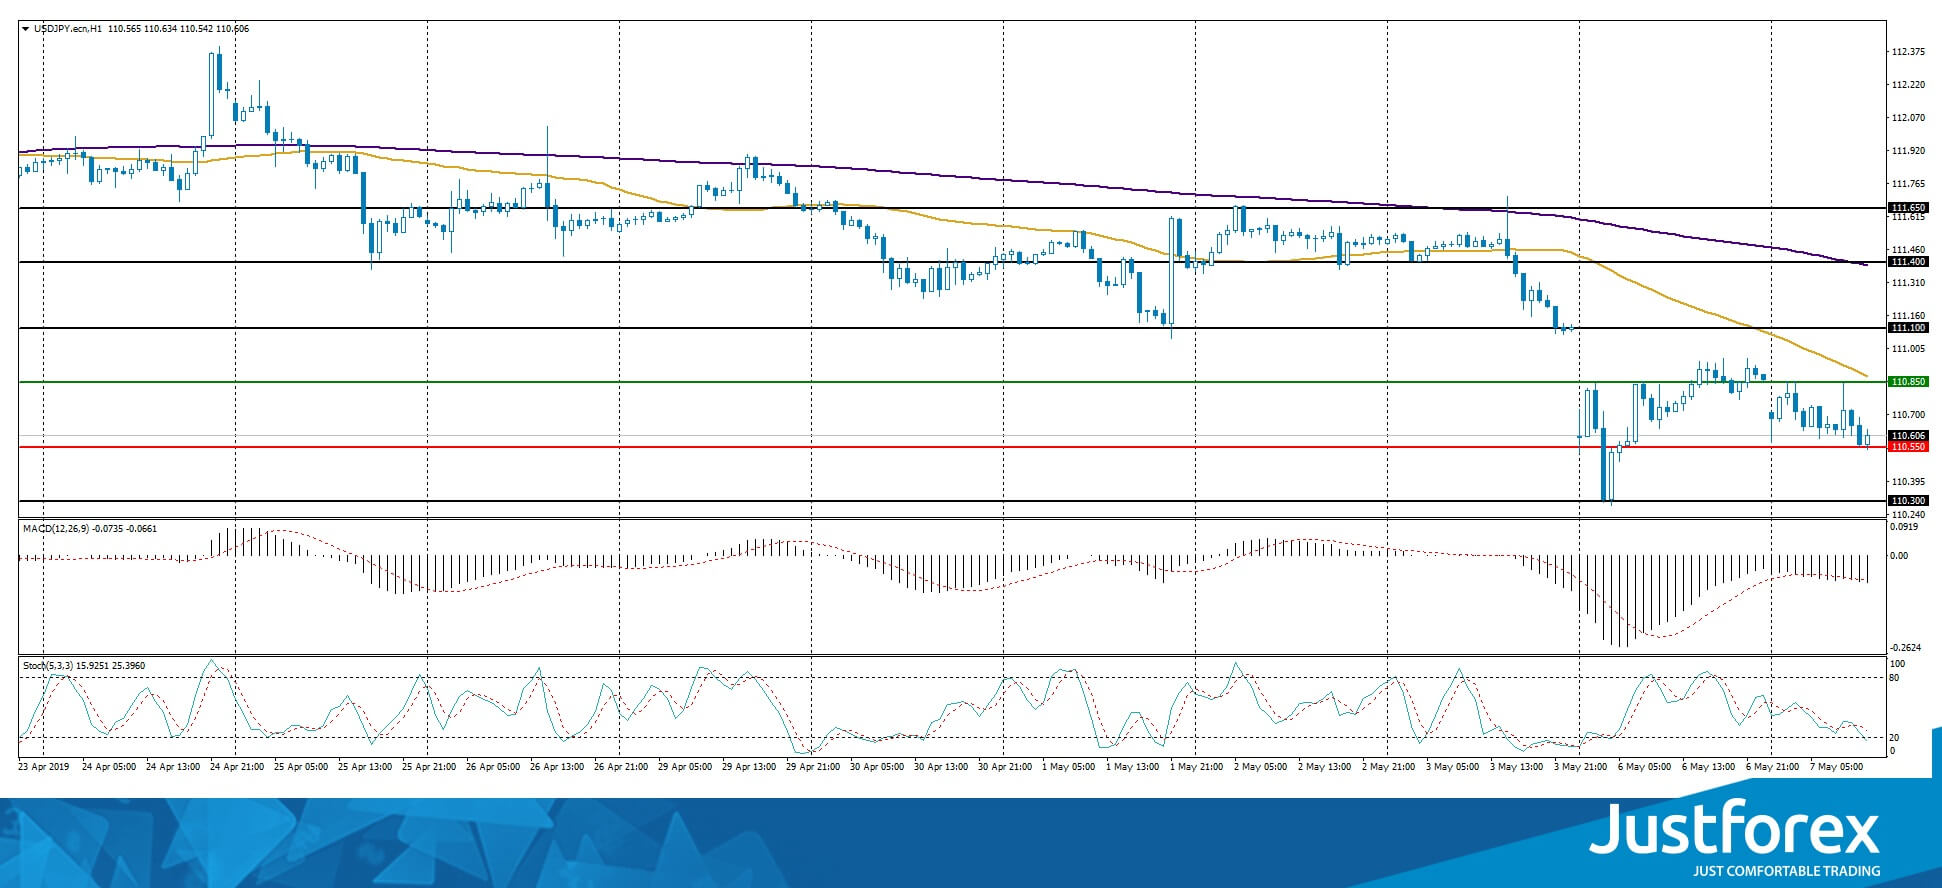
The price fixed below 50 MA and 200 MA which points to the power of the buyers.
The MACD histogram is in the negative zone and keeps falling which gives a strong signal to sell USD/JPY.
The Stochastic Oscillator is in the neutral zone, the %K line is below the %D line which points toward a bearish mood.
Trading recommendations
Support levels: 110.550, 110.300, 110.000
Resistance levels: 110.850, 111.100, 111.400
If the price fixes below the lcoal support level of 110.550, expect the quotes to fall toward 110.300-110.000.
Alternatively, the quotes can recover toward 111.100-111.300.
EUR/USD Tests Strong Resistance
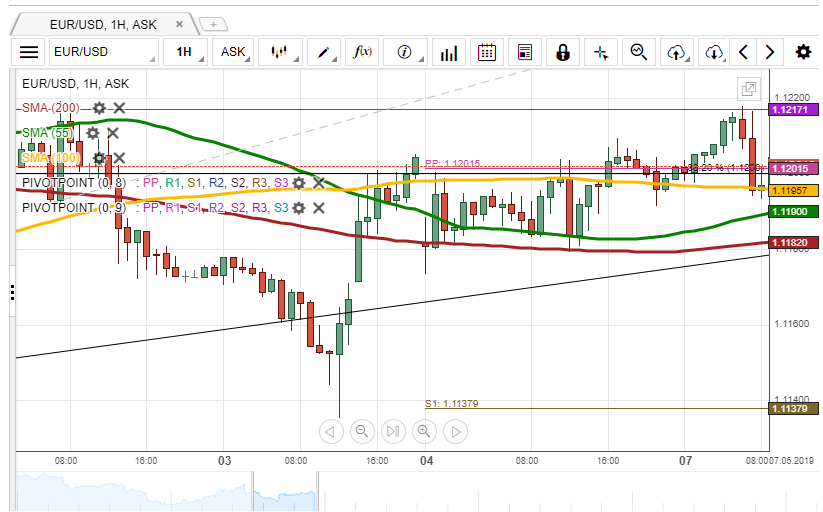
On Monday, the EUR/USD currency pair tried to surpass the resistance level formed by a combination of the Fibo 38.20%, the weekly PP and the 100-hour SMA at 1.1200.
During Tuesday's morning, the pair was testing the given resistance. Given that the exchange rate is supported by the 55– and 200-hour SMAs, it is likely, that some upside potential could prevail in the market. However, the rate also has to surpass the monthly PP at 1.1217.
If the given resistance holds, it is expected, that the rate continues to trade sideways around the 1.1200 level. Also, it is unlikely, that bears could prevail in the market, and the pair could trade down due to the given support.
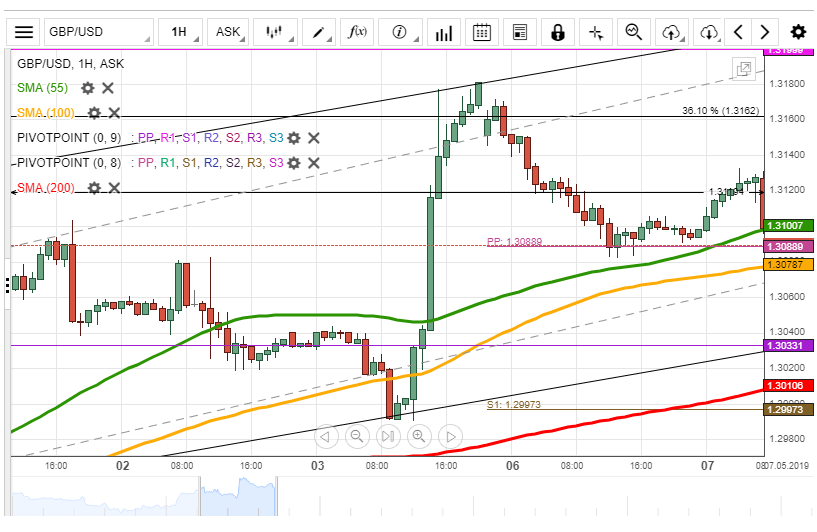
GBP/USD Supported By 55– And 100-Hour SMAs
Yesterday, the GBP/USD exchange rate declined to the support level formed by the weekly PP at 1.3089.
From a technical perspective, it is expected, that the rate could go upside, as it is supported by the 55– and 100-hour moving averages. A possible upside target is the Fibonacci 36.10% retracement at 1.3162.
On the other hand, the currency pair could trade sideways between the weekly PP and the 1.3120 level. Also, it is unlikely, that some downside momentum could prevail in the market, and the pair could slump lower than the lower boundary of the short-term ascending channel at 1.3040.
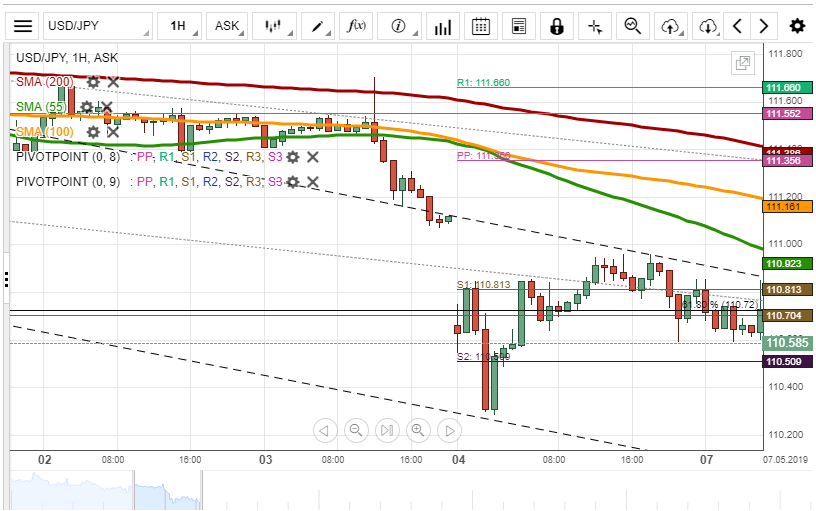
USD/JPY Could Trade Down
During the previous trading session, the Japanese Yen appreciated gradually against the US Dollar. On Tuesday's morning, the currency pair traded near the support level—the weekly S1 at 110.51.
If the given support does not hold, it is likely, that the pair maintains its decline. A possible downside target is the psychological level at the 110.30 mark.
Otherwise, it is expected, that the exchange rate could trade sideways between the given support level and the weekly S1 at 110.81.
Also, it is unlikely, that some upside potential could prevail in the market, as the rate is pressured by the 55-hour SMA at 110.94.
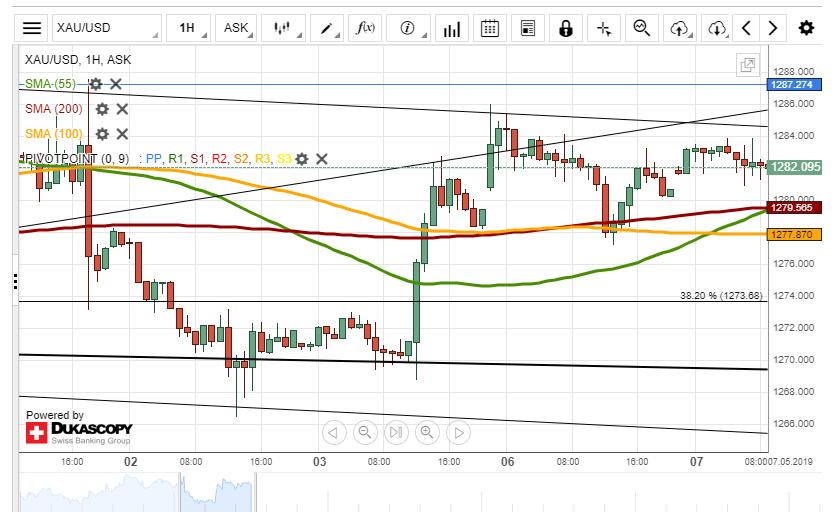
XAU/USD Supported By Moving Averages
On Monday, the XAU/USD exchange rate tried to breach the short-term descending channel north.
From a theoretical point of view, it is likely, that the rate could reverse south. However, note, that gold has to surpass the support level formed by a combination of the 55-, 100– and 200-hour SMAs located circa 1,280.00.
On the other hand, the price for gold could trade sideways between the given support level and the upper channel line located circa 1,284.00.
If the given channel does not hold, the price for gold could reach the resistance level—the monthly PP at 1,287.27.