Sample Category Title
USD/JPY Could Trade Sideways
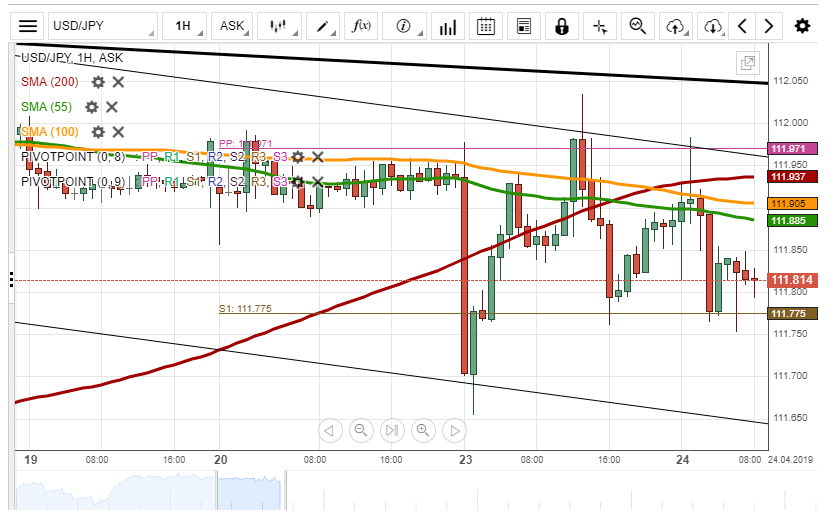
During previous trading session, the USD/JPY currency pair tried to breach the short-term descending channel north.
Given that the pair is pressured by the 55-, 100– and 200-hour SMAs, currently located in the 111.89/111.94 range, it is likely, that some downside potential prevails in the market. However, the pair has to surpass the weekly S1 at 111.78.
If the given support and resistance hold, it is expected, that the exchange rate trades sideways in the nearest future. Also, it is unlikely, that the rate could breach the given channel north in the short term due to the resistance level –the monthly PP at 111.97
XAU/USD Pressured By 55– And 100-Hour SMAs
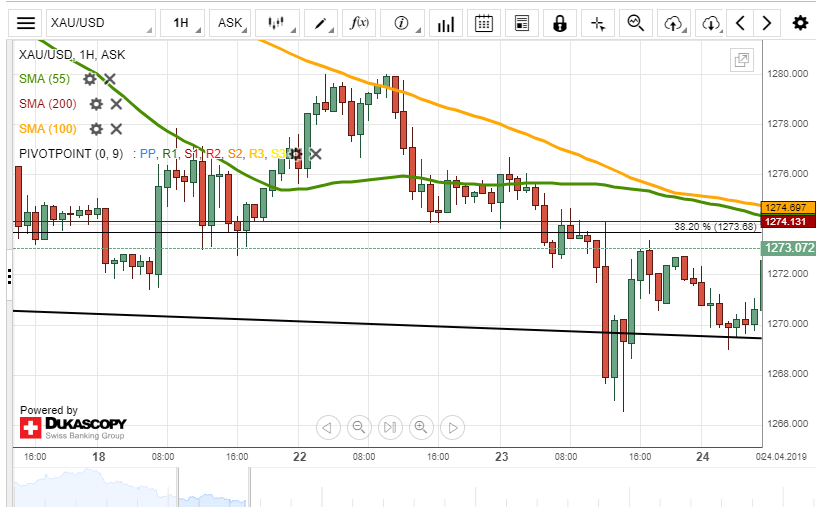
Yesterday, the XAU/USD exchange rate tested the lower boundary of the falling wedge pattern located circa 1,270,00.
From a theoretical point of view, the rate should reverse north and try to surpass the resistance level formed by a combination of the 55– and 100-hour SMAs, as well the monthly S1 and the Fibonacci 38.20% at 1,273.68.
If the given pattern does not hold, a breakout south might occur in the nearest future. It is likely, that the price for gold could target the psychological level at 1,265.00 mark.
AUD/USD Outlook: Aussie Pressures Key 0.70 Support On Fresh Acceleration After CPI Miss
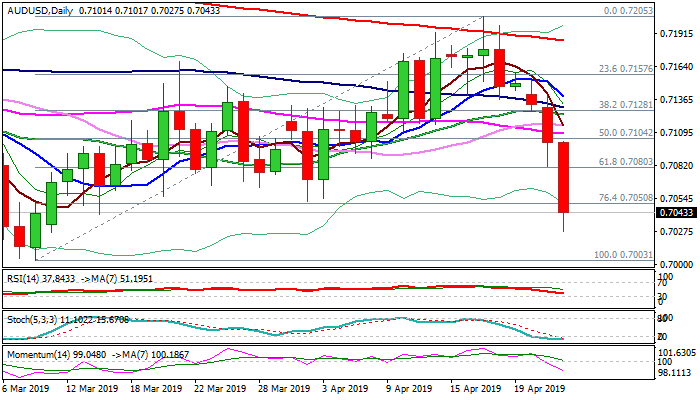
The Aussie dollar fell to new multi-week low at 0.7027 in Asia on Wednesday, down nearly 1% for the session after release of Australian inflation data.
Q1 CPI miss (q/q 0.0% vs 0.2% f/c, y/y 1.3% vs 1.5% f/c) increases risk of RBA rate cut in the next policy meeting in May and weighs on Aussie, along with rise of Us dollar.
Today's bearish acceleration marked over 76.4% retracement of bear-leg from 0.7205 (17 Apr high) and approached key support at 0.70 (8 Mar low / 50% retracement of 0.6706/0.7295 / psychological support) where strong bids can be expected.
Firm bearish setup of daily techs is supportive for further weakness, but oversold conditions suggest that bears may take a breather before attacking 0.70 support.
Broken base of thickening daily cloud (after cloud twisted on Monday), lays at 0.7090 and is expected to limit upticks and keep bears intact.
Res: 0.7080, 0.7090, 0.7116, 0.7137
Sup: 0.7027, 0.7000, 0.6955, 0.6925
Do Not Be Fooled By Record Highs, Smart Money Is Ready To Short
European markets and US futures are trading lower due to the lack of any significant easing signs from China. The fact is that if the economic data and corporate earnings continue to improve, there is no need for such a measure. In fact, it is the strong U.S. corporate earnings which drove the S&P500 and Nasdaq toward their record high yesterday. The S&P 500 index closed at 2933 while the Nasdaq Composite Index closed at 8120.
It wasn’t long ago when we saw the S&P500 index plunged all way to 2351 back in December. At the time, the general consensus was that there isn’t any strong catalyst which can drive the markets back towards their record high. However, speculators were wrong; the Fed changed its stance towards their monetary policy, the Muller report was less damaging than anticipated, Brexit tragedy is still somewhat contained, the trade war has almost cooled off and concerns over growth and corporate earnings were overly exaggerated.
The S&P 500 index is up 17% year-to-date (YTD) while the Nasdaq and Dow Jones indices have scored gains of 22% and 14% YTD respectively. Looking at these numbers one can clearly see why investors may suffer from FOMO, or fear of missing out. Nonetheless, markets have fully recovered from the brutal sell-off which started towards the tail end of last year.
The question which stands in front of us is how far this can go and what could be the next catalyst for such a rally?
The answer is pretty simple, corporate earnings need to stay robust. So far, the reporting season shows that nearly 79% of companies have beaten their profit estimates. Having said this, we have not seen massive participation from hedge funds or so-called institutional money. The recent CFTC data shows that the bullish sentiment for the S&P index decreased by 36% meaning we have more short positions in the market. This shows that smart money is ready to bank big if the market falls again. Moreover, one thing is for certain when it comes to smart money, it does not like to play the catch-up game.
Thus, the safest bet is to have insurance in your portfolio. The VIX volatility index is incredibly cheap, it is down 51% YTD. Given the record highs in the market, it makes absolute sense to buy volatility at its record low levels. I am not saying that the major benchmarks have run out of steam, it is highly likely that the S&P 500 index may continue its move to towards the 3,001 level, this is the next major resistance. It would be a smart idea to have some insurance while one maintains its bullish view on the index based on the earnings and the Fed's dovish stance.
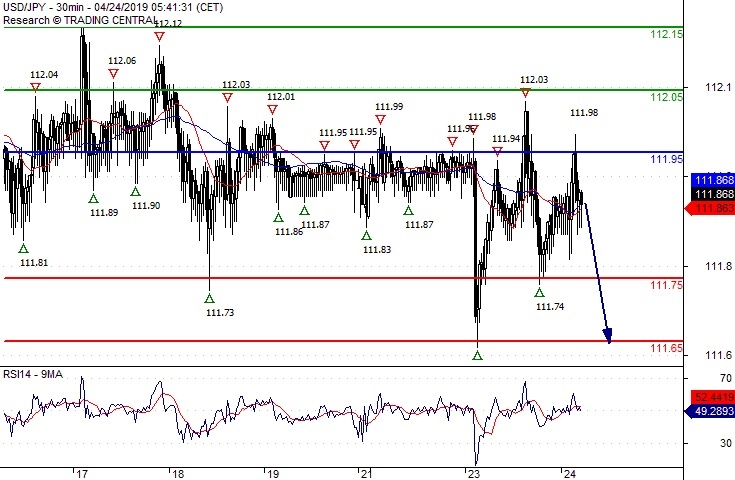
USD/JPY Choppy
Pivot (invalidation): 111.95
Our preference Short positions below 111.95 with targets at 111.75 & 111.65 in extension.
Alternative scenario Above 111.95 look for further upside with 112.05 & 112.15 as targets.
Comment As Long as the resistance at 111.95 is not surpassed, the risk of the break below 111.75 remains high.
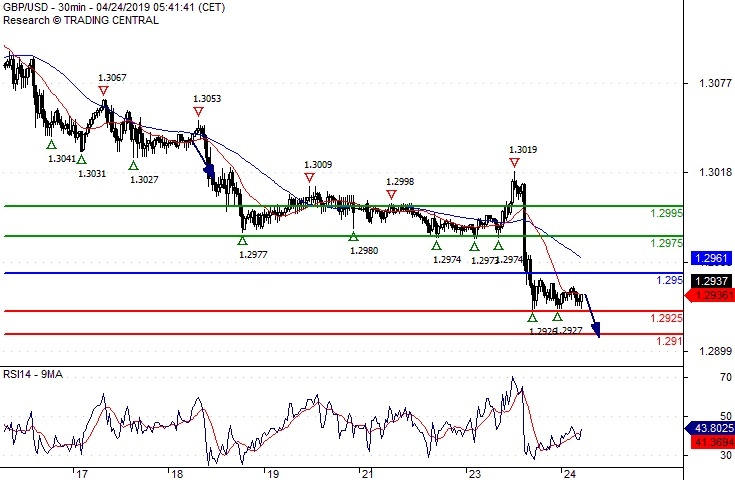
GBP/USD Watch 1.2910
Pivot (invalidation): 1.2950
Our preference Short positions below 1.2950 with targets at 1.2925 & 1.2910 in extension.
Alternative scenario Above 1.2950 look for further upside with 1.2975 & 1.2995 as targets.
Comment A break below 1.2925 would trigger a drop towards 1.2910.
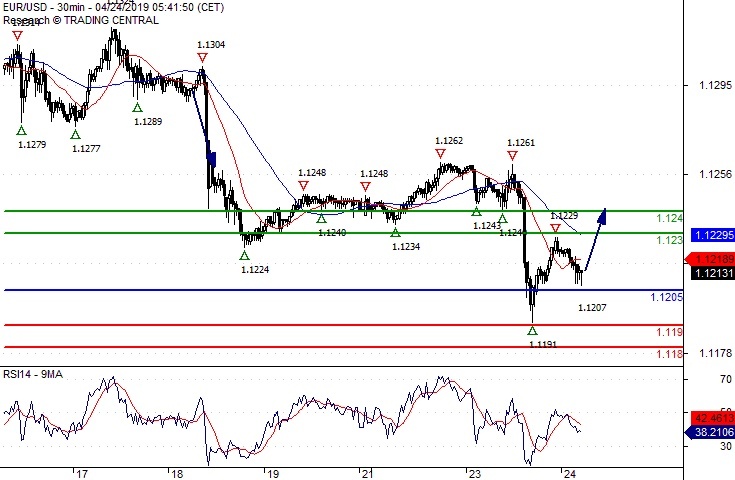
EUR/USD Caution
Pivot (invalidation): 1.1205
Our preference Long positions above 1.1205 with targets at 1.1230 & 1.1240 in extension.
Alternative scenario Below 1.1205 look for further downside with 1.1190 & 1.1180 as targets.
Comment Intraday technical indicators are mixed and call for caution.
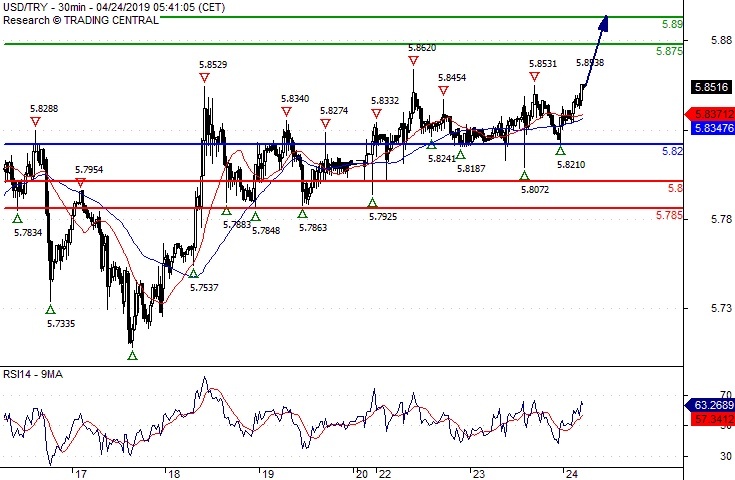
USD/TRY Further Upside
Pivot (invalidation): 5.8200
Our preference Long positions above 5.8200 with targets at 5.8750 & 5.8900 in extension.
Alternative scenario Below 5.8200 look for further downside with 5.8000 & 5.7850 as targets.
Comment The RSI calls for a new upleg.
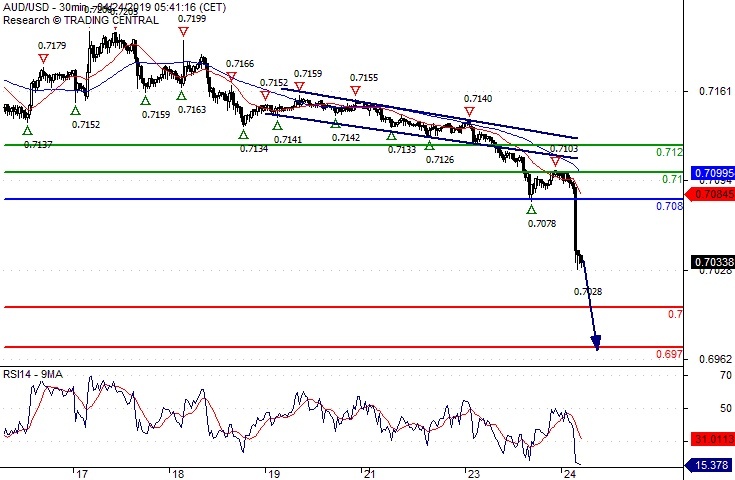
AUD/USD The Downside Prevails
Pivot (invalidation): 0.7080
Our preference Short positions below 0.7080 with targets at 0.7000 & 0.6970 in extension.
Alternative scenario Above 0.7080 look for further upside with 0.7100 & 0.7120 as targets.
Comment The RSI has broken down its 30 level.
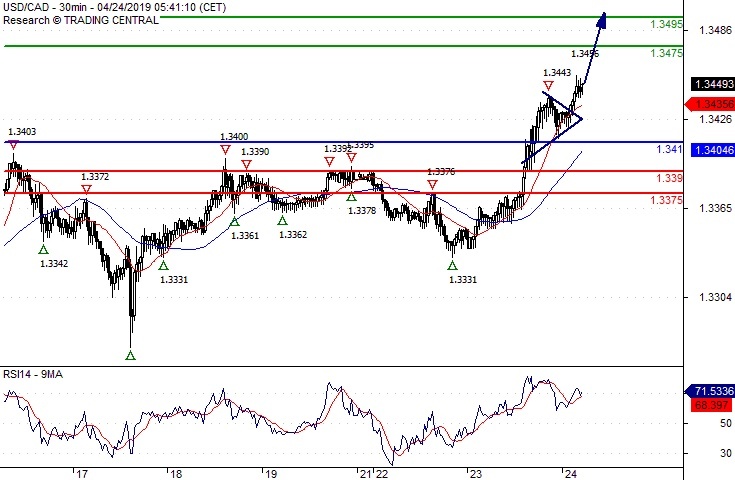
USD/CAD Target 1.3495
Pivot (invalidation): 1.3410
Our preference Long positions above 1.3410 with targets at 1.3475 & 1.3495 in extension.
Alternative scenario Below 1.3410 look for further downside with 1.3390 & 1.3375 as targets.
Comment The RSI is bullish and calls for further advance.