Sample Category Title
The Analytical Overview Of The Main Currency Pairs
The EUR/USD currency pair
Technical indicators of the currency pair:
Prev Open: 1.12567
Open: 1.12260
% chg. over the last day: -0.31
Day's range: 1.12010 – 1.12260
52 wk range: 1.1214 – 1.2557
Yesterday USD strengthened against the competition. The EUR/USD quotes lowered by 50 points and reached 1.12000. 1.12300 acts as a mirror resistance. The demand for the USD grew due to positive US real estate reports. The currency pair has a tendency to descend. The investors are waiting for important releases from Germany. You should open positions from the key levels.
The Economic News Feed for 24.04.2019:
Business Climate Index (EU) – 11:00 (GMT+3:00);
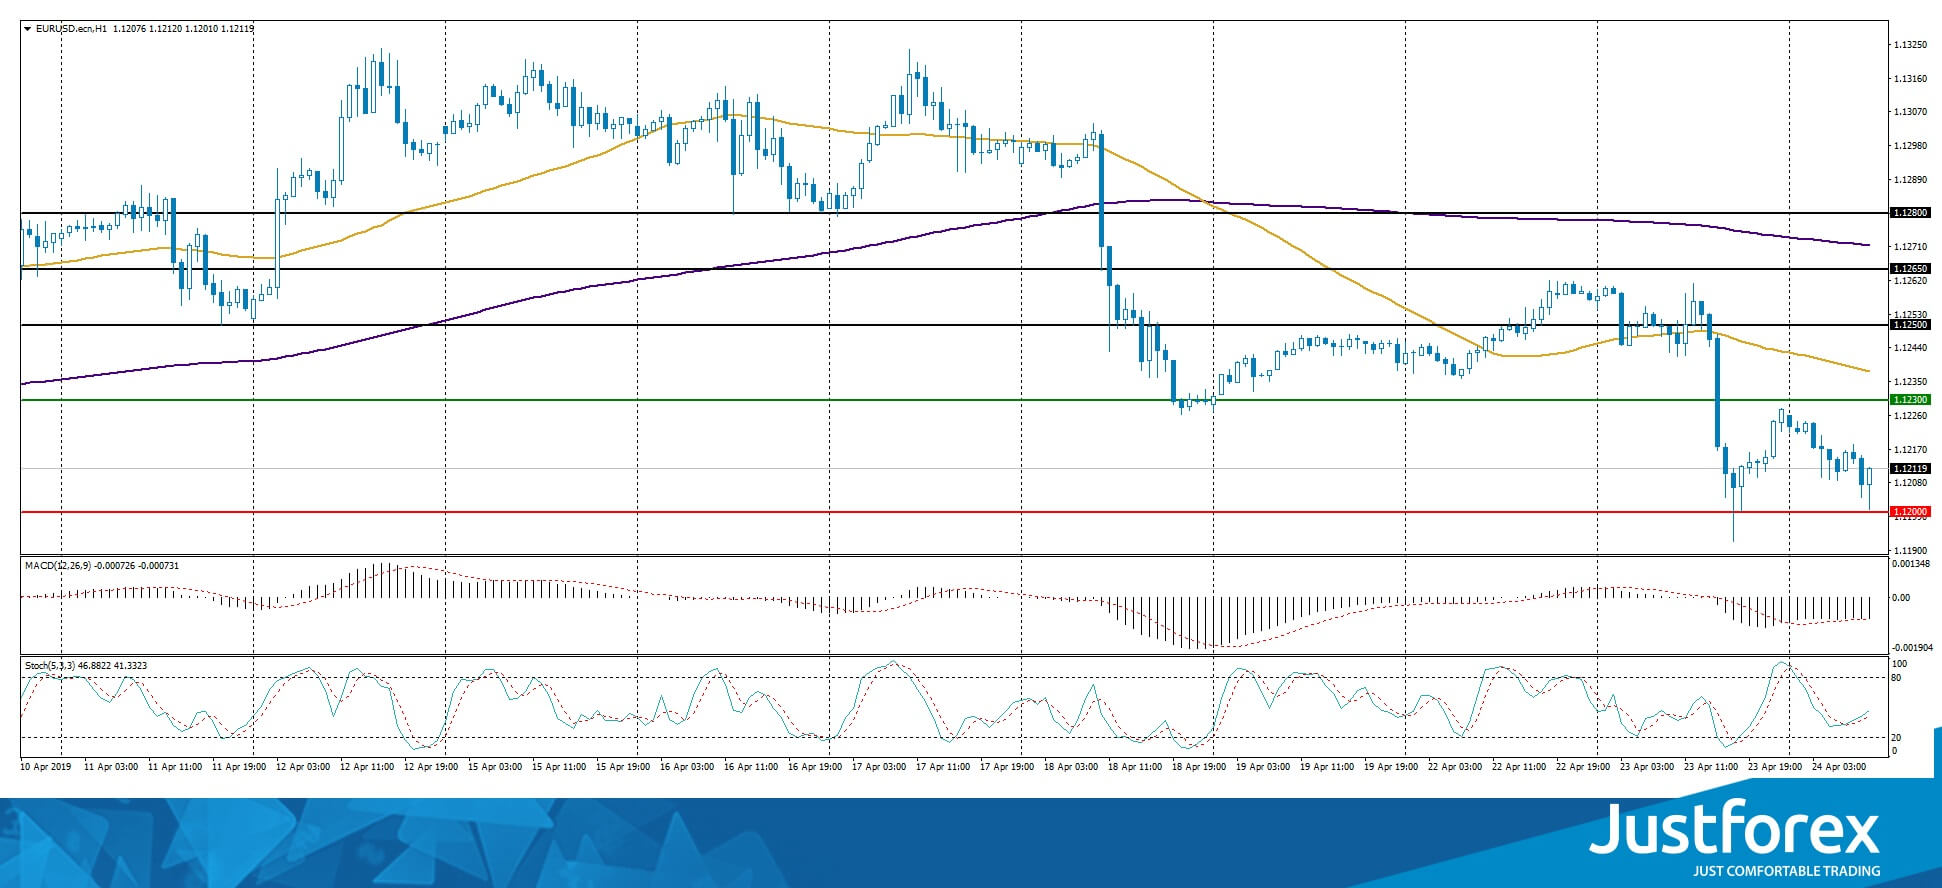
The price fixed below 50 MA and 200 MA which points to the power of the buyers.
The MACD histogram is in the negative zone and keeps falling, which points to the bearish mood.
The Stochastic Oscillator is in the neutral zone, the %K line is above the %D line which gives a signal to buy EUR/USD.
Trading recommendations
Support levels: 1.12000, 1.11500
Resistance levels: 1.12300, 1.12500, 1.12650
If the price fixes below 1.12000, expect further descend toward 1.11600-1.11400.
Alternatively, the quotes can recover toward 1.12500-1.12650.
The GBP/USD currency pair
Technical indicators of the currency pair:
Prev Open: 1.29812
Open: 1.29369
% chg. over the last day: -0.37
Day's range: 1.29151 – 1.29431
52 wk range: 1.2438 – 1.4378
GBP/USD is in a bearish mood. The GBP has updated the two-month minimums. The demand for USD has grown after the positive real estate sales report from the US. The Brexit ambiguousness keeps pushing the GBP down. The British parliament has returned from the Easter holidays, the investors are waiting on more information regarding Brexit. Right now the quotes are consolidating aroun 1.29200-1.29500. The trading instrument has a tendency to descend, you should open positions from the key levels.
The Economic News Feed for 24.04.2019 is calm.
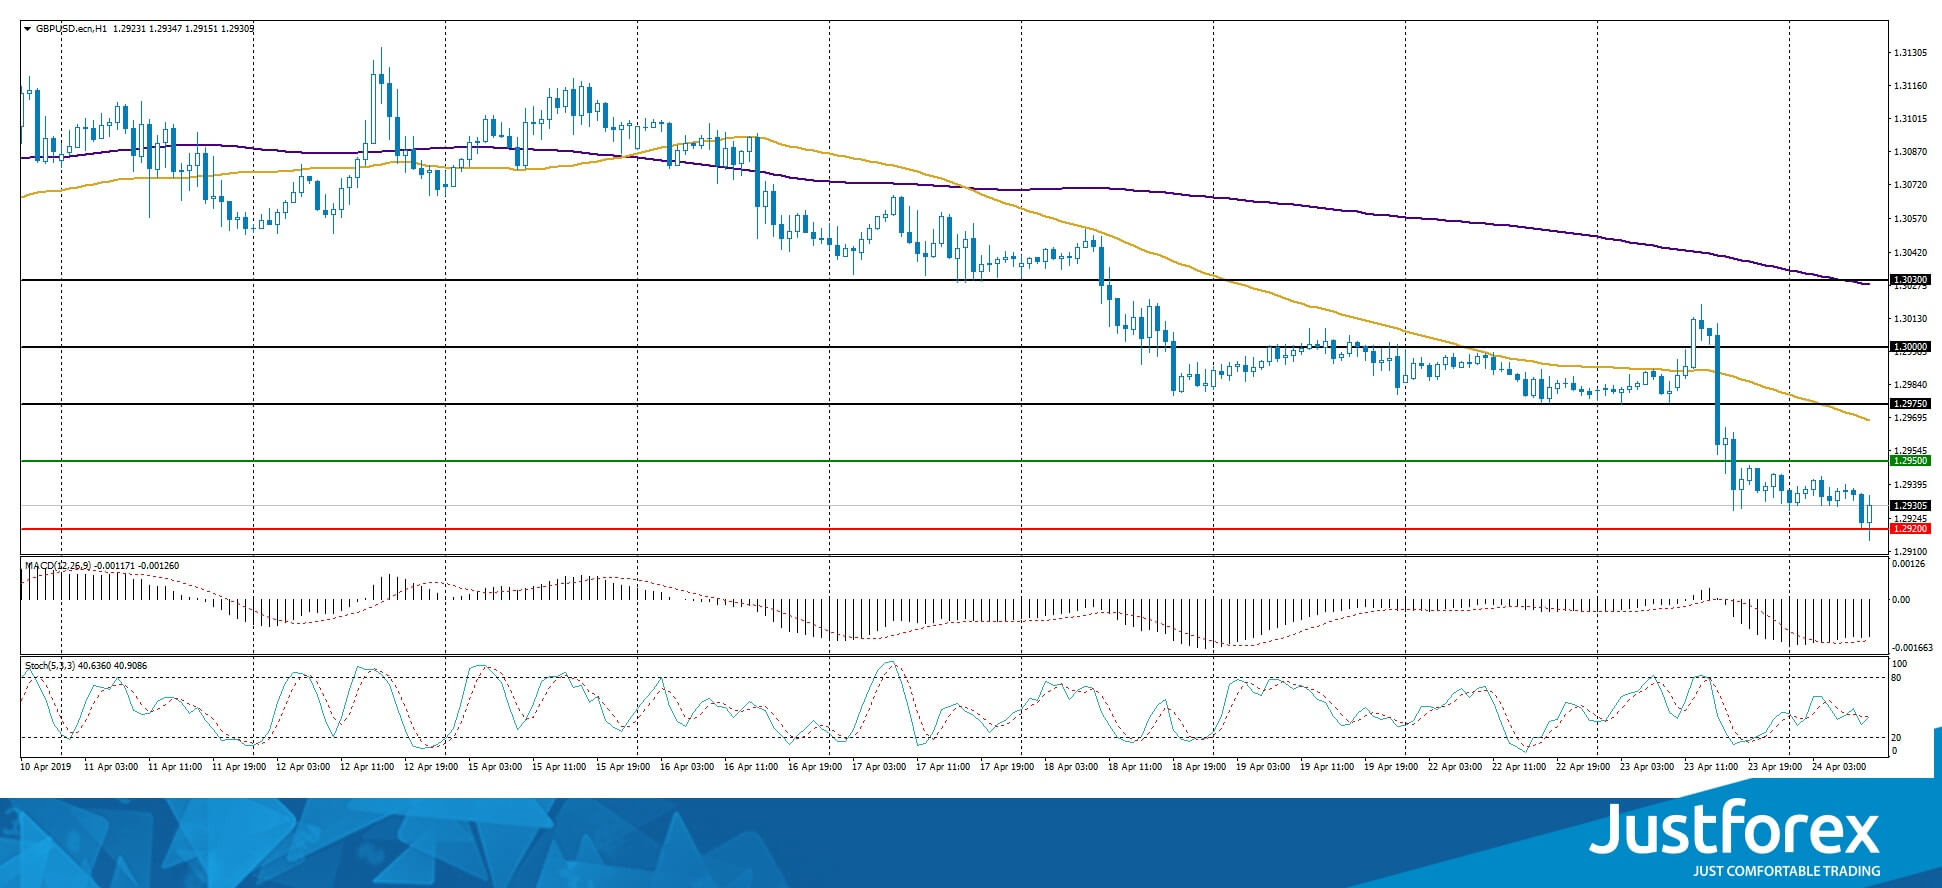
The price fixed below 50 MA and 200 MA which points to the power of the buyers.
The MACD histogram is in the negative zone but above the signal line which points towards the sale GBP/USD.
The Stochastic Oscillator is in the neutral zone, the %K line is crossing the %D line. There are no signals at the moment.
Trading recommendations
Support levels: 1.29200, 1.29000
Resistance levels: 1.29500, 1.29750, 1.30000
If the price fixes below 1.29200, expect further descend towards 1.29000-1.28700.
Alternatively, the quotes can recover toward 1.29750-1.30000.
The USD/CAD currency pair
Technical indicators of the currency pair:
Prev Open: 1.33499
Open: 1.34172
% chg. over the last day: +0.64
Day's range: 1.34166 – 1.34616
52 wk range: 1.2248 – 1.3664
CAD is weakened against the USD after the decision of the Bank of Canada regarding the key interest rate. During the last two days, the quote grew by 100 points. The trading instrument set the new monthly maximums. The key range is 1.34300-1.34600. The experts are waiting for the Bank of Canada to set the key parameters of monetary policy on the same level. Keep an eye on the comments by the representatives of the Bank. You should open positions from the key levels.
The Economic News Feed for 24.04.2019:
Announcment of the new key interest rate (CAD) – 17:00 (GMT+3:00);
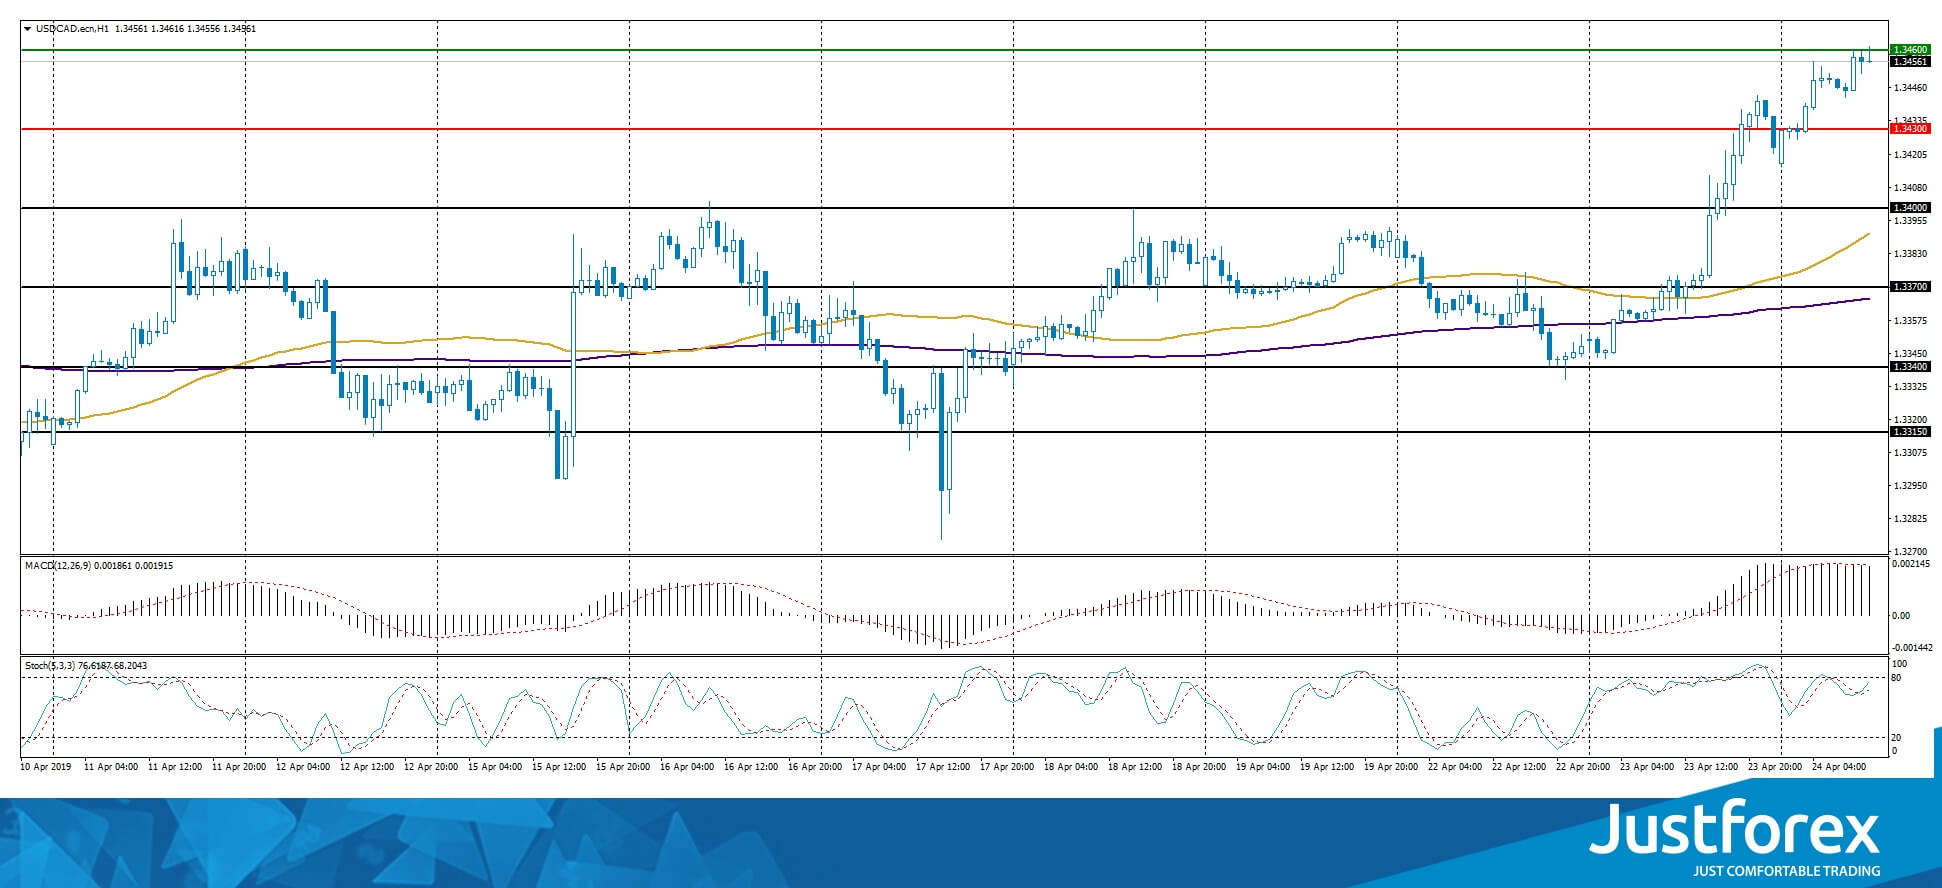
The price fixed above 50 MA and 200 MA which points to the power of the buyers.
The MACD histogram is in the positive zone but below the signal line which gives a weak signal to buy USD/CAD.
The Stochastic Oscillator is in the positive zone but below the signal line which gives a weak signal to buy USD/CAD.
Trading recommendations
Support levels: 1.34300, 1.34000, 1.33700
Resistance levels: 1.34600, 1.35000
If the price fixes above 1.34600, expect further growth toward 1.35000.
Alternatively, the quotes can descend toward 1.34000-1.33700.
The USD/JPY currency pair
Technical indicators of the currency pair:
Prev Open: 111.919
Open: 111.861
% chg. over the last day: -0.05
Day's range: 111.749 – 111.983
52 wk range: 104.56 – 114.56
USD/JPY remains in a long flat. There is no defined trend. The investors are waiting for additional drivers. The key support and resistance levels are 111.650 and 112.000. USD/JPY has a tendency to descend. Keep an eye on the US Treasury bonds' yield and open positions from the key levels.
The Economic News Feed for 24.04.2019 is calm.
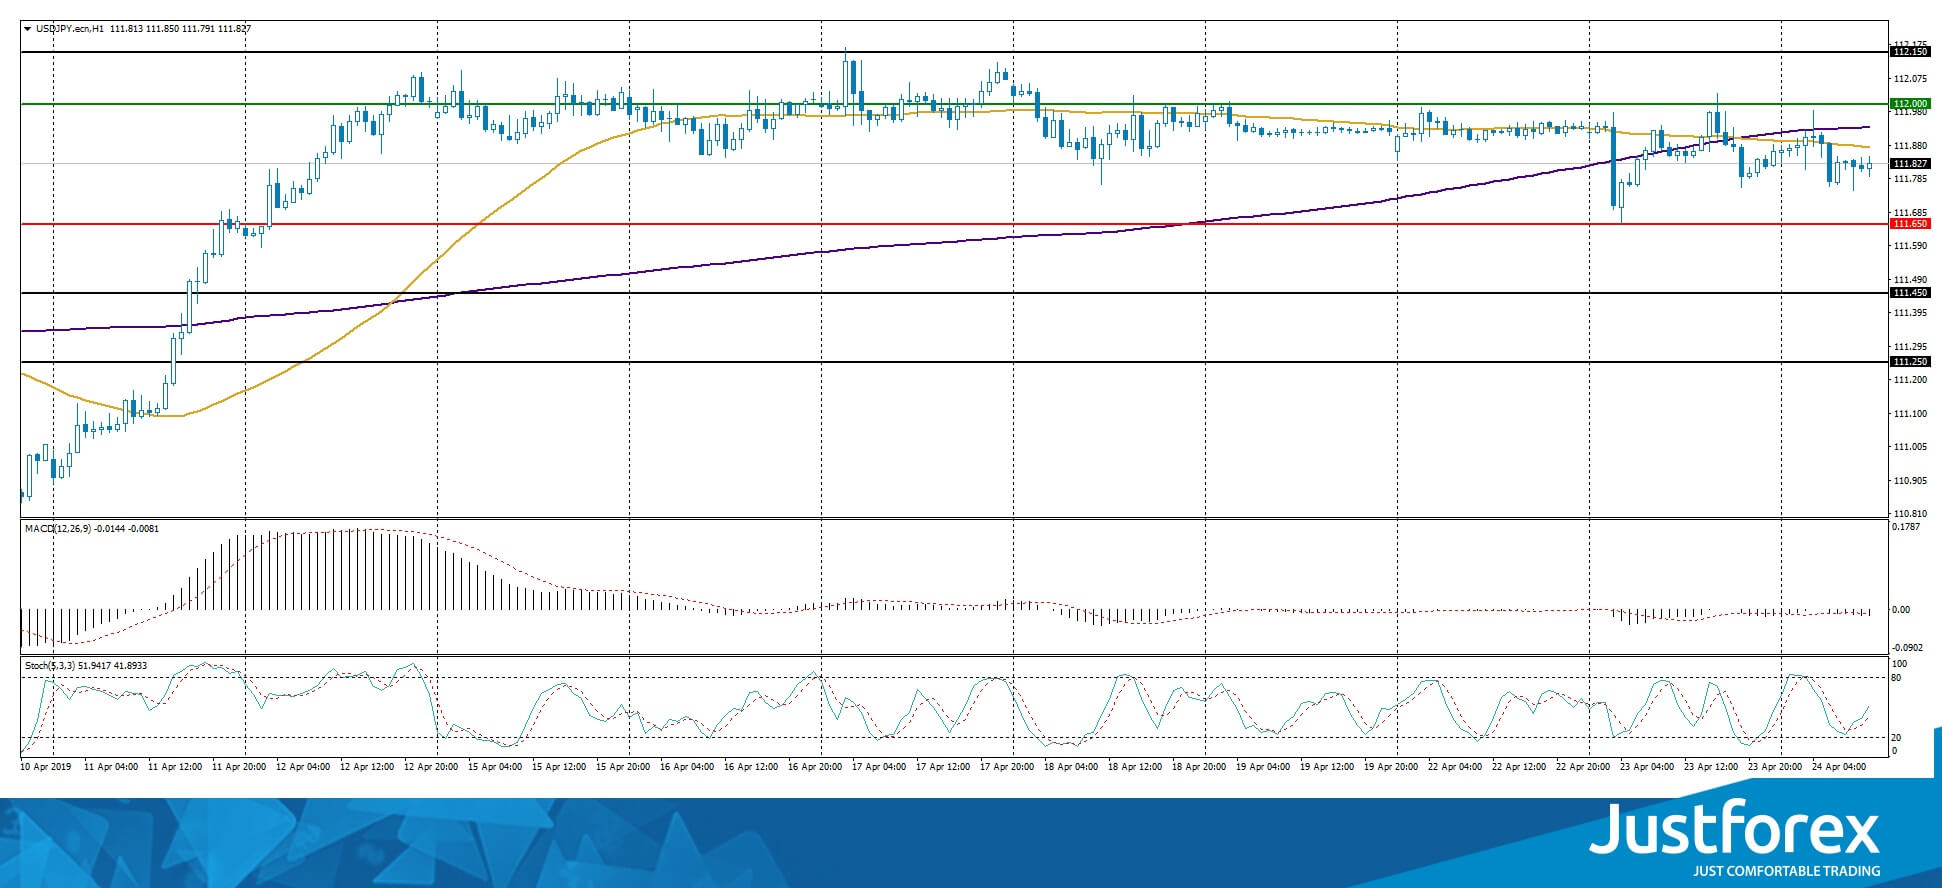
The indicators do not provide precise signals, 50 MA has crossed 200 MA.
The MACD histogram is in the negative zone which points toward a bearish mood.
The Stochastic Oscillator is in the neutral zone, the %K line is above the %D line which gives a signal to buy USD/JPY.
Trading recommendations
Support levels: 111.650, 111.450, 111.250
Resistance levels: 112.000, 112.150, 112.500
If the price fixes below 111.650, expect further descend toward 111.400-111.200.
Alternatively, the quotes can grow toward 112.300-112.500.
The US Dollar Is In The Green. The Bank Of Canada Meeting IS IN The Focus Of Attention
The US dollar strengthened against a basket of major currencies amid the publication of optimistic statistics on the real estate market. Thus, new home sales in the US increased by 4.5% to 692K in March, while experts expected a decline by 3.0% to 647K. The dollar index (#DX) closed in the positive zone (+0.38%). Financial market participants returned to trading after the Easter holidays. Investors expect preliminary data on US GDP for the first quarter, which will be published on Friday.
During the Asian trading session, weak economic data have been published in Australia. Thus, the consumer price index in Q1 remained unchanged, while investors forecasted growth by 0.2% (q/q). Inflation slowed down from 1.8% to 1.3% (year-on-year). Earlier, the Reserve Bank of Australia reported that it was ready to raise the issue of lowering interest rates if future economic releases would be pessimistic. Today, the Bank of Canada will announce its decision on a key interest rate. As experts expect, the interest rate will remain unchanged at 1.75%. We recommend paying attention to the comments by representatives of the regulator.
On Wednesday, British Treasury Secretary, Philip Hammond, said that he started the search for next Bank of England Governor. Mark Carney took office on July 1, 2013, and will leave office on January 31, 2020.
The "black gold" prices have been declining. At the moment, futures for the WTI crude oil are testing the mark of $65.80 per barrel. At 17:30 (GMT+3:00) data on crude oil inventories will be published in the United States.
Market Indicators
- Yesterday, the bullish sentiment was observed in the US stock market: #SPY (+0.90%), #DIA (+0.53%), #QQQ (+1.27%).
- The 10-year US government bonds yield fell again. Currently, the indicator is at the level of 2.55-2.56%.
The news feed for 2019.04.24:
- German IFO business climate index at 11:00 (GMT+3:00);
- Bank of Canada interest rate decision at 17:00 (GMT+3:00).
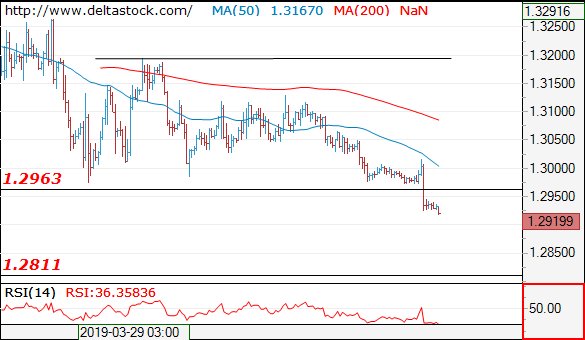
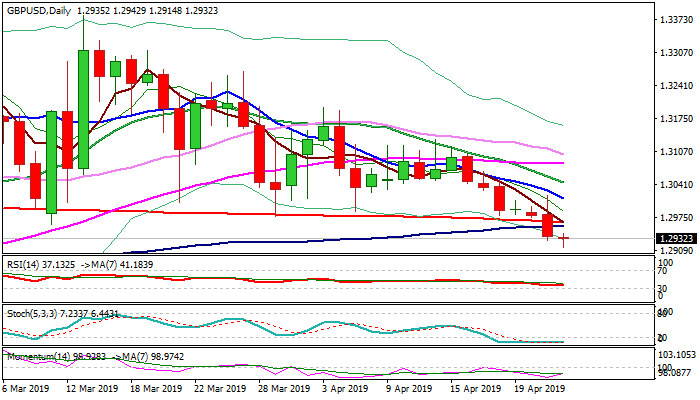
GBP/USD Outlook: Bears Consolidate Above New 2-Mth Low After Eventual Break Below Key 200SMA Support
Cable hit new two-month low at 1.2914 on Wednesday, in extension of previous day's strong fall, mainly driven by rallying dollar and soured sentiment on no substantial changes in stalled Brexit talks.
Tuesday's break and close below key supports provided by converging 200 / 100SMA's at 1.2965/57 respectively (200SMA kept the downside attempts limited since 19 Feb) was strong bearish signal.
Bears eye key Fibo support at 1.2889 (50% retracement of 1.2397/1.3381 ascend), violation of which would risk extension towards next key level at 1.2773 (14 Feb trough / Fibo 61.8% of 1.2397/1.3381).
Meanwhile, deeply oversold stochastic suggest that bears may pause ahead of 1.2889 target and bounce, in positioning for fresh push lower.
Broken 200SMA (reinforced by formation of 5/200SMA bear-cross) should ideally cap upticks, but stronger recovery towards daily cloud base (1.3024) cannot be ruled out.
Res: 1.3008,1.3024,1.3034,1.3059
Sup: 1.2975,1.2966,1.2960,1.2916
EUR/JPY Likely To Make Brief Pullback
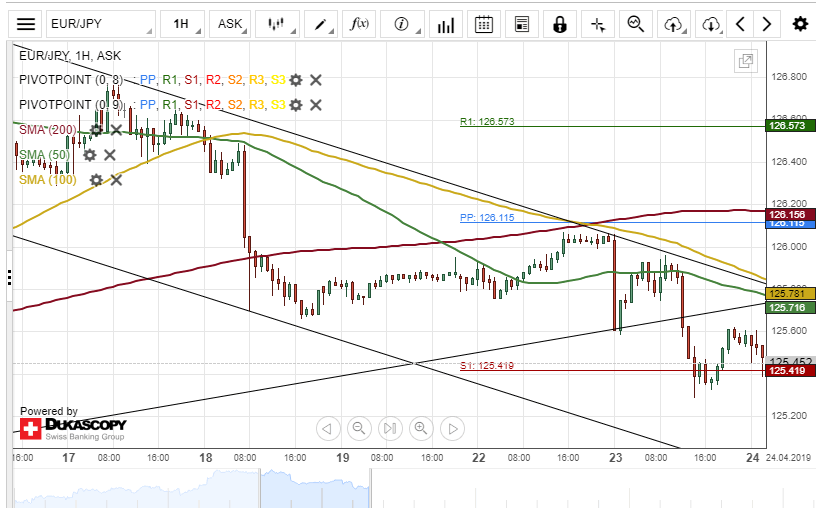
The single European currency depreciated about 73 base points against the Japanese Yen on Tuesday. A breakout occurred through the lower boundary of an ascending channel pattern during yesterday's trading session.
A new junior descending channel was revealed during Wednesday's session. Most likely, the currency exchange rate will maintain the newly formed junior descending channel pattern today.
However, it is expected that the EUR/JPY pair makes a brief retracement towards a resistance level formed by the 50-hour simple moving average at 125.74 within this trading session.
AUD/USD Might Make Retracement North
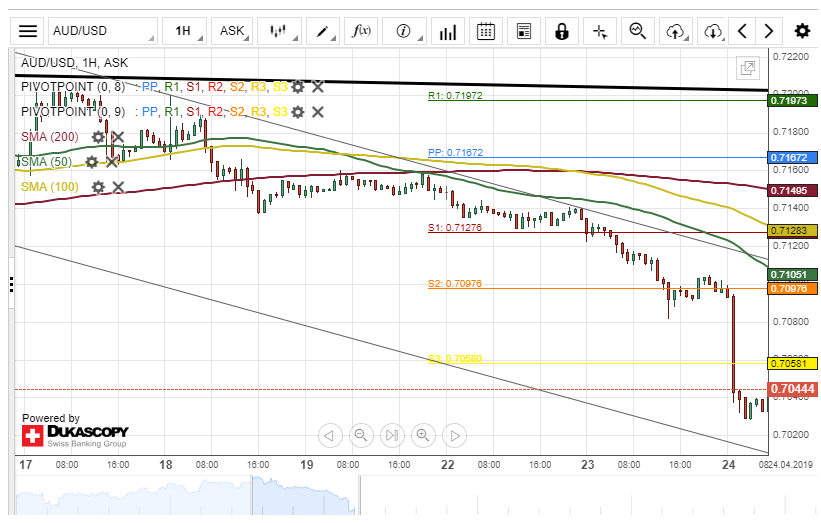
The Australian Dollar has depreciated about 110 base points against the US Dollar since yesterday's trading session. The currency pair reached a six-week low level during Tuesday's session.
Everything being equal, it is likely that the AUD/USD exchange rate regain some of its lost points today. Bulls could push the price towards a resistance cluster formed by the combination of the weekly and the monthly PPs at 0.7097.
If the resistance cluster as mentioned earlier holds, the currency exchange rate will continue its downward movement during the following trading session.
USD/CAD Bulls Market
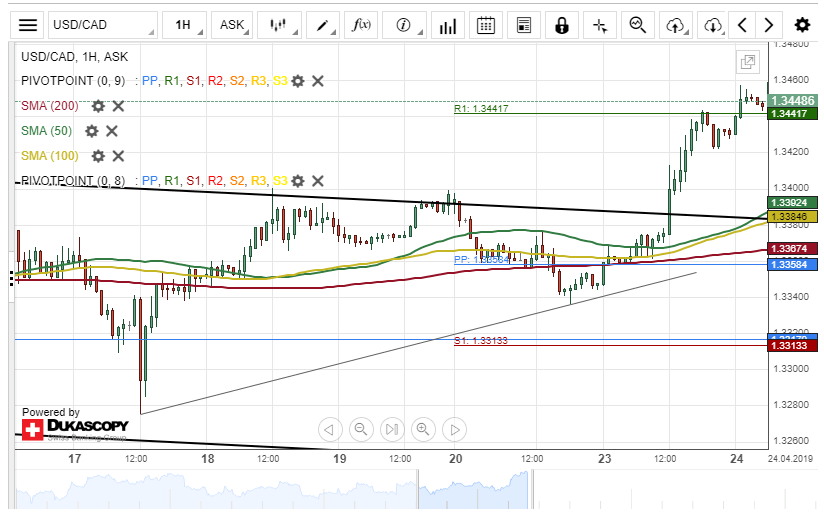
During the last 24 hours, the US Dollar has gained about 116 base points against the Canadian Dollar. The currency pair reached near a six-week high during Wednesday's trading session.
By and large, it is likely that the USD/CAD currency pair will continue its upside movement within this session. The potential upside target will be near the weekly R2 at 1.3486.
Although, the currency exchange rate could reverse from the current price level at 1.3457 and aim for a support cluster at 1.3387 during the following trading session.
NZD/USD Decline Likely To Continue
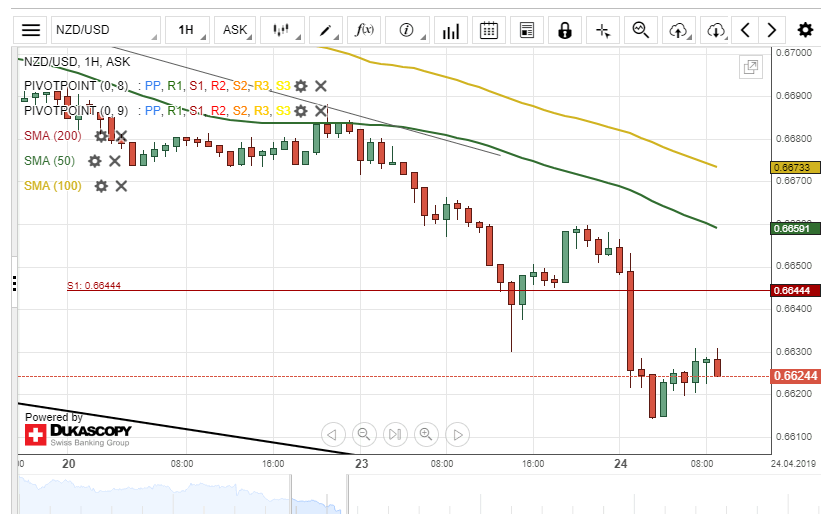
The New Zealand Dollar depreciated about 58 base points against the US Dollar on Tuesday. The decline was stopped by a support cluster formed by the combination of the weekly and the monthly PPs at 0.6644.
However, today's session began with the bearish momentum and by the middle of the European trading session, the exchange rate has reached the lower boundary of a descending channel pattern at 0.6625.
A breakout through the lower boundary of the descending channel pattern could occur today if the currency exchange rate continues its decline.
Peak Optimism Or Overly Bearish?
Peak Optimism or Overly Bearish?
A flood of better-than-expected corporate quarterly earning was a wake-up call to overly pessimistic investors. Snap and Twitter posted solid 1Q results triggering a broad-based rally in large-cap tech, propelling the S&P 500 to new all-time highs. Snap's revenue, generated from selling advertising, rose 39% to $320.4m well above analyst estimates of $306.6m. In commodities expectations for harder US stance on Iran sanctions pushed oil prices higher causing energy complex to gain. The USD gained against G10 currencies as opportunities in the US equity markets attracted capital globally. In addition, the higher yields (despite risk appetite improvement treasuries gained) makes the capital rotation extra sticky. It’s unlikely that the greenback dominance will fade anytime soon. Volatility is lingering around a diminishing 12.54 further encouraging risk-taking.
Overnight, China’s stocks were unable to maintain the strong goodwill as concerns over the direction of monetary policy were questioned. However, any adjustment to the PBoC dovish tone and prospect of further stimulus measures is due to improving the economic outlook. Given the incoming data, we are cautiously optimistic on China stabilization. In this context commodity prices, including crude oil and industrial metals, look cheap. China 1Q GDP came in at 6.4% y/y driven by industrial production growth. 2Q exports should rebound as a likely US-China trade deal is near and global demand continues to firm. The surge in domestic and external demand suggests that markets have underestimated China growth prospects. With policy to remain supportive of economic “green shoots” although new stimulus might not be necessary has indicated that recent Politburo meeting. It’s hard to image stocks heading higher form these lofty height however, with lower event risk, supportive central banks and improving global macro-economic backdrop corporate earnings should further improve.
Australian shares in spree as rate cut expected in May
It’s a bullish start of the week for Australian equities and a good kickoff on public holidays. The Reserve Bank of Australia (RBA) policy minutes have already had an effect, but the recent quarterly inflation data releases is a confirmation that the RBA next step will be a rate cut. The cash rate of 1.50% is already at historical low and largely below neutral level. Both q/q and y/y headline CPI came largely below expectations, pointing at 0% (0.20%) and 1.30% (1.50%), lowest since 2016.
The reaction on the markets was not long in coming. The muted inflation figure combined with a slight rise in unemployment figure had investors selling the Aussie and becoming the major G10 currency loser of the day while Australian S&P ASX 200 gained as much as 1%, closing at 6382.14, its highest range since December 2007 with exporting companies benefitting the most. A profit-taking session is therefore very likely.
In light of the recent events, we expect AUD weakness to accelerate ahead of 7 May 2019 monetary policy meeting while elections following right after should have a different impact. Currently trading at 0.7044, AUD/USD is heading along 0.7030 short-term.
EURJPY Turns Lower After Creating Double Top Formation At 126.80
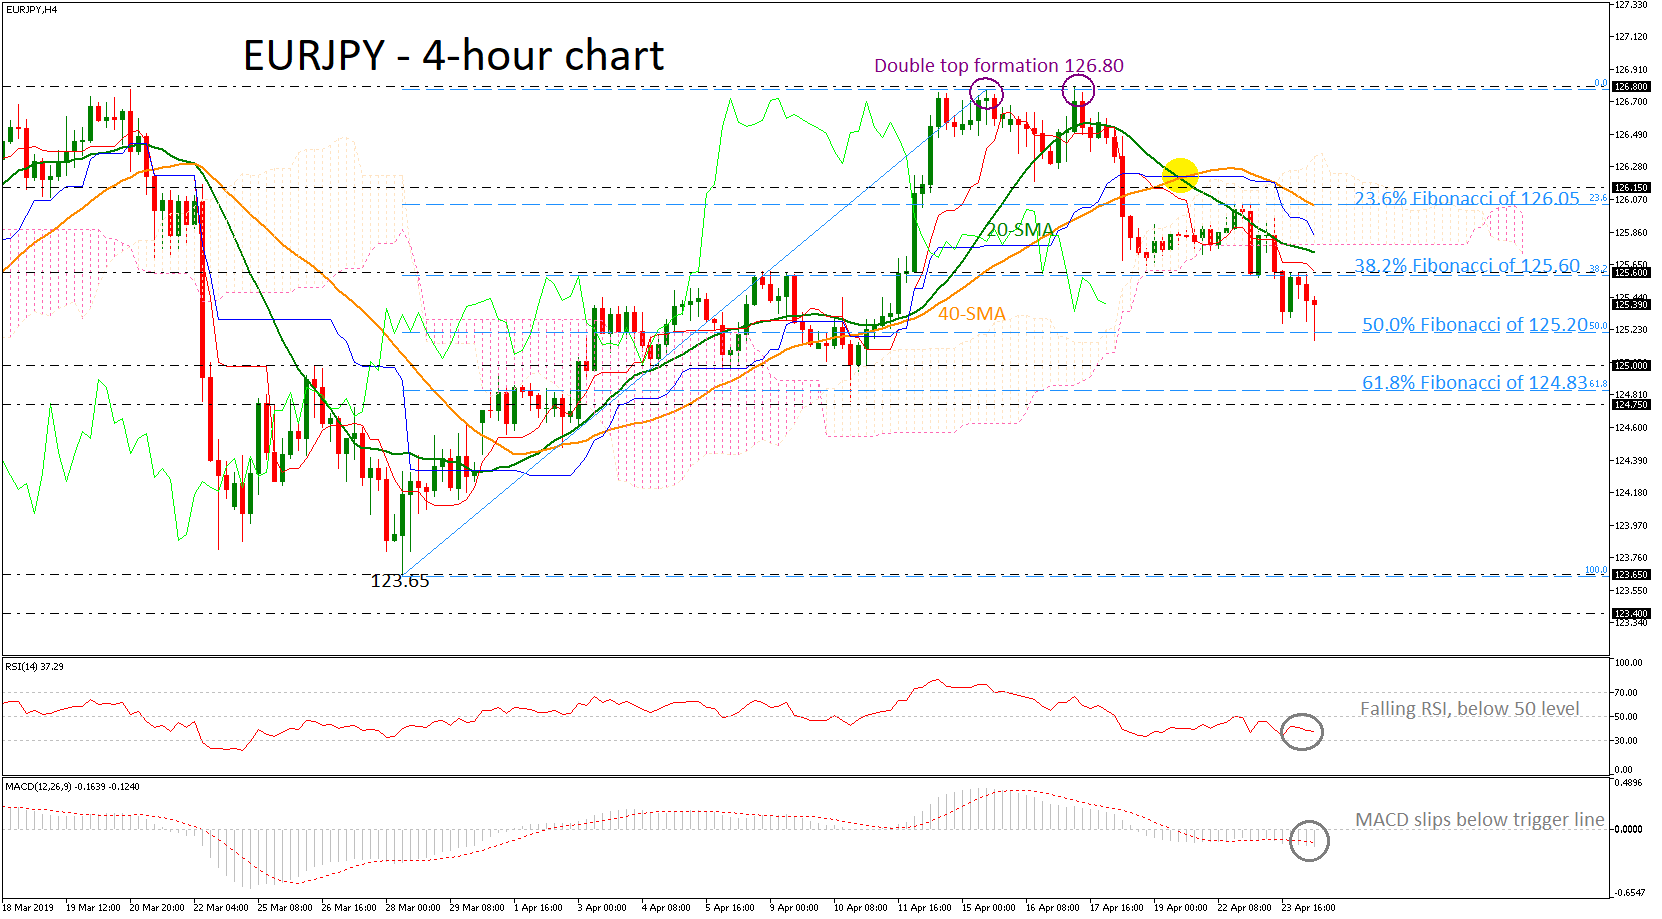
EURJPY is trading lower after it faced a double top formation on the 126.80 resistance level on April 15 and April 17. The price is challenging today the 50.0% Fibonacci retracement level of the upleg from 123.65 to 126.80 around 125.20, posting a new two-week low.
The successful fall below the 20- and 40-simple moving averages (SMAs) and the red Tenkan-sen line gives the opportunity to traders to think about potential bearish actions in the near term. The RSI is heading towards the oversold level, while the MACD declined below its trigger line.
A close below the 50.0% Fibonacci of 125.20 would boost bearish sentiment, shifting attention straight down to the 125.00 handle. A drop below this line could increase downside momentum until the 61.8% Fibonacci of 124.83 and the 124.75 support.
In the alternative scenario, the price could find obstacle at the 38.2% Fibonacci, which overlaps with the 125.60 resistance. A jump above this hurdle could drive the pair to rest near the 20-simple moving average (SMA) currently at 125.70 in the 4-hour chart, ahead of the 23.6% Fibonacci of 126.05 and the 40-SMA.
Overall, EURJPY has been developing in a bearish correction following the pullback on the double top. A repetition of the upside tendency would come if the price surpasses the 126.80 resistance.
Forex Technical Analysis: EUR/USD, USD/JPY, GBP/USD
EUR/USD
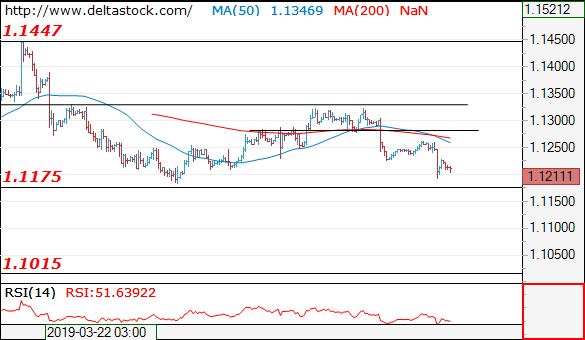
Current level - 1.1211
Yesterday's peak at 1.1260 has finalized the consolidation pattern pattern and the bias is bearish again, for a break through 1.1175 support, en route to 1.1010 target area.
| Resistance | Support | ||
| intraday | intraweek | intraday | intraweek |
| 1.1215 | 1.1330 | 1.1175 | 1.1175 |
| 1.1260 | 1.1450 | 1.1010 | 1.0860 |
USD/JPY
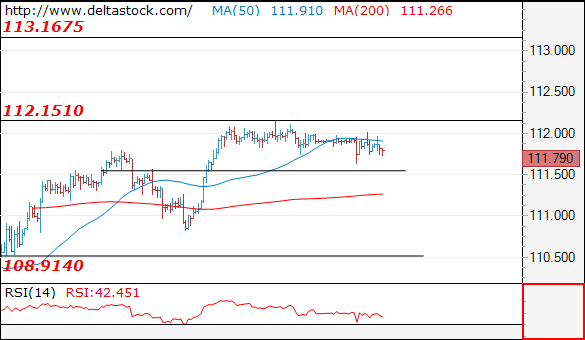
Current level - 111.79
Trading remains calm in the tight range between 111.50 and 112.15 and I continue to favor a break on the upside, for a rise towards 113.20 area.
| Resistance | Support | ||
| intraday | intraweek | intraday | intraweek |
| 112.15 | 113.20 | 111.50 | 108.90 |
| 113.20 | 114.50 | 110.50 | 107.40 |
GBP/USD
Current level - 1.2919
The pair finally broke through 1.2960 support area and the outlook is bearish, for a dip to 1.2810 zone. Crucial on the upside is 1.3015 high.
| Resistance | Support | ||
| intraday | intraweek | intraday | intraweek |
| 1.2960 | 1.3450 | 1.2900 | 1.2810 |
| 1.3015 | 1.3450 | 1.2810 | 1.2610 |