Sample Category Title
US Crude Oil Inventory Increased Four Times More than Expected
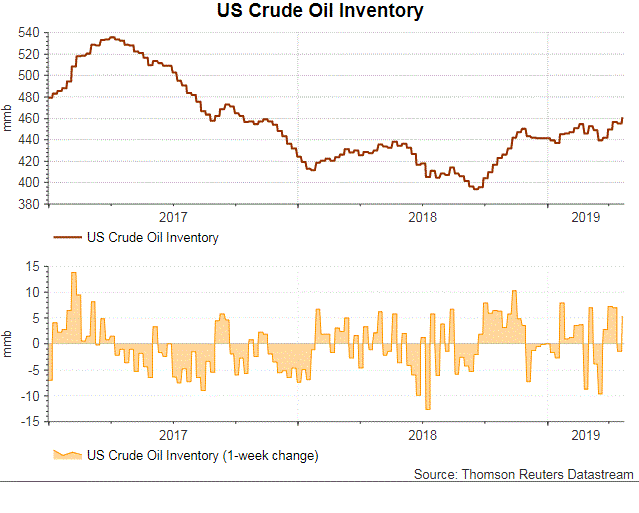
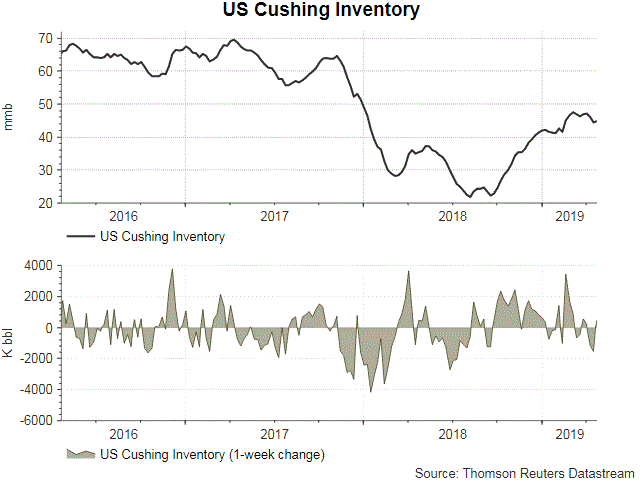
The report from the US Energy Information Administration (EIA) shows that total crude oil and petroleum products (ex. SPR) stocks surged +8.82 mmb to 1244.6 mmb in the week ended April 19. Crude oil inventory soared +5.48 mmb to 460.63 mmb (consensus: +1.26 mmb). Inventories rose in 4 out of 5 PADDs with PADD 2 (Midwest) seen a -2.42 mmb decrease. Meanwhile, Cushing stock added +0.46 mmb to 44.91 mmb. Utilization rate gained +2.4% to 90.1% while crude production gained +0.1M bpd to 12.2M bpd for the week. Crude oil imports increased +1.16M bpd to 7.15M bpd in the week.
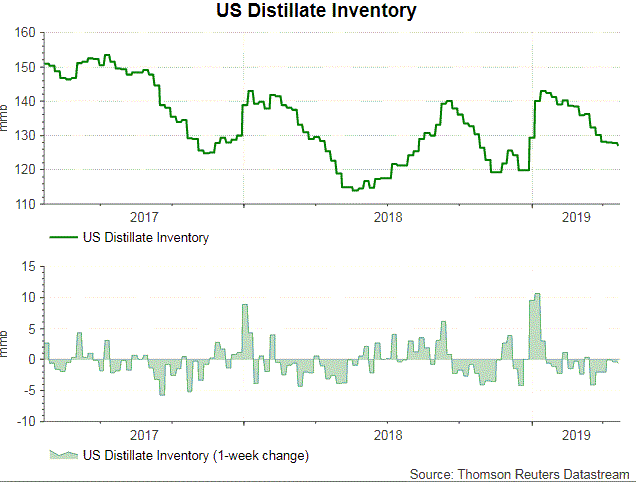
 Concerning refined oil product inventories, gasoline inventory declined -2.13 mmb to 225.83 mmb although demand slipped -0.12% to 9.41M bpd. The market had anticipated a -1.04 mmb drop in stockpile. Production slipped -1.14% to 9.971 bpd while imports fell -8.5% to 0.91M bpd during the week. Distillate inventory fell -0.66 mmb to 127.03 mmb. Demand slumped -13.21% to 3.8M bpd. The market had anticipated a -1.16 mmb decline in inventory. Imports soared +77.54% to 0.25M bpd while production gained +5 % to 5.06M bpd during the week.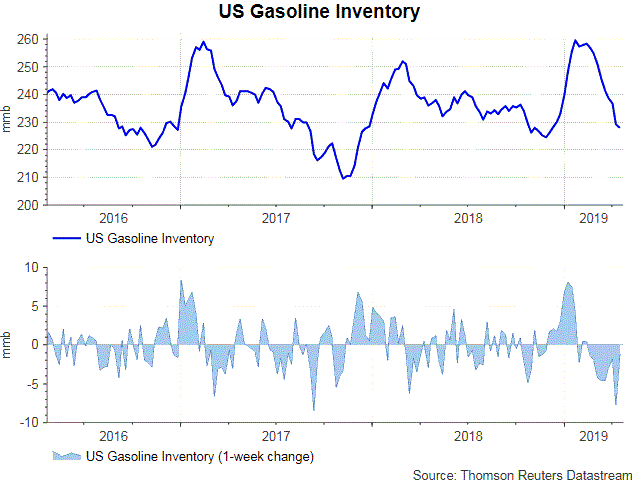
Released after market close on Wednesday, the industry- sponsored API estimated that crude oil inventory jumped -6.86 mmb during the week. For refined oil products, gasoline stockpile drew -1.82 mmb while distillate slipped -0.87 mmb.
Strive for Excellence by Strengthening These 5 Skills When Trading
To become a successful forex trader, you should develop five crucial skills. Do you know what skills all successful forex traders have in common? All of them have self-discipline, unlimited patience, and outstanding math skills. Moreover, they also have sharp critical thinking skills and positive attitude towards life.
If you want to take your career to the next level, you should also strive for excellence. If you wonder why these forex trading skills are so important for achieving ambitious goals, you can find a comprehensive explanation in this article.
Positive thinking
A trader’s job is just like a roller coaster. At one moment you get high profit and feel happy, and next second you suddenly lose your money. The life of a trader can be stressful but you have to find ways to stay positive.
Positive thinking skills will help you to cope with the stress, anxiety and depression. It will allow you to optimize work ethics and boost your performance.
Being a positive thinker, you will live with the understanding that tomorrow will bring you numerous opportunities and you will get back on the horse again. Here are a few tips on how to avoid negative thoughts:
- Avoid words like “no”, “nothing”, “can’t”, i.e. Substitute phrases like “I won’t lose” with phrases like “I will win”.
- Avoid reading negative news, comments, and reviews, if they relate to topics other than trading
- Stop complaining about your failures
- Celebrate small wins daily
- When facing a problem, try to find some positive aspects. For instance, if you crashed your car, enjoy the opportunity to take a walk more often and, finally, hit your fitness goals.
Critical thinking
Sharp critical thinking skills are crucially important for achieving success in forex trading. If you can’t quickly analyze the situation and understand where the trend is heading, you have no chances to avoid loss in the long-run.
However, if you need just a few minutes to look through a financial report and make the right decision about placing an entry order, it’s likely that you will build an outstanding career. Here are few tips on how to develop critical thinking:
- Find a new hobby to exercise your brain on a regular basis. You might learn how to play guitar, speak Chinese, cook croissants, play golf, or become involved in any other kind of activity you find exciting.
- Solve one problem at a time. If you currently lack critical thinking, don’t try to cope with multitasking. Prioritize your objectives and stop getting distracted by the least important tasks.
- Become a self-critic. Ask yourself numerous questions to define why you made mistakes in the past and to understand how to avoid them in the future. If you learn how to analyze your behavior and emotions, you will find it easier to complete the setup analysis and design an exit strategy.
Mathematical skills
If you want to become a successful forex trader, you should continuously develop your mathematical skills. Whether you are good at math or not, you should keep learning. As you know, every trader must be able to complete the following tasks:
- Read charts and predict trends
- Apply knowledge of probability theory and mathematical statistics
- Calculate risk and reward
If you find it challenging to perform one of these tasks, do not worry. You can always take some extra classes to get back on track. Also, you can ask your colleagues to teach you some useful math tricks, or find the ultimate math guide for traders online.
Self-discipline
Every professional forex trader has his own well-structured strategy, which boosts the effectiveness of the quick decisions. Disciplined traders find it easy to stick to the plan and to identify the best low-risk entries with the highest profit potential.
Those individuals, who lack self-discipline, start behaving irrationally when the situation in the marketplace is heating up. As a consequence, they experience heavy financial loss.
Keep in mind that self-discipline is an acquired skill, not an innate quality. For this reason, if you want to improve your discipline, complete the following actions:
- Identify your weaknesses and strengths as a forex trader.
- Build a clear strategy, which perfectly fits your style of trading.
- Put your plan into action and watch how it works. If there are some imperfections, you should fix them as soon as possible.
- Visualize potential rewards. Photo of a new car/house, which you dream about, will help you to stay goal-oriented and stick to the plan.
- Don’t get hung up on mistakes. Stay focused on your goals, and keep trading.
Patience
Impatient people can’t achieve success in trading forex, and this is a fact. So, if you want to build an outstanding career, you should learn how to be a patient person. Otherwise, you will not be able to wait for the perfect moment to close a deal.
The problem is that it’s simply impossible to transform your personality and become a patient person overnight. It will take you a lot of time to master this tricky skill. The more you will work as a trader, the more patient person you will become.
However, if you are afraid that your impatience might destroy your career in the very beginning, you should find a solution right now. Check the following ideas, which might help you to become a better forex trader:
Practice delaying gratification
Every time you want to order a second drink or buy a new tie, you should stop for a moment. Try to take a deep breath and ask yourself “Do I really need it?”.
Your task is to stop feeling rushed when you need to make a decision. If you learn how to stay calm and patient under any circumstances, you will not take trades that don’t fit all your entry criteria.
Use a checklist
If you are an extremely impatient person, you should create a checklist. You will use it every time before entering the trade. It will help you to decrease the number of bad decisions.
Meditate
Meditation is key to permanent patience and perseverance. If you learn meditation techniques, you will find it easy to focus on the present trends and make a better-informed decision.
In conclusion
In fact, it doesn’t really matter whether you currently have all the skills needed for trading or not. In today’s world, you have plenty of opportunities and resources to develop your talents and acquire professional knowledge. If you work hard, you will master any skill you want.
You should set the right priorities in life and clear goals when trading forex. It will help you to make sure that you are heading toward success.
Simplify Your Trading with Bollinger Bands
The history of trading bands, envelopes and channels is long and interesting.
In the years since the creation of Bollinger Bands in 1983, a number of adaptive bands were created. Chief among them were Keltner Channels, introduced by Chester Keltner in the 1960s. This technical indicator is similar to Bollinger Bands, though rather than using the standard deviation, Keltner Channels use the Average True Range (ATR) to set channel distance.
Created by John A. Bollinger, Bollinger Bands have undoubtedly stood the test of time and proven to be one of the more robust indicators available in the technical community today.
A recognised trader, multiple books, TV appearances, investments, numerous board memberships with Technical Associations and a research firm, certainly places Bollinger at the top of the pile in the trading arena.
Bollinger Band construction
The structure behind the trading bands is quite straightforward, visually depicted using three lines enveloping market data:
Bollinger Bands are envelopes plotted at a standard deviation level above and below a simple moving average (SMA), usually set to a period of 20 days (approximately the number of trading days in a month). Because the distance of the bands is based on standard deviation, they adjust to volatility swings in the underlying price.
The central line serves as a foundation to create its surrounding bands. Typically, the outer lines are positioned at two standard deviations.
According to Bollinger, approximately 90% of price action occurs between the two bands at 20 periods and two standard deviations.
Should traders feel the need to alter the calculation period and keep the containment percentage constant, however, increasing/decreasing the bandwidth is necessary.
Bandwidth measures the distance between the two bands using the following calculation: BW = (Upper BB – Lower BB) / Moving Average. Shortening the calculation period to 10 days, it is recommended to decrease the bandwidth from 2.0 to 1.9, whereas lengthening the calculation period to 50 days, increasing the bandwidth from 2.0 to 2.1 is suggested.
The many uses Bollinger Bands offer
Identify overbought/oversold markets:
When price action approaches the upper Bollinger Band, the indicator considers this a statistically ‘expensive’ market, or more commonly referred to in the technical world as ‘overbought’. The same can be said for a market testing the lower band, only this position defines a ‘cheap’ market, or ‘oversold’. The logic here comes from the upper and lower bands being positioned two standard deviations from the market average (the mean), which in the case of Bollinger Bands, as emphasised above, is a 20-day simple moving average.
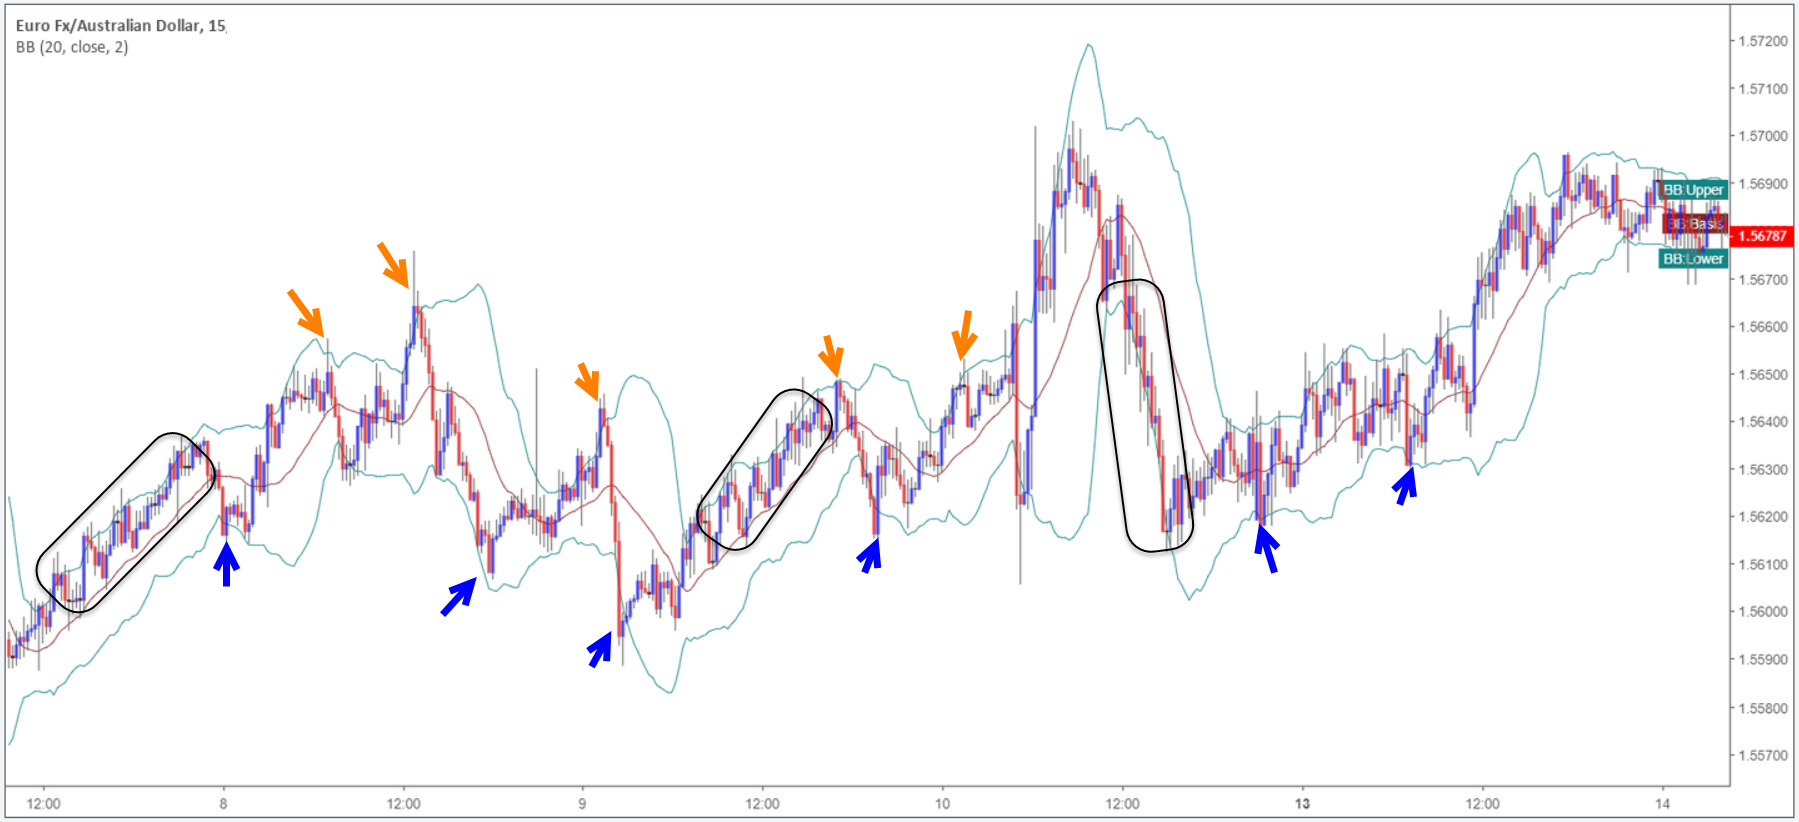
Although relatively straightforward, trading overbought/oversold points in isolation is challenging. Check out the EUR/AUD currency pair (M15 timeframe) posted below, you clearly see instances the upper and lower bands highlighted potential areas to trade (orange and blue arrows), though there are also times (black zones) the candlesticks hugged the upper and lower bands.
While the bands do underline overbought/oversold points, it does not always translate to a trading opportunity. The reason being is trending markets, or extended moves, forces price action to skirt the upper and lower bands.
Recognise market volatility:
Bollinger Bands provide traders a clear visual of market volatility.
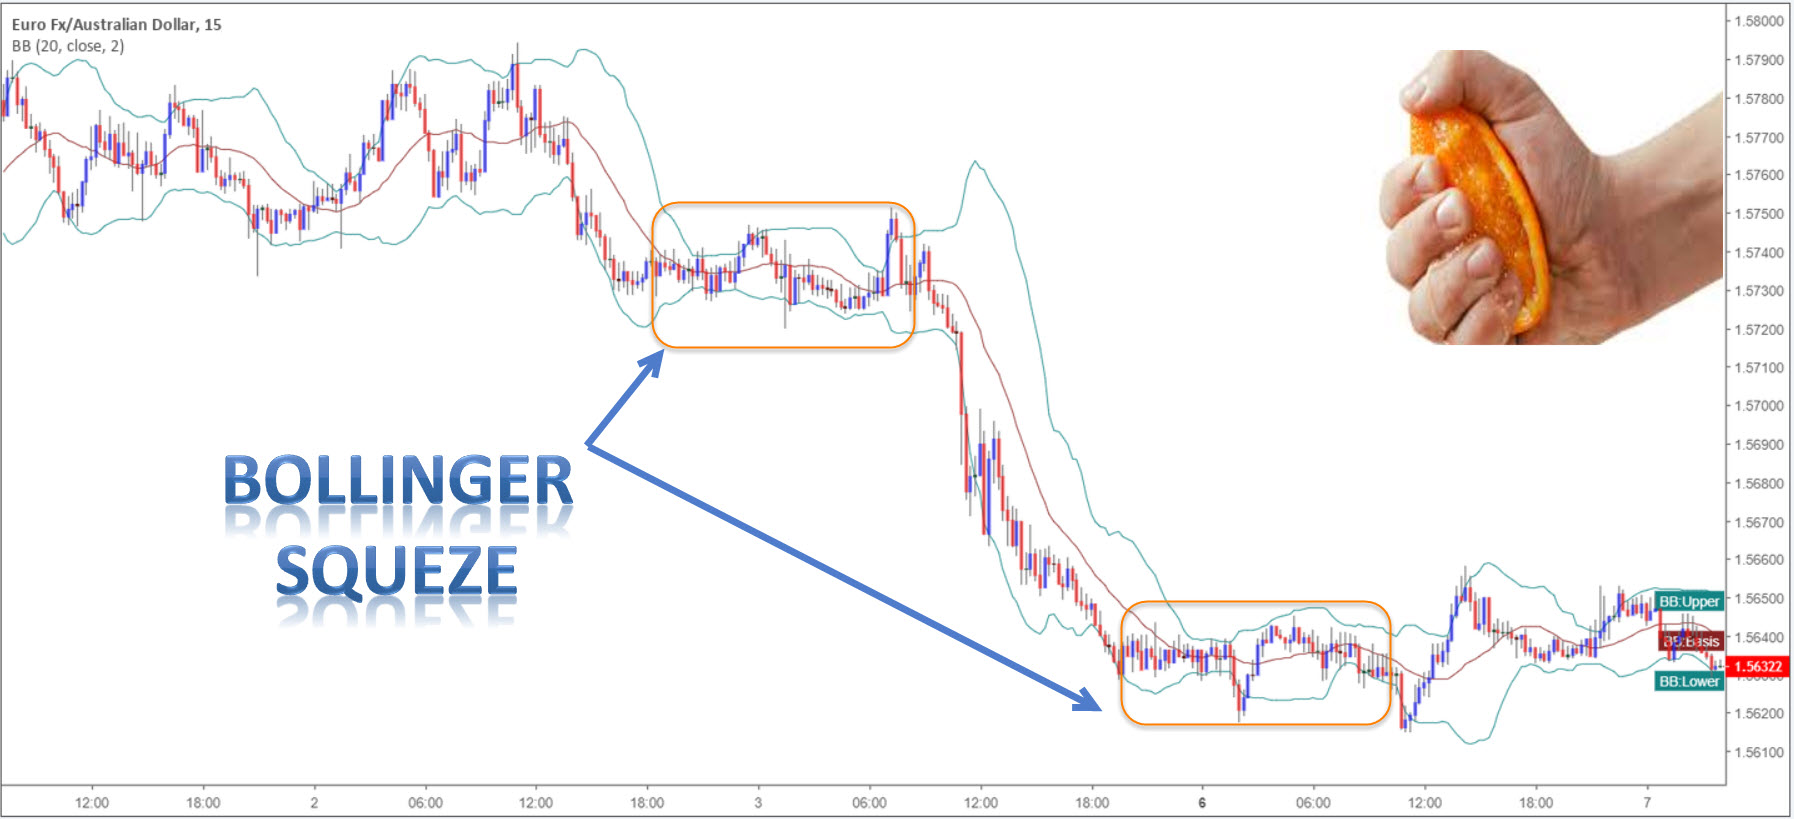
Sometimes referred to as ‘the squeeze’, Bollinger Bands expand on high volatility and contract, or squeeze, on low volatility. Unless you’re a scalper looking to pick off small moves, avoiding environments exhibiting low volatility is likely best, given the limited profit potential.
Below is a typical Bollinger squeeze:
Detect potential breakouts:
Due to the fact volatility generally expands following a period of contraction, identifying possible breakouts using Bollinger Bands is a popular strategy. Traders can visually recognize when an instrument is consolidating on low volatility as the upper and lower bands squeeze – the Bollinger squeeze as briefly featured above.
Not only useful for breakout traders, trend traders also find this technique particularly valuable to ascertain trend strength, offering opportunities to potentially jump aboard a trend or pyramid a current position.
The longer price action remains within its consolidation, the stronger the breakout tends to be.
Methods of confirming a breakout using Bollinger Bands come in many forms. The most obvious is a candle close beyond the outer limits. Some prefer to observe two candle closes, though this would get you in at a worse price and reduce risk/reward.
Not a standalone indicator
Although Bollinger Bands are a favourite among technical analysts, using it alongside additional tools as a basis for a complete trading strategy is highly likely going to improve your bottom line.
As is the case with most technical indicators, making informed trading decisions based on one indicator is a challenge. Some would say impossible. Bollinger considers convergences between Bollinger Bands and technical tools (technical analysis) to be a successful approach.
Implementing trend analysis, alongside the Bollinger Bands, has, for some traders, proven a fruitful method. If a market is trending north for an extended period of time, initiating short positions is a chancy play; even if price is touching the upper Bollinger band (overbought) or has broken the lower Bollinger Band (indicating a breakout to the downside may occur).
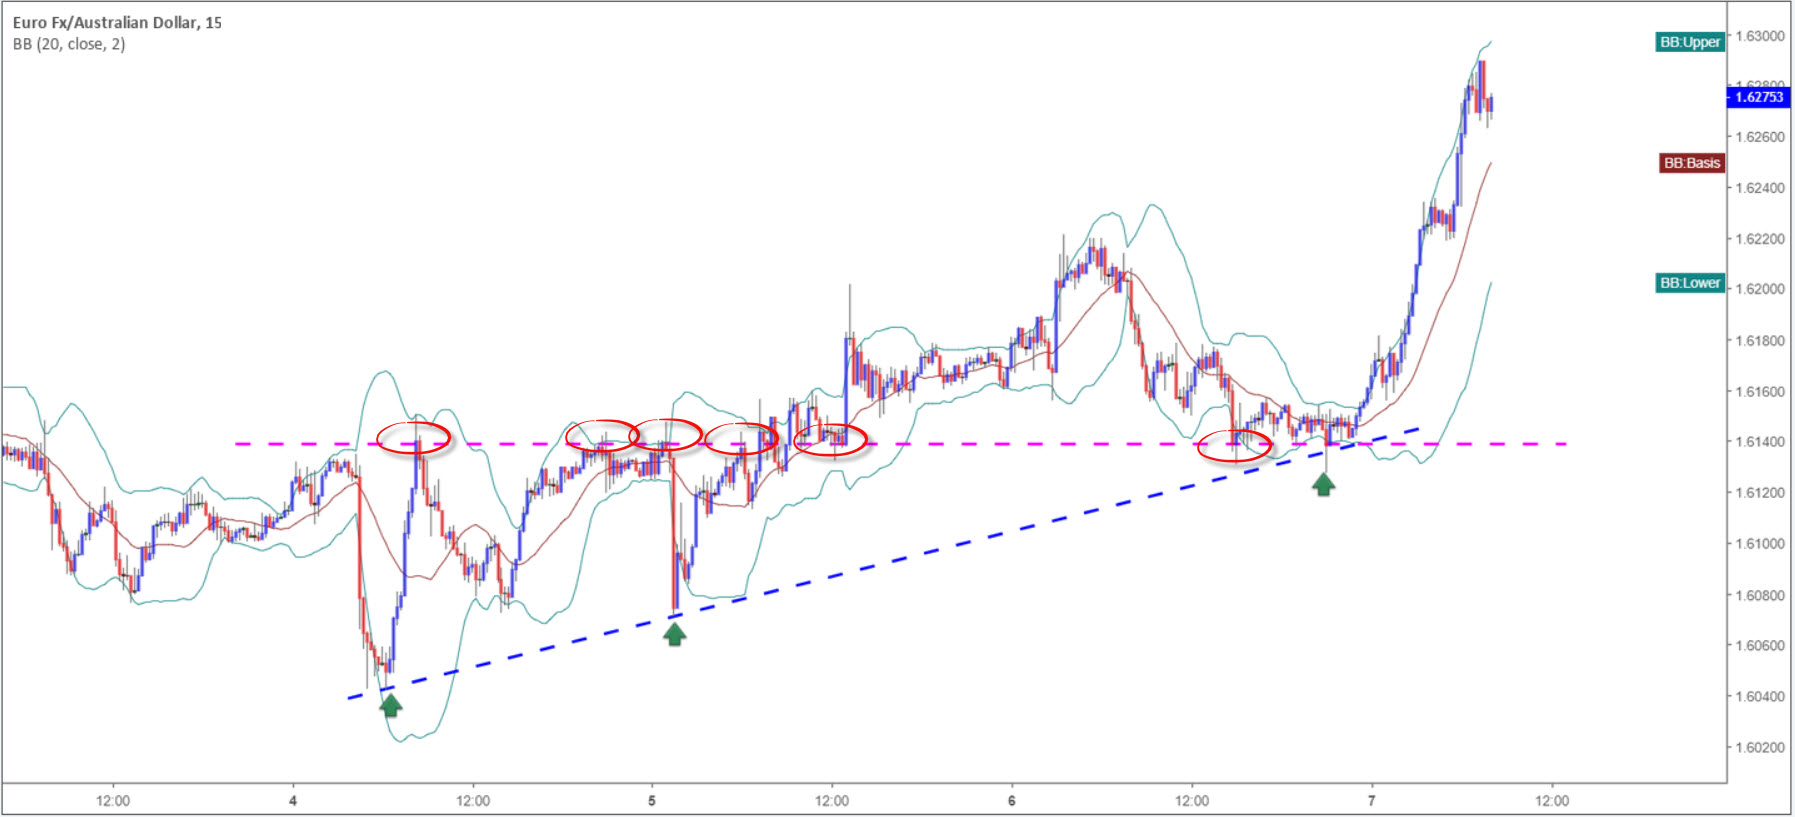
Below is a good example of a trending currency pair converging with a trend line support at the lower Bollinger Band during a time the indicator was emphasizing low market volatility. Also note, there was a candlestick close to the downside through the lower edge of the Bollinger Band marked with a blue arrow. Entering short on this candle close as a breakout setup, in this situation, meant selling within a trending market that was approaching a trend line support. As you can see, in conditions like this, trend analysis saved an unnecessary loss.
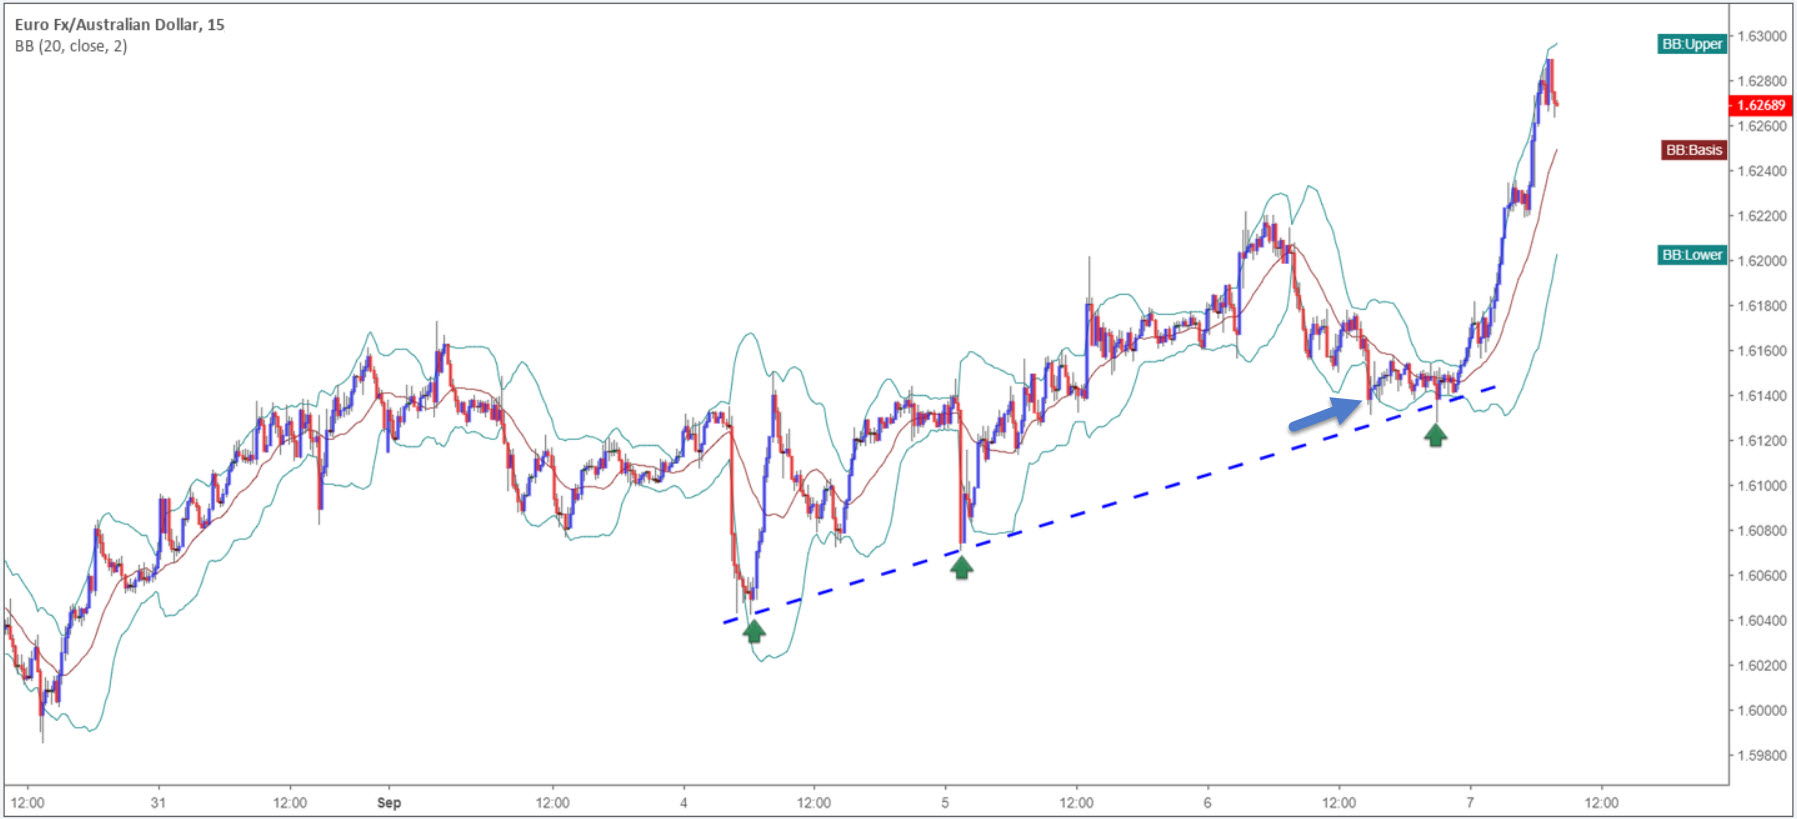
Support and resistance also plays a key part in determining the validity of a Bollinger Band signal. Looking at the same chart (posted below); there was a clear level of resistance-turned support in view. By selling the initial breakout (marked with a blue arrow on the chart above) it entailed shorting into not only the immediate trend, a clear trend line support but also a notable support level!
If a support level, a trend line support and trend direction is not enough to confirm a long bias from the lower Bollinger Band, maybe having a 61.8% Fibonacci support level fuse with the area may help:
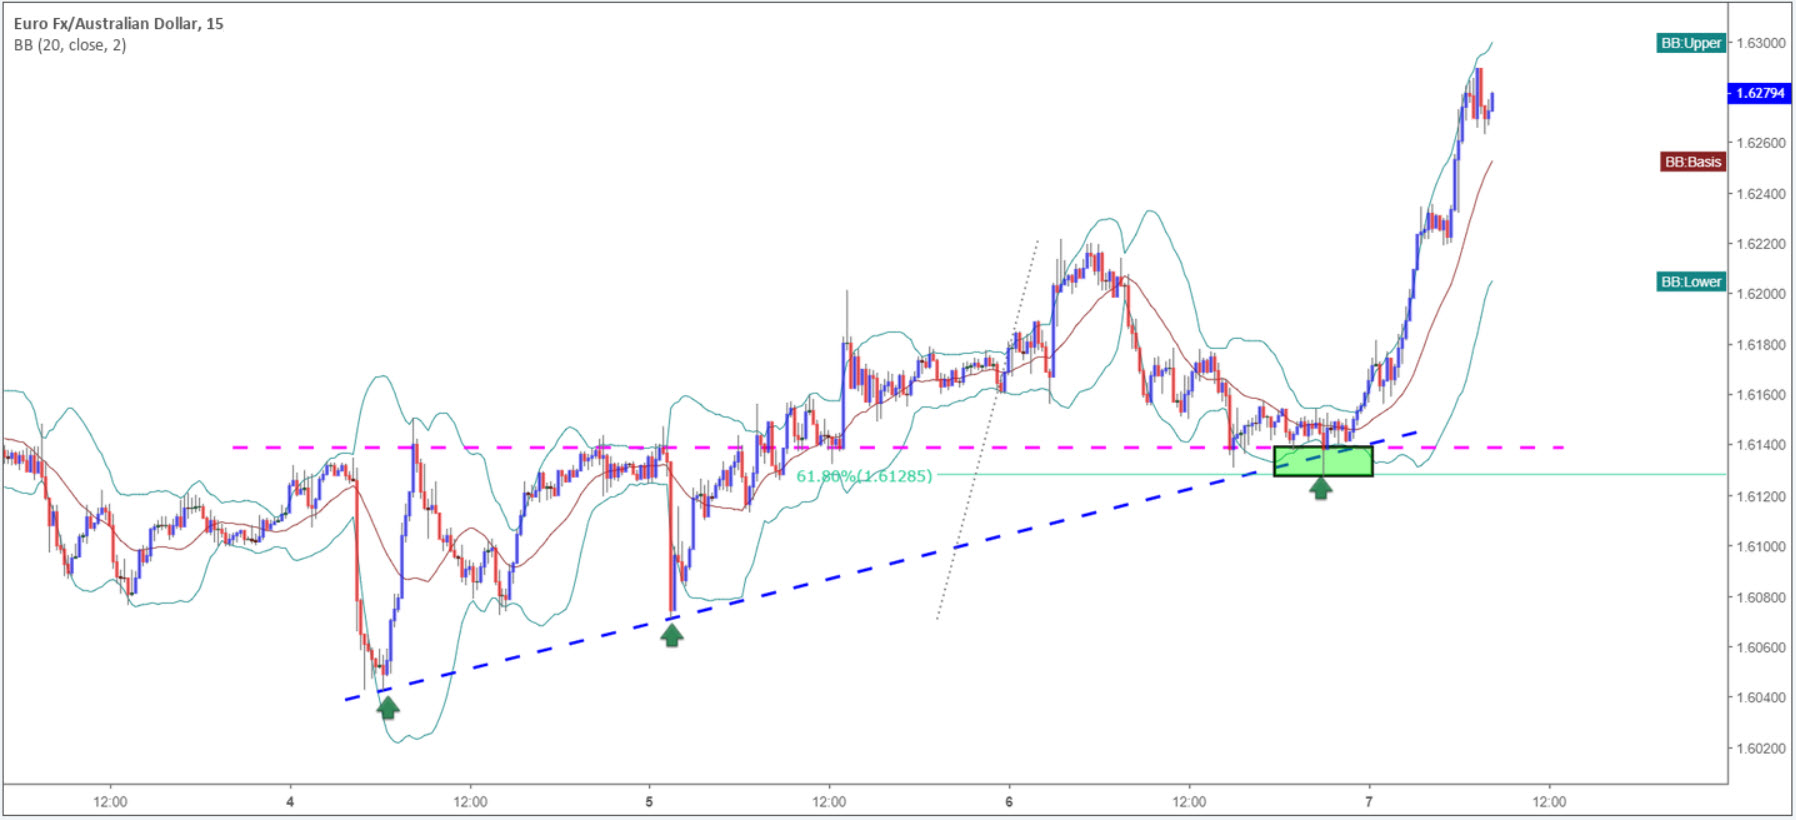
What you effectively did here was take the Bollinger bands as a foundation and shape a buy zone (marked in green) using multiple points of confluence. You also avoided a potential loss.
Of course, not all trades will deliver reversals quite as large as the one depicted above, though very often Bollinger bands supported with additional technical confirmation will produce a sizeable bounce.
Bottom line
Considering most trading platforms offer in excess of 100 indicators, using technical analysis as a mode to trade is difficult for a lot of newer traders. Using the Bollinger Bands as a footing can simplify your trading strategy. Besides the indicator classifying overbought and oversold points in the market, it recognises market volatility and detects possible breakouts. This – coupled with additional technical tools like the ones underlined above – makes it a formidable methodology.
Relative Strength Index: How to Trade Using the RSI Indicator
Nowadays, popular trading platforms offer in excess of 100 indicators. You could say you are almost spoilt for choice. The mammoth selection, however, tends to be detrimental, often leaving traders overwhelmed, particularly those in the earlier junctures of their journey.
Fortunately, a handful of indicators have stood the test of time.
Including, but certainly not limited to, the Slow Stochastic, The Moving Average Convergence & Divergence (MACD), Moving Averages and the Relative Strength Index (RSI) are well known among the technical community.
For the purpose of this piece, though, focus is drawn towards the RSI.
Getting to know the RSI indicator
Developed by J. Welles Wilder, and presented in his book New Concepts in Technical Trading Systems (1978), the RSI remains a prominent momentum oscillator – momentum is the rate of the rise or fall in price.
The RSI calculates momentum as a ratio of higher price closes over lower closes. For example, markets experiencing more upside momentum naturally have a higher RSI reading.
As is evident from the image below, the indicator is basic in form, oscillating between 0-100. In addition to this, an exponential moving average (EMA) is applied to its canvas, along with high and low levels marked at 70 and 30.

RSI settings
The RSI indicator’s default calculation is 14 periods, the suggested value by Wilder in his book. This means the indicator examines the closing price of 14 candles to create a reading on the timeframe being analysed.
Although 14 is the default, a number of settings are available which typically depends on the trading strategy employed:
- Short-term intraday traders (day trading) may favour lower settings using periods of 9-11.
- Medium-term swing traders tend to adopt the default setting of 14.
- Longer-term position traders normally prefer a higher period, ranging from 20-30.
In terms of the indicator’s calculation, today’s trading platforms are capable of performing the RSI calculation automatically, leaving traders free to focus on what’s important. For those who wish to understand the numbers behind the RSI, nevertheless, here’s a brief look at its calculation:
RSI = average gain in the period / loss in the period.
RSI = 100 – (100 / [1 + RS]).
Average gain is calculated as (previous average gain * (period – 1) + current gain) / period except for the first day which is just an SMA. The average loss is similarly calculated using losses.
The many uses of the RSI indicator
Overbought and Oversold:
Traditionally, an RSI value beyond 70 indicates overbought conditions, whereas an RSI value below 30 suggests oversold conditions.
These two terms are relatively self-explanatory. An overbought level describes consistent upward moves over a period of time and can alert traders to a potentially waning market, or weakening trend. The term oversold, nonetheless, defines consistent downward moves visible over a period of time, and thus reflects a possible trend reversal to the upside is in the offing.
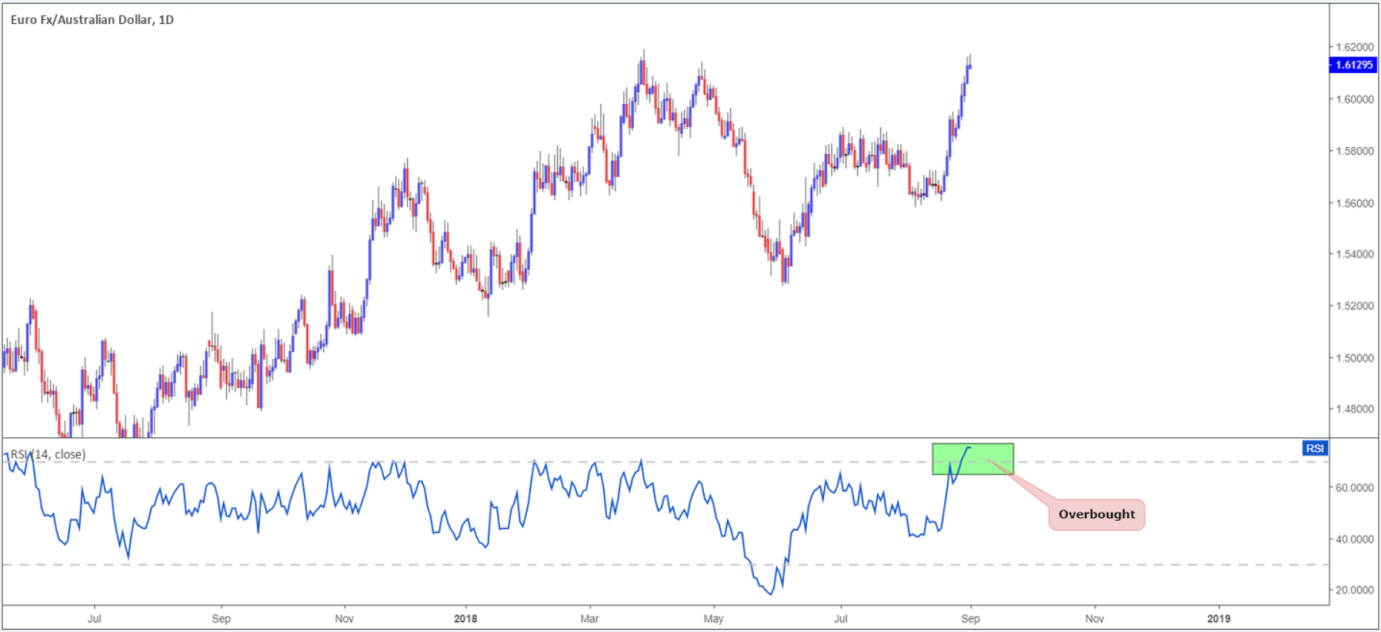
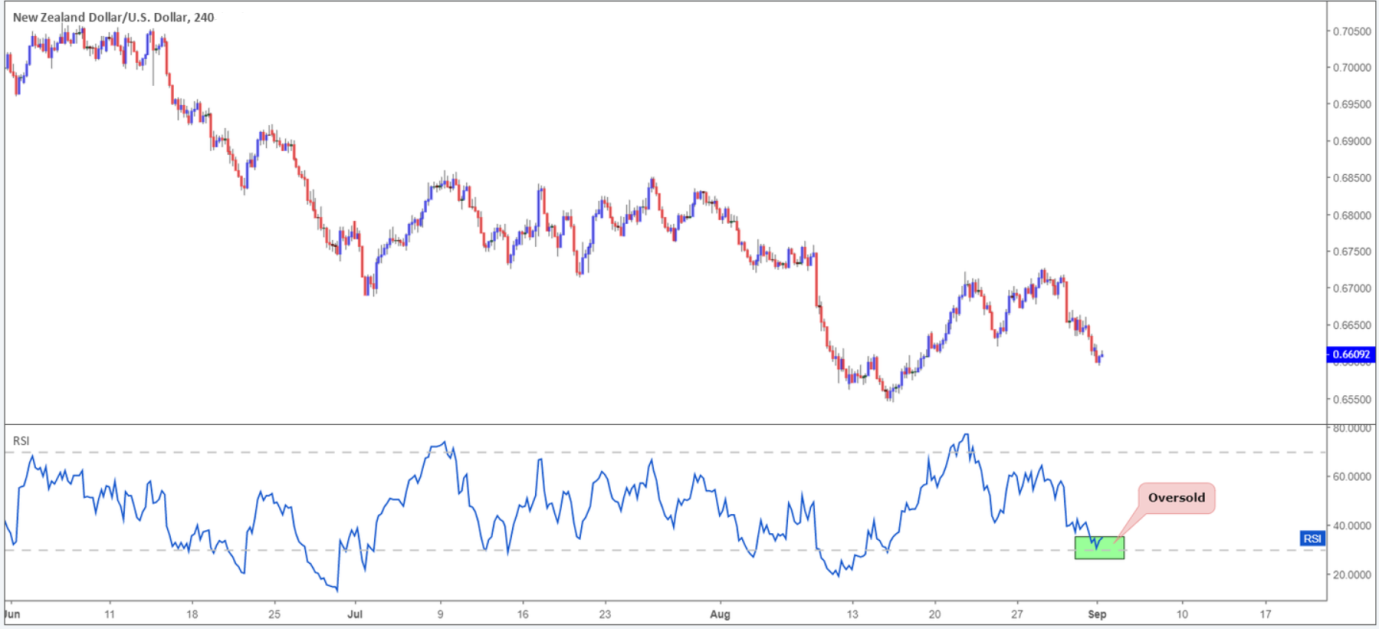
In addition to the above, traders also need to take into account the RSI can remain overbought or oversold for extended periods in trending environments. This is important to recognize as it can lead to numerous false signals. To help tackle this, some traders elect to use more extreme values in the range of 80-20 as an alternative to the traditional 70-30.
Divergence:
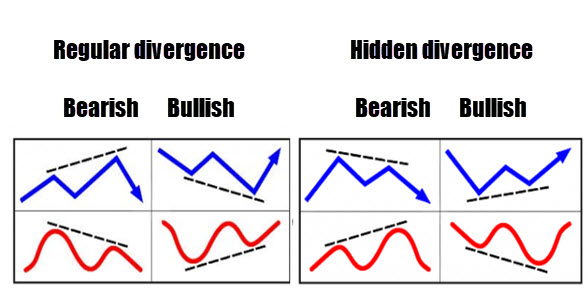
Divergence occurs when underlying price movement (the candlesticks) prints a fresh high/low that is not confirmed by the RSI. To the side are two examples of divergences seen regularly in the market (blue signifies price action and red represents RSI movement).
To help solidify the image, here is an example of regular bearish divergence on a trading chart – the opposite of this is simply a mirror version offering regular bullish divergence:
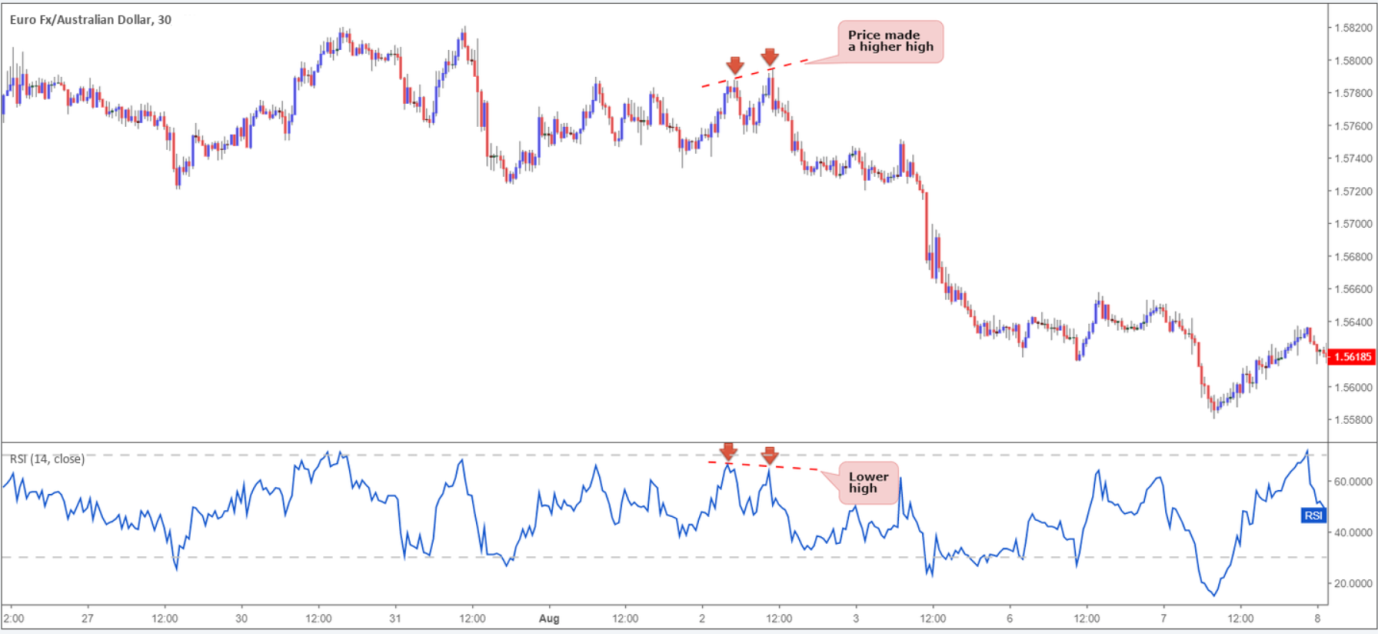
Divergence signals can offer an effective edge on the price chart, enabling traders to spot a potentially weakening/strengthening market.
Divergences are visible across all timeframes. For the best results, however, divergence observed on higher timeframes tends to suggest higher-probability signals.
RSI centre line:
The centre line of most oscillators is often overlooked. Found in the middle of the range at 50, this barrier is in place to discern early shifts in the underlying price trend. A push above 50 portends a strong immediate trend, whereas a move below 50 indicates an immediate bearish trend.
RSI patterns:
The RSI EMA has the ability to formulate patterns that precede price action. Trend lines, support and resistance, double bottoms and tops are just some of the technical formations to keep a watchful eye on.
By way of an example, the EUR/AUD M30 chart shown below was, at the time, compressed within a mild ascending channel pattern, with traders likely expecting its borders to hold.
The large bearish candle (point 1) shows strength to the downside, though price had yet to penetrate the channel support. Yet, on the RSI the indicator pierced beneath trend line support (point 2), providing an early signal price action may continue to press lower and eventually break the price chart’s channel support, which it did. In addition, there was also an opportunity to enter short at point 3 at the retest of the recently broken channel support (now acting resistance), given the RSI was also chalking up a similar retest play around the underside of its trend line support-turned resistance at point 4.
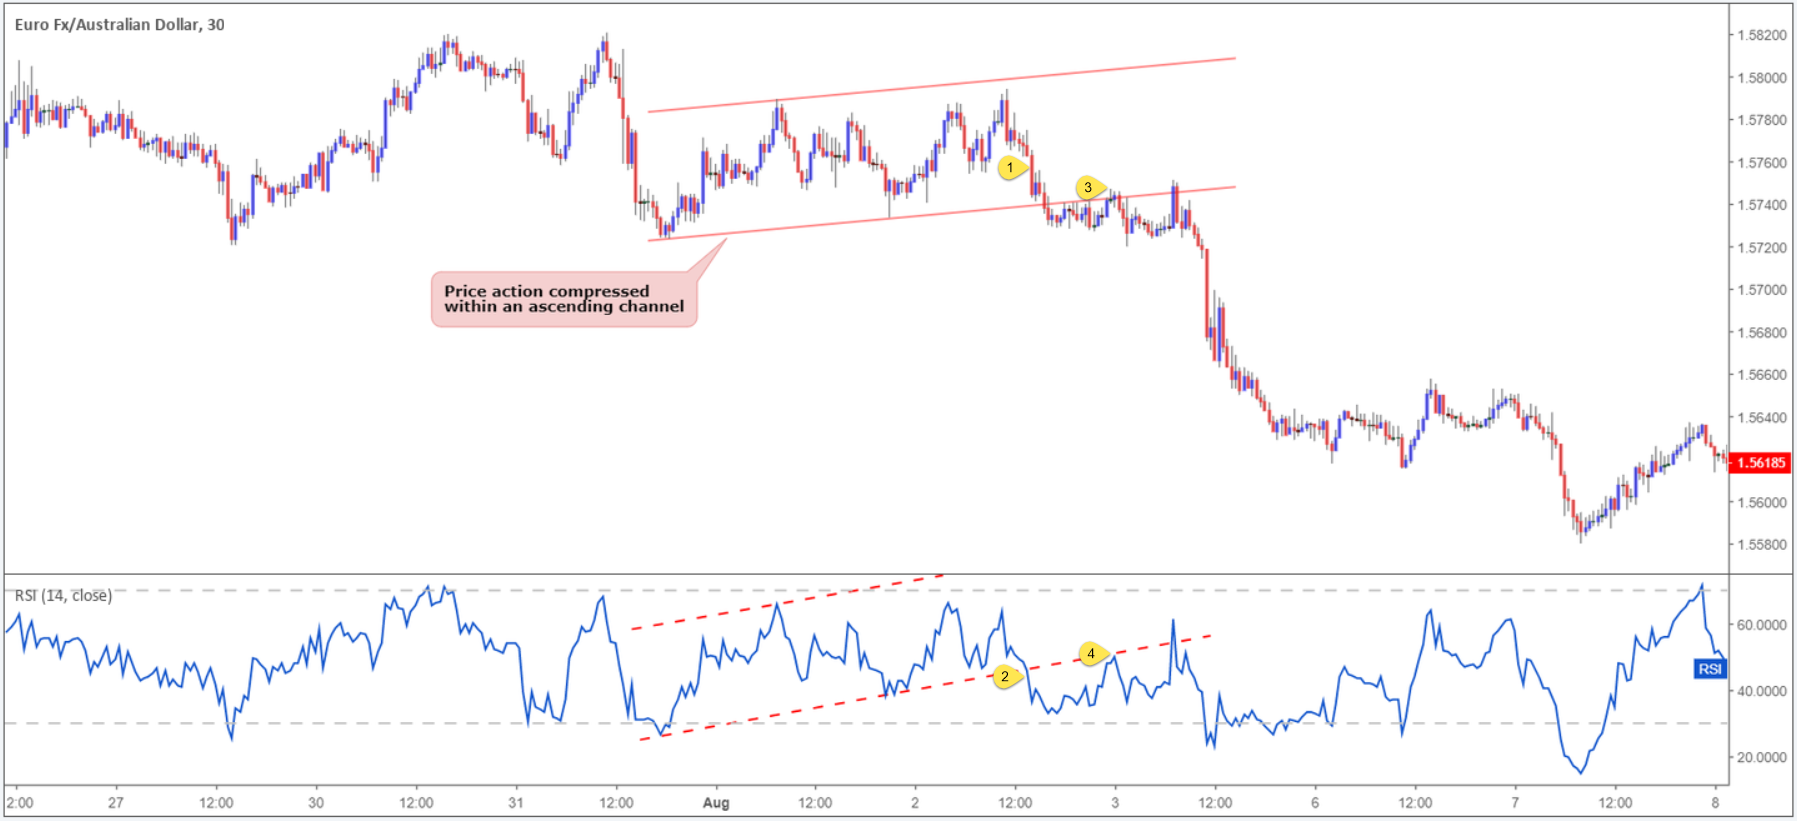
The chart, although reasonably simple, demonstrates the effectiveness of combining a price action pattern with the tools offered through the RSI indicator.
A final point to consider here is there is absolutely no need for the RSI pattern and chart pattern to emulate each other: In other words, the RSI pattern could form a trend line support, while price action trades from a demand zone.
Does the RSI show strength?
It shows a mathematical calculation of strength.
Although the RSI certainly has its place in a technician’s toolbox, trading it in isolation is challenging. If trading could be boiled down to following an indicator’s movement, there’d be a lot more traders that are successful.
Combining the power of the RSI along with additional technical tools such as supply and demand, support and resistance, trend lines or moving averages is certainly a viable option. There are a number of technical indicators that complement RSI movement.
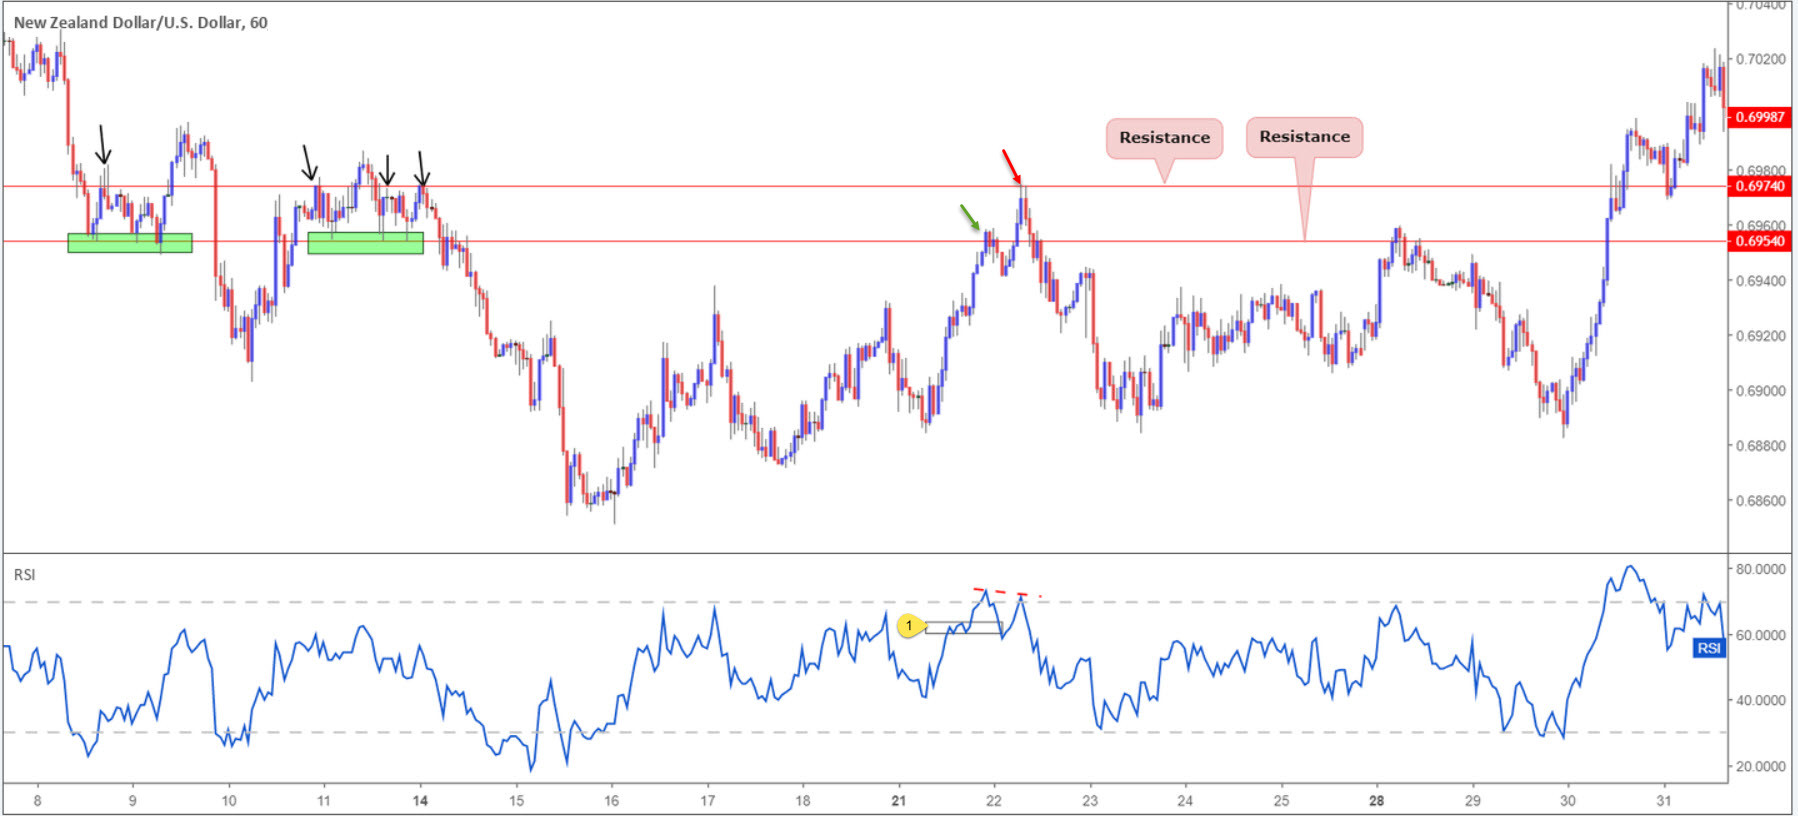
As an example, check out the NZD/USD M30 price chart depicted below. Two resistance levels stand out: 0.6974 and 0.6954 (red/green arrows). Both are of equal weighting as far as resistance levels go, though the upper barrier boasted additional confluence by way of an RSI bearish (regular) divergence signal within overbought territory. What’s more, the RSI engulfed a demand area (point 1) prior to forming the divergence signal. As a result of this, not only did we have a solid resistance level in play on the candles, the RSI exhibited a clear indication this market was likely weakening.
Final thoughts
The best form of technical analysis will always be what suits YOUR trading style and personality.
The RSI momentum indicator, as demonstrated in this article, has a multitude of uses which could benefit your trading.
CHF and JPY firmer as German 10-yr yield turns negative, US 10-yr yield dives
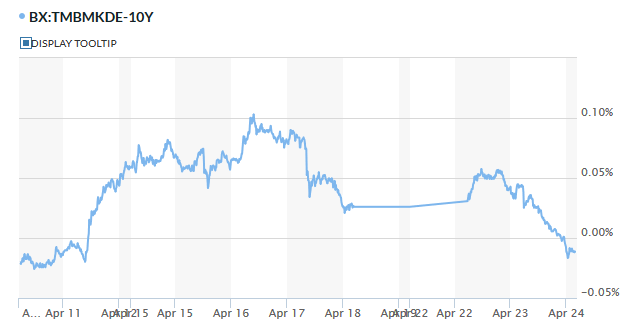
Swiss Franc and Yen are both strong today, helped by decline in treasury yields. At the time of writing, German 10-year bund yield is down -0.0555 at -0.011. It turned negative for the first time since April 12.
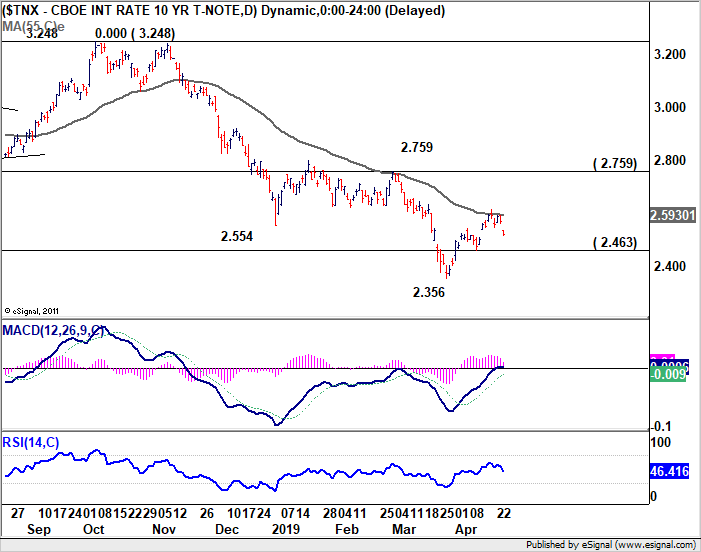
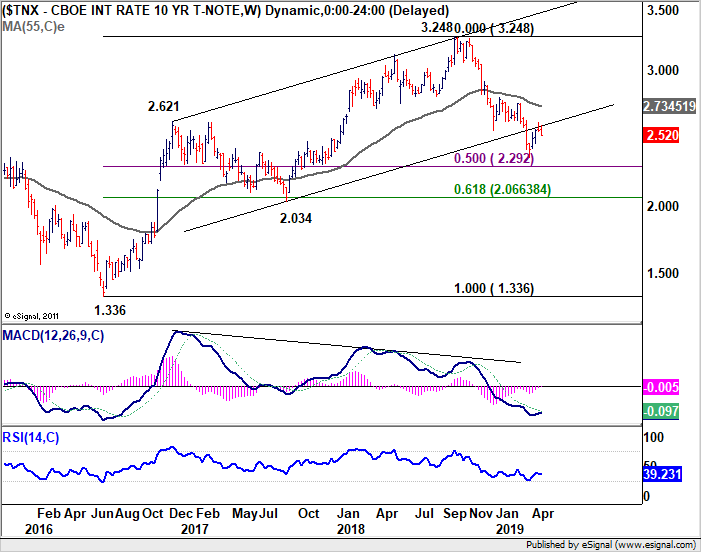
US 10-yer yield is down -0.050 at 2.520. More importantly, today's sharp fall suggests that TNX is rejected by 55 day EMA, as well as long term channel support turned resistance. Focus would be back on 2.463 support for the near term. Strong support from this level will retain near term bullish, for at least another rebound to 2.759 resistance. However, decisive break of 2.463 will likely resume larger decline from 3.248 through 2.356 low.
BoC Poloz press conference live stream
https://www.youtube.com/watch?v=Atz0chsUmOs
Loonie Falls Further after BoC Lowered Tone/Forecasts
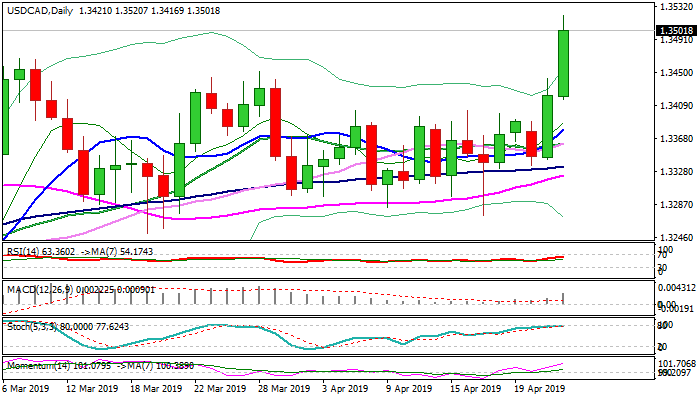
The pair surged above 1.35 barrier, hitting levels last traded in early January, after Bank of Canada kept interest rates unchanged at 1.75% but changed rhetoric about need for future rate hikes and lowered its growth forecast for 2019.
Fresh bullish acceleration extends rally of the previous day and broke above key barriers at 1.3450/67 (28 / 7 Mar highs, as well as psychological 1.35 resistance, with daily close above these levels needed to confirm strong bullish signals.
Bulls approached barrier at 1.3524 (Fibo 76.4% of 1.3664/1.3068 fall), break of which would open way towards 2018 high at 1.3664 (31 Dec), as strong bullish setup of daily / weekly studies supports scenario.
Overbought conditions suggest price adjustments, which could be described as positioning for further advance.
Broken key barriers now reverted to solid supports which should ideally contain corrective actions.
Res: 1.3524; 1.3566; 1.3600; 1.3664
Sup: 1.3467; 1.3450; 1.3437; 1.3400
Bank of Canada Rate Hold Comes with a Growth Downgrade
Matching expectations, the Bank of Canada held its overnight interest rate unchanged at 1.75% this morning. The tone of accompanying communication tilted dovish, perhaps more than markets anticipated given the immediate further decline in yields and the dollar. Compared with the last statement, the Bank is now focused on "the appropriate degree of monetary policy accommodation as new data arrive", with reference to potential future rate increases gone.
Today's decision came with a new Monetary Policy Report (MPR). The Bank of Canada again downgraded their growth forecast, looking for 1.2% growth this year (was: 1.7%). Downgrades to growth were fairly widespread, offset by a build-up of inventories. Much of the downgrade appears to be driven by their 2019Q1 and Q2 expectations of 0.3% and 1.3% respectively, reflecting curtailment impacts and volatile data to date. The Bank's 2020 forecast was unchanged, at 2.1%, and the newly public outlook for 2021 sees growth at 2.0%.
The April MPR also brings revisions to the Bank's core assumptions. Potential (long-term trend) growth was left unchanged at 1.9%, although the nearer-term was marked down a tick. Productivity is expected to contribute less to growth, with labour picking up the slack.
A re-assessed view of the 'neutral' policy rate came with a downgrade – the Bank now sees the range consistent with the economy operating at its long-run potential as 2.25% to 3.25%, a reduction of 0.25p.p. from its previous view. This suggests that the current stance of monetary policy is a bit tighter than previously thought.
On the outlook for inflation, the Bank sees little near-term pressure as a negative output gap plays off against the positive lifts from the softer loonie and carbon levies.
The MPR captured their views on the balance of risks. On the negative side are global trade tensions, a tightening of global financial conditions, weaker growth in advanced economies, and more Canadian housing weakness. Conversely, the Bank sees the possibility of upside growth surprises from a positive resolution of trade disputes, stronger U.S. growth, and the possibility of stronger Canadian household spending and debt growth (which would in turn increase longer-term downside risks).
Key Implications
Patience is a virtue. The core message today is one of caution, with the Bank of Canada removing any reference to future rate increases in light of soft near-term growth and still elevated risks.
The drivers of this increased caution all make sense. The Bank's near-term growth outlook sees sub-trend growth for the first half of the year, a reasonable assumption in light of the fact that the data has serially disappointed for three straight quarters. Similarly, the Bank's downgrade of where it sees the policy rate eventually landing speaks to caution – stimulus can be crudely measured by the difference between the current rate and this range, meaning that the current level is a bit less supportive of growth than previously thought. The Bank of Canada also addressed the limitations around estimations of the neutral rate in their MPR today, acknowledging the high uncertainty around this unobserved variable as we discussed in a recent note.
With all these downgrades, is Governor Poloz signaling a rate cut? No, or at least, not yet. While the risks may skew in that direction, the Bank's view remains that the current growth soft patch is temporary, with 2020 growth left unchanged at an above-trend 2.1%, and with better details (upgrades to consumption and housing). The bar for easing is probably a bit higher given fairly soft near-term growth expectations, so expect to sit at the current 1.75% overnight rate for some time to come.
Time for US GDP Growth and Core PCE Inflation
The US reports preliminary GDP growth figures for the first quarter of 2019 on Friday at 1230 GMT, while at the same time on Monday, the March core Personal Consumption Expenditures (PCE) index, will move front and center to add further clues on whether an accommodative monetary policy is indeed necessary in the year ahead. While analysts predict a slower economic expansion and a softer inflation, improving data out of the country have given a good feeling for the US economy lately. Personal income and personal consumption accompanying the inflation reading may turn views rosier as well.
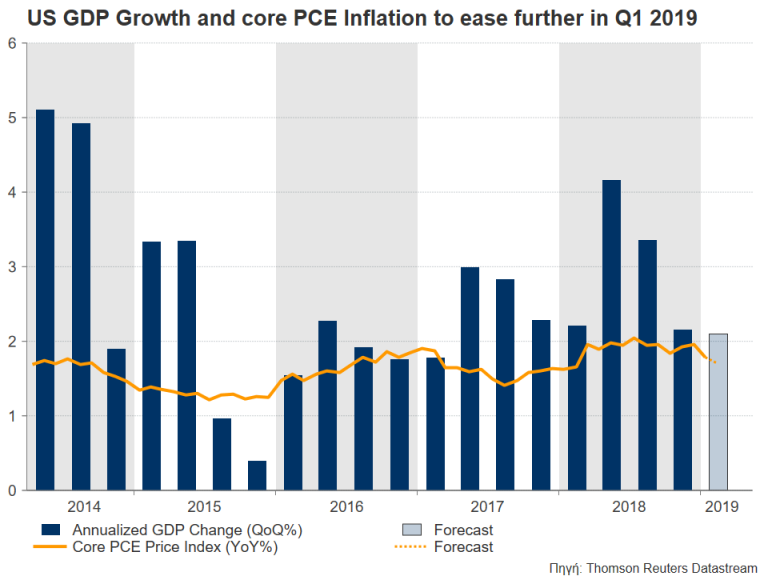
After a surprising downward revision to GDP growth in the final quarter of 2018 that squeezed the annualized measure from 2.6% q/q to 2.2%, forecasts are now for a slimmer expansion of 2.1% in the first three months of 2019 – the lowest growth logged in since Q2 2017. Indeed, the new year found the government shut down until late January as Democrats and Republicans were fighting over the funding of the Mexican border wall. Investors had also a much darker vision about the future of the US-Sino trade relations than they currently have, while the impact of the massive Trump tax cuts that filled businesses’ and consumers’ pockets with more money from 2017 onwards had started to fade out. Besides, with Wall Street having suffered its worst annual performance in a decade, the sentiment coming into this year apparently could not be pleasing.
The core PCE index for the month of March that excludes volatile items such as food and energy is expected to be another weak spot on Monday, and an extra weight for the dollar, as projections stand for further inflationary easing. Particularly, the inflation gauge which the Fed uses to adjust monetary policy is said to have slipped to 1.7% y/y in March from 1.8% in February and down from the Fed’s 2.0% ideal level achieved in December.
The thinking that follows is that if the core PCE index extends slowdown below the 2.0% target, the Fed is likely to keep its word over stable interest rates in 2019 or even chose a rate cut if GDP growth continues to melt as well. However, with retail sales surging by the most in more than a year in March after a weak end to 2018, the trade deficit narrowing in the first quarter, and wage growth still fluctuating at decade highs, the outcome may appear more promising than previously thought, putting the Fed’s dovish stance into question. Personal consumption and personal income data are likely to embrace the idea if the figures pick up steam in line with forecasts, towards 0.4% m/m and 0.6% respectively.
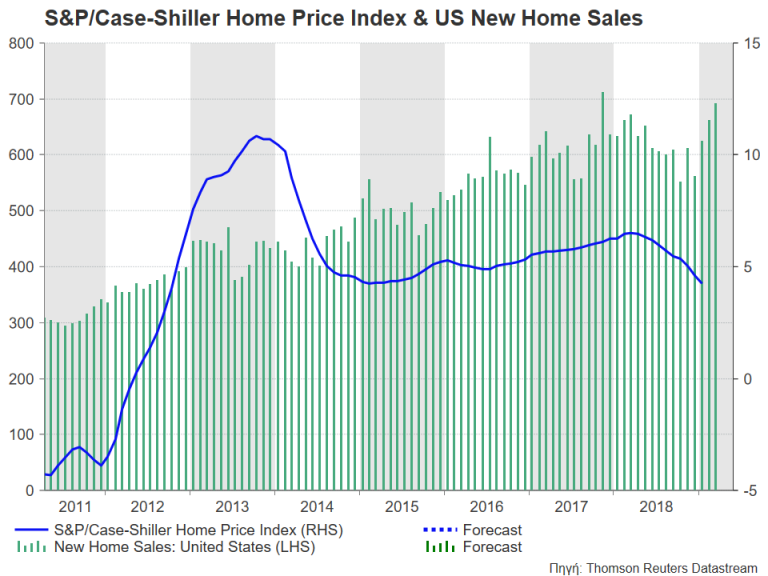
Yet, the US property market remains a puzzle and should be closely watched as house prices extended their almost one-year downtrend to fresh lows in February although lower mortgage rates raised demand for home sales. US-Sino trade relations and economic developments in China and Europe are additional key issues the central bank should consider before deciding on monetary policy in the coming months.
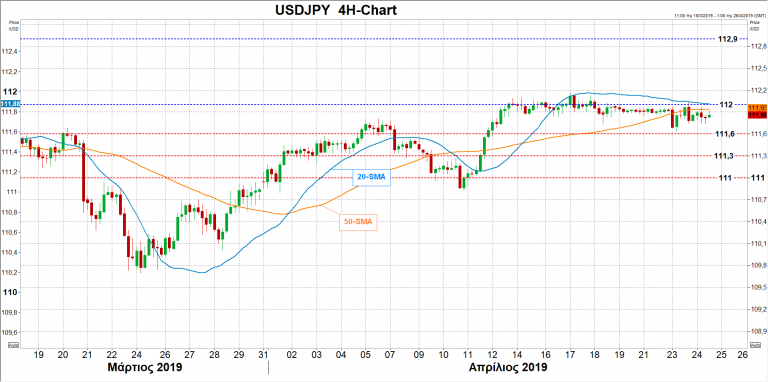
In FX markets, the dollar is outperforming against a basket of six currencies due to the slack in the euro and the pound. However, against the safe-haven yen, the greenback is facing a strong barrier between 112-112.30 that could potentially collapse if preliminary GDP growth or/and inflation figures manage to significantly surprise analysts to the upside, hinting a less dovish Fed policy meeting next week. The pair could rise as high as 112.90.
Otherwise, should the data disappoint, policymakers may retain a cautious tone until further notice. In such a case, USDJPY could move immediately towards 111.60 and then down to the 111.30-111 area.
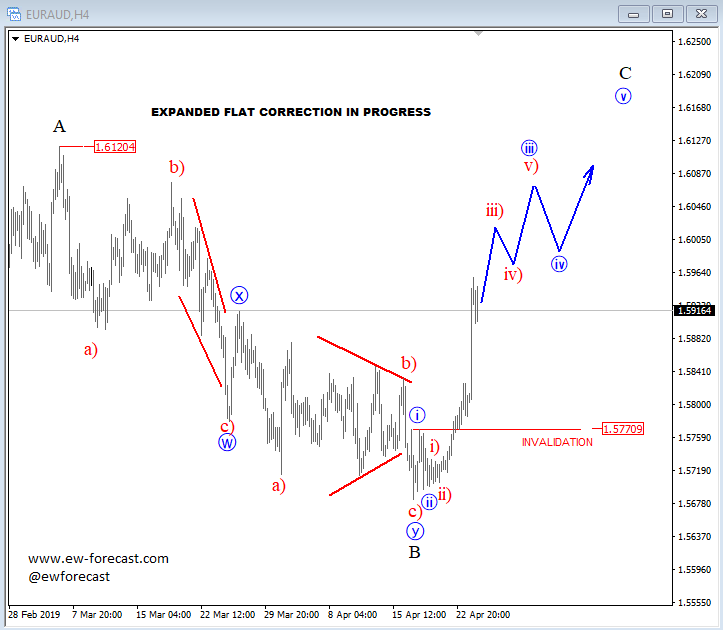
Elliott Wave Update: EURAUD Aiming Towards 1.61 – 1.62
AUD may stay weak, if we consider a bullish continuation on EURAUD for wave C within a big expanded flat correction. That said, seems like EURAUD is trading in an impulsive five-wave rise back to a previous wave A swing high to complete a big expanded flat correction, so more upside in view towards 1.61 – 1.62 area, while it's above 1.5770 invalidation level.
EURAUD, 4h