Sample Category Title
Crude Oil: Oil Reverses Its Gains In The Asian Session
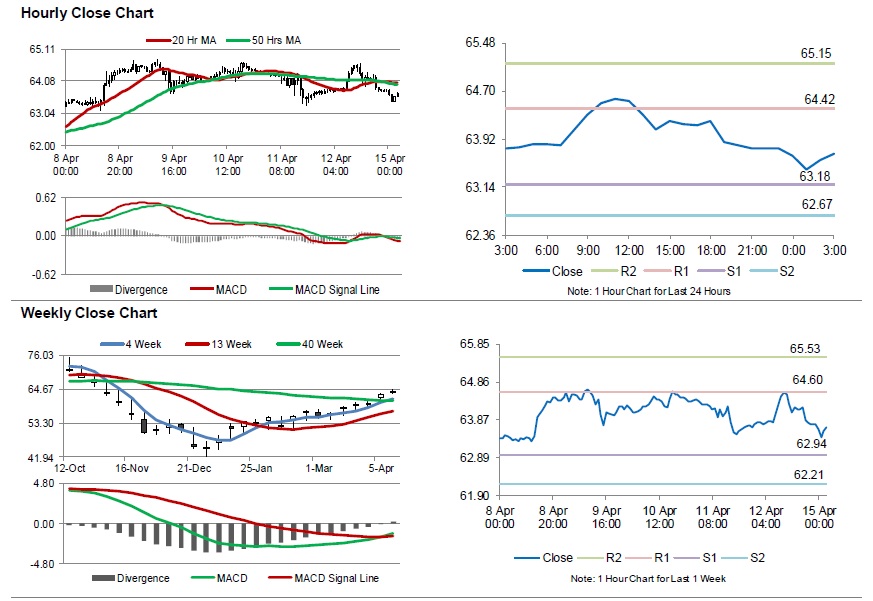
For the 24 hours to 23:00 GMT, Crude Oil rose 0.20% against the USD and closed at USD63.81 per barrel on Friday, as mounting turmoil in Libya and OPEC led production cuts tightened oil supply in the global market. Meanwhile, fresh figures from Baker Hughes disclosed that the number of active oil rigs rose by 2 to 833 in the week ended 12 April.
In the Asian session, at GMT0300, the pair is trading at 63.68, with oil trading 0.20% lower against the USD from Friday’s close.
The pair is expected to find support at 63.18, and a fall through could take it to the next support level of 62.67. The pair is expected to find its first resistance at 64.42, and a rise through could take it to the next resistance level of 65.15.
Crude oil is trading below its 20 Hr and 50 Hr moving averages.
GBP/USD And USD/CAD Facing Significant Resistance
GBP/USD recently recovered, but struggled to clear the 1.3125-1.3130 resistance area. USD/CAD declined recently and it may continue to move down towards the 1.3285 support.
Important Takeaways for GBP/USD and USD/CAD
- The British Pound faced a strong resistance on a few occasions near the 1.3130 level.
- There is a major bullish trend line formed with support at 1.3080 on the hourly chart of GBP/USD.
- USD/CAD declined recently and broke the key support near the 1.3350 level.
- The pair broke a key bullish trend line with support at 1.3355 on the hourly chart.
GBP/USD Technical Analysis
The British Pound declined heavily this past week and traded below the 1.3100 support area against the US Dollar. The GBP/USD pair even broke the 1.3050 support and traded towards the 1.3000 support area.
A swing low was formed near 1.3000 on FXOpen and later the pair started a decent recovery. There was a break above the 1.3080 resistance and the 50 hourly simple moving average. The pair even moved above the 1.3100 level, but it faced a strong resistance near the 1.3130 level.
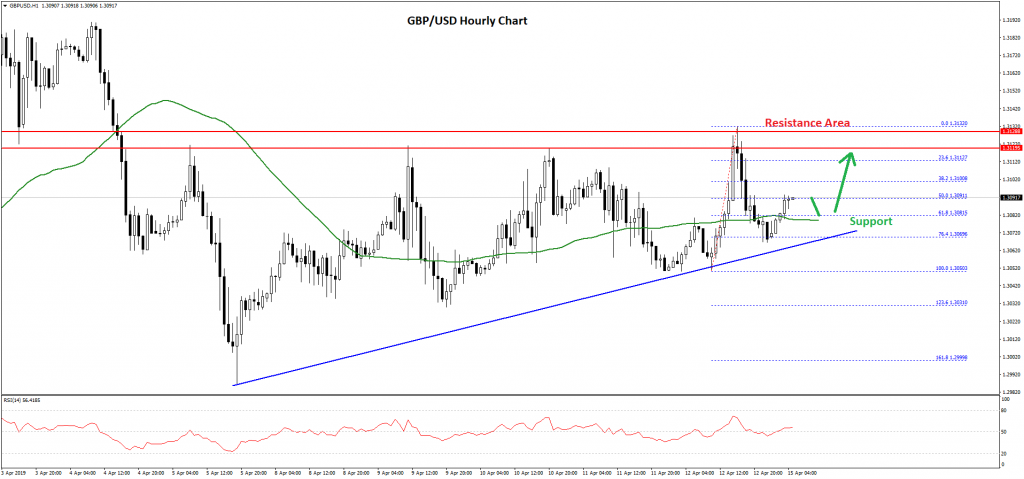
There were a couple of attempts to clear the 1.3130 resistance area, but buyers failed to gain traction. The last swing high was formed at 1.3132 before the pair started a fresh decline. It broke the 50% Fib retracement level of the last wave from the 1.3050 low to 1.3132 high.
The pair even broke the 1.3080 level before buyers appeared near 1.3068 and the 76.4% Fib retracement level of the last wave from the 1.3050 low to 1.3132 high.
There is also a major bullish trend line formed with support at 1.3080 on the hourly chart of GBP/USD. The pair is slowly moving higher and it is currently trading above 1.3080 and the 50 hourly simple moving average.
It seems like the pair might continue to rise towards the 1.3130 resistance area. If this time bulls gain pace above 1.3130, GBP/USD might climb further higher towards 1.3150 or 1.3180.
On the downside, an immediate support is at 1.3080, followed by the 1.3070 support. Any further losses may push the pair below the 1.3050 support level in the near term.
USD/CAD Technical Analysis
The US Dollar remained in a positive zone until it struggled to clear the 1.3395-1.3400 resistance area against the Canadian Dollar. The USD/CAD pair likely formed a double top pattern near the 1.3395-1.3400 resistance area and recently declined lower.
There was a sharp decline below the 1.3360 support and the 50 hourly simple moving average. Besides, the pair broke a key bullish trend line with support at 1.3355 on the hourly chart.
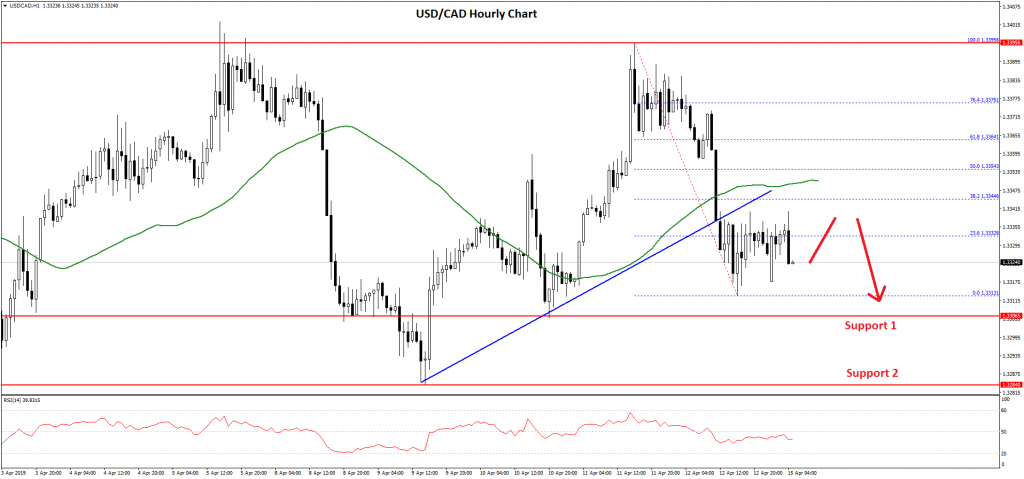
It opened the doors for more losses and the pair broke the 1.3320 support. A swing low was formed at 1.3313 and later the pair started a decent rebound. It recovered above the 23.6% Fib retracement level of the last decline from the 1.3395 high to 1.3313 low.
However, there is a strong resistance formed near the 1.3340 level. Moreover, the previous support at 1.3350 and the 50 hourly simple moving average are likely to act as solid hurdles for buyers.
The main resistance is at 1.3355 and the 50% Fib retracement level of the last decline from the 1.3395 high to 1.3313 low. If the pair fails to move above the 1.3350 resistance zone, it is likely to extend losses below the 1.3310 and 1.3300 support levels.
USD/JPY Daily Outlook
Daily Pivots: (S1) 111.68; (P) 111.88; (R1) 112.22; More...
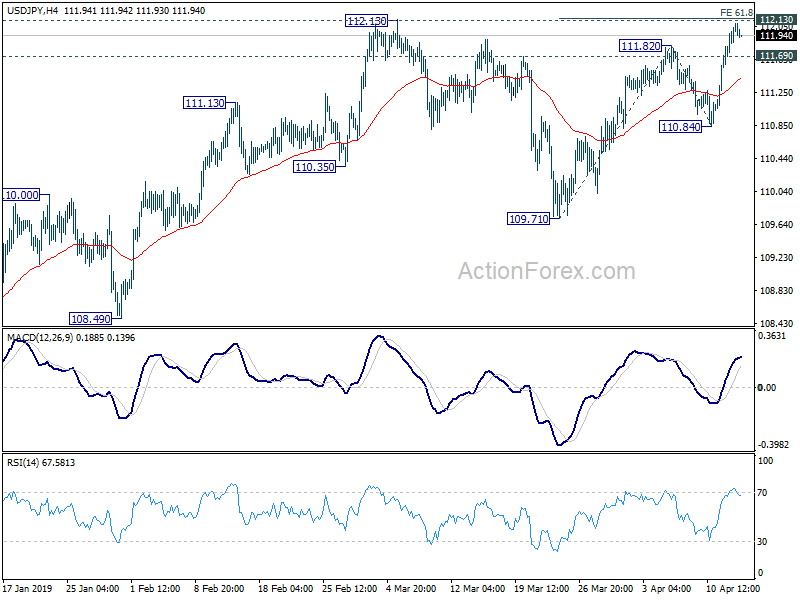
Intraday bias in USD/JPY remains on the upside with focus on 112.13 key resistance. Decisive break there will resume whole rise from 104.69 for 100 % projection of 109.71 to 111.82 and 110.84 at 112.95 first. On the downside, below 111.69 minor support will turn intraday bias neutral. But, break of 110.84 is needed to confirm completion of rise form 109.71. Otherwise, further rally will remain in favor in case of retreat.
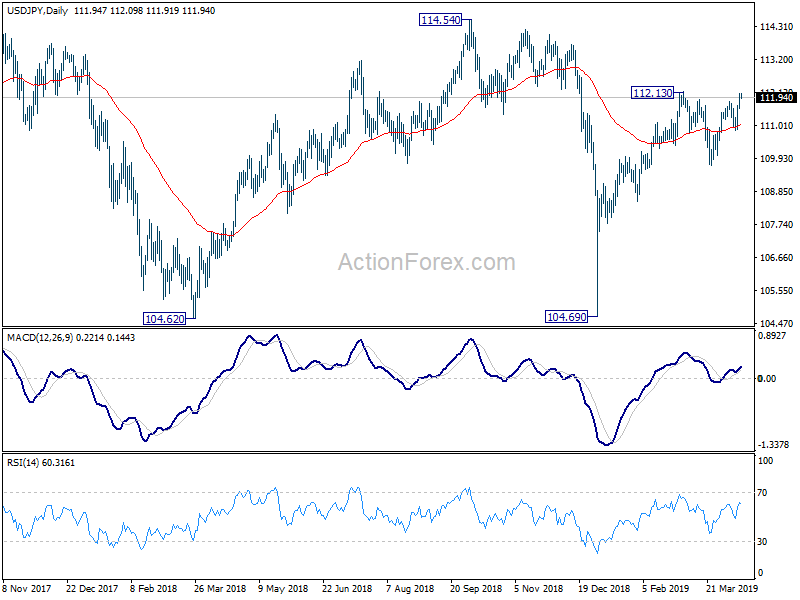
In the bigger picture, medium term outlook in USD/JPY remains a bit mixed as it's staying inside falling channel from 118.65, but there are signs of bullish reversal. On the upside, break of 114.54 resistance will revive the case the corrective fall from 118.65 has completed with three waves down to 104.69. And whole rise from 98.97 (2016 low) is resuming for 118.65 and above. But before that, outlook stays neutral first.
Risk Appetite Lifted by More US-China Trade Optimism, Eurozone and China Data Watched This Week
Dollar trade mildly lower in Asian session after more verbal attack on Fed by Trump. Australian Dollar follows as second weakest, paring some of last week's gains. On the other hand, New Zealand Dollar is the second strongest one, followed by Sterling. But after all, all major pairs and crosses are bounded inside Friday's range only. The picture could change drastically as the day goes.
Risk appetite firm up mildly on more optimism over US-China trade deal. Comments from US Treasurer Steven Mnuchin were affirmative. Reports that US is conceding demand on subsidies to State Own Enterprises make the progress more credible. To solidify risk rallies, economic data from Eurozone and China this week will need to show more evidence of stabilization.
Technically, Yen pairs will be the immediate focuses. USD/JPY is pressing 112.13 resistance. Firm break will resume whole rise from 104.69 flash crash low. Similarly, EUR/JPY pressing 126.78/127.50 resistance zone. Break will resume larger rise from 118.62. GBP/USD, GBP/JPY, EUR/GBP, EUR/AUD and USD/CAD are staying in established range. These pairs will be watched for signs of breakout.
In Asia, currently, Nikkei is up 1.46%. Hong Kong HSI is up 0.58%. China Shanghai SSE is up 1.12%. Singapore Strait Times, however, is down -0.07%. Japan 10-year JGB yield is up 0.0161 at -0.032.
Mnuchin: US-China trade talks close to final round
Over the weeknd, US Treasury Secretary Steven Mnuchin said trade negotiations with China are "close to the final round of concluding issues". But he emphasized that this is "not a public negotiation". And it's a "very, very detailed agreement covering issues that have never been dealt with before".
Mnuchin claimed that "this is way beyond anything that looked like a bilateral investment treaty." He said the two sides are negotiating an agreement with seven chapters that would be "the most significant change in the trading relationship in 40 years."
Also, there will be "real enforcement on both sides". And he expected the enforcement mechanism to work in "both directions". "If we don't, there should be certain repercussions, and the same way in the other direction."
US watering down demands on SOEs in trade negotiations with China
Intellectual property theft, forced technology transfer, market access, and market distortion by subsidies to State Owned Enterprises (SOEs) are among the core issues in US-China trade negotiations. According to a Reuters report quoting unnamed sources, the US is stepping back on its demand regarding SOEs in China.
An important tricky point regarding SOEs is that it's tightly interwind with the Chinese government's industrial policy. That's deeply rooted in the fundamental nature of China's system, a "systematic rival" to major economies in the world as seen by EU. While China is making concessions in other areas, it's an area that the socialist country won't concede ground. A source said that "if U.S. negotiators define success as changing the way China's economy operates, that will never happen".
In addition, China is expected to ramp up purchases of US goods as part of the trade deal. But who's going to make the purchases? It's most likely the SOEs which the government has direct control on. Thus, another sources said "the purchasing, for example, reinforces the role of the state sector because the purchasing is all being done through state enterprises."
Trump: Fed hasn't done it job properly
Trump once again attacked the Fed with his tweet and claimed that it hadn't done it job properly. His argument was that otherwise, "Stock Market would have been up 5000 to 10,000 additional points, and GDP would have been well over 4% instead of 3%…with almost no inflation." However, he made no reference to unemployment rate at decades low, while core PCE was close to target. He also complained that "quantitative tightening was a killer, should have done the exact opposite!". According to the Federal Reserve Act, Fed's statutory objectives for monetary policy include "maximum employment, stable prices, and moderate long-term interest rates". Fed's objectives here in case you're interested.
Over the weekend, ECB President Mario Draghi said he's "certainly worried about central bank independence in other countries, especially… in the most important jurisdiction in the world'. He emphasized, "central banks ought to be left free to choose what's the best way to comply with the mandate." He added: "Because if you don't let them be free, then they're not accountable. That's the central banking framework since the 80s everywhere."
Continuous efforts to politicizing Fed are raising concerns that Fed is becoming a source of "instability" to the world, rather than an agent on "stability.
Eurozone and China data could solidify or derail risk appetite
Two of the biggest risks in global economy are slowdown in Eurozone. Data from both will need to, at least, meet market expectations to keep the current risk appetite going. Eurozone will have German ZEW and PMIs. China will have GDP, industrial productions and retail sales.
While there are expectations of two RBA rate cuts this year, recent data and comments didn't support such view yet. Australia employment will be a wild card this week too.
In addition, there will be triple of employment, CPI and retail sales from UK. Canada will release CPI and retail sales. US will retail sales, housing and Beige Book. New Zealand will release CPI.
The week might be holiday shortened, but it won't be boring.
Here are some highlights for the week:
- Monday: UK Rightmove house price; US Empire State manufacturing index; BoC business outlook survey
- Tuesday: RBA minutes; Japan tertiary index index; UK employment; German ZEW economic sentiment; Canada manufacturing sales, foreign securities purchases. US industrial production, NAHB housing index
- Wednesday: New Zealand CPI; Australia leading indicator; Japan trade balance; China industrial production, retail sales, fixed asset investment, GDP; Eurozone current account, trade balance, CPI final; UK CPI, PPI; Canada CPI, trade balance; US trade balance, Fed's Beige Book report
- Thursday: Australia employment, NAB business confidence; Swiss trade balance; Germany PPI; Eurozone PMIs; UK retail sales; Canada retail sales; US retail sales, Phily Fed survey, jobless claims, PMIs, business inventories, leading indicator
- Friday: Japan national CPI core; US housing starts and building permits
USD/JPY Daily Outlook
Daily Pivots: (S1) 111.68; (P) 111.88; (R1) 112.22; More...
Intraday bias in USD/JPY remains on the upside with focus on 112.13 key resistance. Decisive break there will resume whole rise from 104.69 for 100 % projection of 109.71 to 111.82 and 110.84 at 112.95 first. On the downside, below 111.69 minor support will turn intraday bias neutral. But, break of 110.84 is needed to confirm completion of rise form 109.71. Otherwise, further rally will remain in favor in case of retreat.
In the bigger picture, medium term outlook in USD/JPY remains a bit mixed as it's staying inside falling channel from 118.65, but there are signs of bullish reversal. On the upside, break of 114.54 resistance will revive the case the corrective fall from 118.65 has completed with three waves down to 104.69. And whole rise from 98.97 (2016 low) is resuming for 118.65 and above. But before that, outlook stays neutral first.
Economic Indicators Update
| GMT | Ccy | Events | Actual | Forecast | Previous | Revised |
|---|---|---|---|---|---|---|
| 23:01 | GBP | Rightmove House Prices M/M Apr | 1.10% | 0.40% | ||
| 6:30 | CHF | Producer & Import Prices M/M Mar | 0.20% | 0.20% | ||
| 6:30 | CHF | Producer & Import Prices Y/Y Mar | -0.20% | -0.70% | ||
| 12:30 | USD | Empire State Manufacturing Index Apr | 8 | 3.7 | ||
| 14:30 | CAD | BoC Business Outlook Survey | ||||
| 20:00 | USD | Net Long-term TIC Flows (USD Feb | -18.2B | -7.2B |
US watering down demands on SOEs in trade negotiations with China
Intellectual property theft, forced technology transfer, market access, and market distortion by subsidies to State Owned Enterprises (SOEs) are among the core issues in US-China trade negotiations. According to a Reuters report quoting unnamed sources, the US is stepping back on its demand regarding SOEs in China.
An important tricky point regarding SOEs is that it's tightly interwind with the Chinese government's industrial policy. That's deeply rooted in the fundamental nature of China's system, a "systematic rival" to major economies in the world as seen by EU. While China is making concessions in other areas, it's an area that the socialist country won't concede ground. A source said that "if U.S. negotiators define success as changing the way China's economy operates, that will never happen".
In addition, China is expected to ramp up purchases of US goods as part of the trade deal. But who's going to make the purchases? It's most likely the SOEs which the government has direct control on. Thus, another sources said "the purchasing, for example, reinforces the role of the state sector because the purchasing is all being done through state enterprises."
Trump: Fed hasn’t done it job properly
Trump once again attacked the Fed and claimed that it hadn't done it job properly. His argument was that otherwise, "Stock Market would have been up 5000 to 10,000 additional points, and GDP would have been well over 4% instead of 3%...with almost no inflation." However, he made no reference to unemployment rate at decades low, while core PCE was close to target. He also complained that "quantitative tightening was a killer, should have done the exact opposite!".
https://twitter.com/realDonaldTrump/status/1117428291227533312
According to the Federal Reserve Act, Fed's statutory objectives for monetary policy include "maximum employment, stable prices, and moderate long-term interest rates". Fed's objectives here in case you're interested.
Market Morning Briefing: The Aussie Is Testing Important Resistance At 0.72
STOCKS
Asian equities are up. Other global indices like the Dow and DAX have also bounced from their key supports last week and looks bullish in the near term. The Indian indices, which have been stuck in a narrow range in the past week looks likely to break the range on the upside and move higher in the short term.
Dow (26412, +269.25, +1.03%) has risen above 26250 and is bullish to test 26500. A pull-back from 26500 can take it lower to 26250 again. But the bias on the chart is bullish for the Dow to breach 26500 and rally to 26750 and 27000 in the short term.
DAX (11999.93, +64.73, +0.54) can extend its upmove to 12100 on a break above the immediate resistance level of 12030. A strong break above 12100 will negate the bearish view for a fall to 11800-11700 that we were expecting last week. The index can then target 11200 and then probably reverse lower again.
Nikkei (22190.71, +320.15, +1.46%) has risen past the key 21930-21950 resistance region which will now act as a good support. While above this support region, the outlook will be bullish for a further rally to 22500-22600.
Contrary to our expectation for a fall to 3150 and 3130, (Shanghai (3244.13, +55.51, +1.74%) risen back sharply above 3200. The index can revisit 3280 levles again in the near term.
Sensex (38767.11, +160.10, +0.41%) is still stuck in between 38500 and 39000. But the bias on the chart is turning bullish for it to break 39000 and rally to 39400-39500 in the near term.
Nifty (11643.45, +46.75, +0.40%) has held very well above 11550 all through last week. The possibility is turning high for the Nifty to break above 11700 and move higher to 11750 and 11800 in the coming days.
COMMODITIES
Gold and silver can see some more dip in the near term. Copper is mixed and range bound. Oil has to hold above a key support to move further higher, else a corrective fall is on the cards.
Gold (1289) remains pressured on the downside. While below 1300, the outlook is negative for a fall to 1285 and 1290. A break below the immediate support level of 1287 can trigger this fall.
Silver (14.95) can fall to 14.85 and 14.80 while it trades below 15.
Copper (2.94) has been volatile between 2.88 and 2.96 over the last couple of weeks. A breakout on either side of 2.88 or 2.96 will decide whether copper will go up to 3.0 or fall to 2.84.
Brent (71.30) has been stuck in between 70.30 and 72 over the last one week. As long as the support in the 70.50-70.30 region holds, the outlook is bullish in the near term for a test of 72.70 - the 61.8% Fibonacci retracement resistance.
WTI (63.55) has a crucial support at 63.40 which has to hold to keep the bullish view intact for a test of 66. If WTI breaks below 63.40, a fall to 63 or even 62 cannot be ruled out. retracement resistance level.
FOREX
Most currencies are trading at crucial, could-go-either-way junctures. This week can see them pick up a trend one way or the other. Lots of economic data releases this week.
The Dollar Index (96.83) is looking weakish, contrary to expectation of a rise towards 97.25/35. Or it could still be bullish given Support at 96.62, the 21-week Moving Average. Crucial to see if this holds or breaks this week.
The Euro (1.1313) is at a crucial juncture now. It broke above 1.1300 on Friday to see a high of 1.1324, but then retreated from there. It might either move up some more towards stronger Resistance at 1.1400 (proving our bearishness), or it could dip back to 1.1250-1200. We just have to wait to see which way it goes.
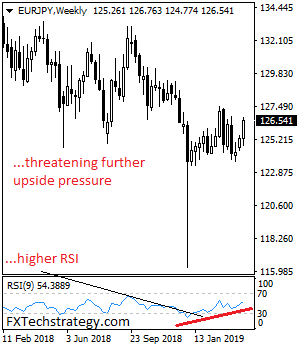
The Euro-Yen (126.69) might have the potential to move up towards 128, but for that it has to remain above 126.00-125.50 and also rise to 127 over today-tomorrow.
Dollar-Yen (111.99) has immediate intra-day Resistance at 112.50 but that might break for a rise to stronger, longer-term Resistance at 113.50 during the week, where some profit-taking can come in.
The Aussie (0.7178) is testing important Resistance at 0.72. If last week's rally sustains, it may try to move further up towards 0.73 over the next couple of weeks.
Chinese Yuan (6.7091) trades below immediate Resistance at 6.72. Further dip below 6.70 will accentuate overall bearishness towards 6.67-66. Else, there can be some chances of a small rally towards 6.75-78. Trend might become clear today itself.
Looking at the 3-day Candles, Dollar-Rupee (69.1550) appears to be totally indecisive between 68.50-69.75. Intra-week Support at 68.75, Resistance at 69.35-50. Might be good to stand aside and watch.
INTEREST RATES
Both the US and Euro bond yields have risen on Friday and are closer to key near-term resistances. Both the US and Euro yields can fall after testing those resistances.
The US 2Yr (2.40%), 5Yr (2.38%), 10Yr (2.56%) and 30Yr (2.98%) yields have risen sharply on Friday. But key resistances are ahead at 2.59% for the 5YR and 3.0% for the 30Yr yields which is likely to cap the upside and push the yields lower again.
The German 5Yr (-0.37%), 10Yr (0.058%) and 30Yr (0.703%) yields have risen on Friday while the 2Yr (-0.554%) remained stable. The 10Yr has resistance at 0.07% and the 30Yr has it at current levels and the yields can reverse lower in the coming days.
The 10Yr GOI (7.5654%) yield has risen sharply on Friday breaking above 7.55%. But a resistance is at current levels. A strong break above it is needed to take the yield further higher to 7.60% and 7.63%. A pull-back from current levels may drag the yield to 7.53% and 7.50% again.
EUR/USD Showing Positive Signs Above 100 SMA
Key Highlights
- The Euro started a strong rebound after trading as low as 1.1183 against the US Dollar.
- A crucial bullish trend line is formed with support at 1.1250 on the 4-hours chart of EUR/USD.
- The Michigan Consumer Sentiment Index in April (Prelim) declined from 98.4 to 96.9.
- The NY Empire State Manufacturing Index in April 2019 might increase from 3.7 to 6.0.
EURUSD Technical Analysis
Earlier this month, the Euro traded towards the 1.1180 level before starting a strong rebound against the US Dollar. The EUR/USD pair broke the 1.1220 and 1.1250 resistance levels to move into a positive zone.
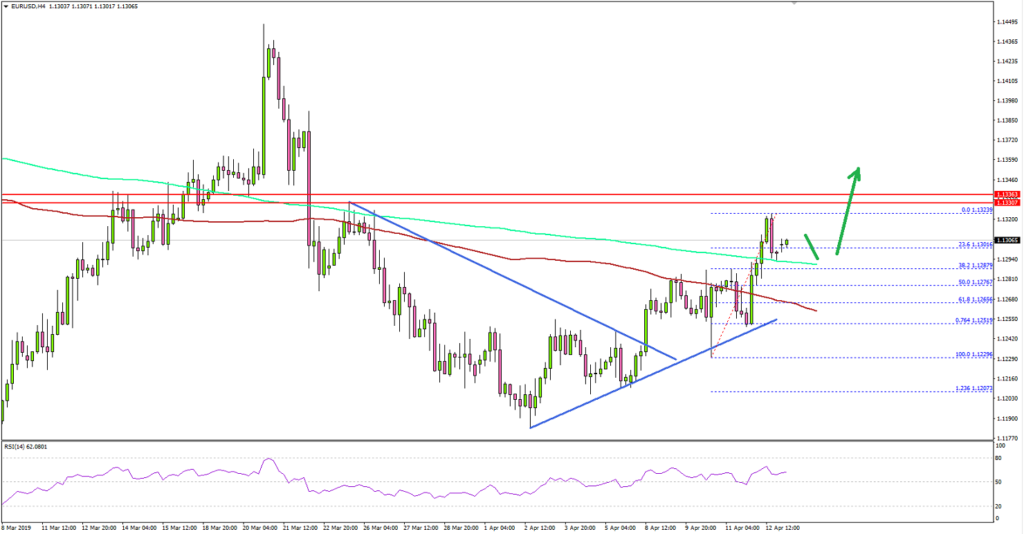
Looking at the 4-hours chart, the pair even broke the 1.1265 and 1.1280 resistance levels. An intermediate swing low was formed at 1.1229 and later the pair settled above the 100 simple moving average (4-hours, red).
Finally, the price traded above the 1.1300 level before running into the 1.1320-1.1340 resistance area. Recently, it corrected lower below the 23.6% Fib retracement level of the last wave from the 1.1229 low to 1.1323 high.
On the downside, there are many supports near the 1.1275 and 1.1265 levels. The 50% Fib retracement level of the last wave from the 1.1229 low to 1.1323 high is also near 1.1276 to act as a support.
More importantly, there is a crucial bullish trend line is formed with support at 1.1250 on the 4-hours chart of EUR/USD. Therefore, the pair remains supported on dips near the trend line and the 100 SMA.
Fundamentally, the Michigan Consumer Sentiment Index (Prelim) for April 2019 was released by the University of Michigan. The market was looking for a minor decline in the index from 98.4 to 98.0.
The actual result was lower than the forecast, as the Michigan Consumer Sentiment Index is expected to decline to 96.9 in April 2019. Looking at the index of consumer, there could be a decline from 88.8 to 85.8.
Overall, EUR/USD is showing positive signs and it could make an attempt to climb above 1.1340 as long as the 1.1250 support is intact.
Economic Releases to Watch Today
- Swiss PPI for March 2019 (MoM) – Forecast +0.3%, versus +0.2% previous.
- NY Empire State Manufacturing Index April 2019 – Forecast 6.0, versus 3.7 previous.
EURUSD Sets Up To Extend Recovery Threats
EURUSD sets up to extend recovery threats as the pair still retains its upside pressure. Support comes in at the 1.1250 where a violation will turn risk to the 1.1200 level. A break below here will target the 1.1150 level. Further down, support sits at the 1.1100. Conversely, on the upside, resistance resides at 1.1350 level with a break through there opening the door for further upside towards the 1.1.1400 level. Further up, resistance comes in at the 1.1450 level where a violation will expose the 1.1500 level. All in all, EURUSD sets up to extend recovery threats on upside pressure.
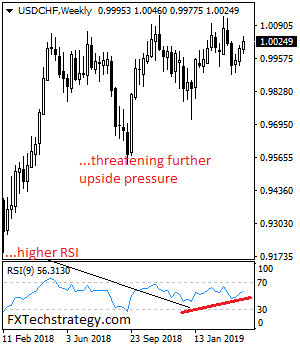
USDCHF Continues To Eye Further Upside Pressure
USDCHF continues to eye further upside pressure following it higher close the past week. Resistance stands at the 1.0050 level. A break of there will clear the way for a run at the 1.0100 level. Above here, resistance lies at the 1.0050 level and then the 1.0150 level. Its weekly RSI is pointing higher suggesting more strength. On the downside, support is seen at the 0.9950 level. A turn below here will set the stage for more decline towards the 0.9900 level. And then the 0.9850 level. Further down, support resides at the 0.9800 level. All in all, USDCHF continues to eye further upside pressure on corrective recovery.