Sample Category Title
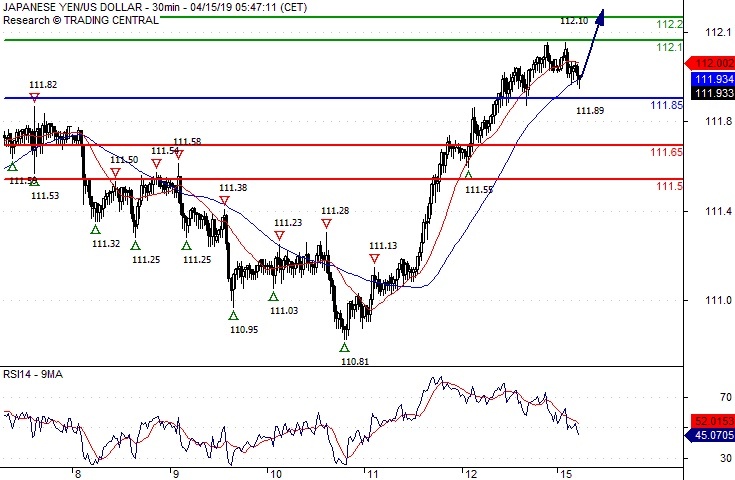
USD/JPY Bullish Bias Above 111.85
Pivot (invalidation): 111.85
Our preference Long positions above 111.85 with targets at 112.10 & 112.20 in extension.
Alternative scenario Below 111.85 look for further downside with 111.65 & 111.50 as targets.
Comment Even though a continuation of the consolidation cannot be ruled out, its extent should be limited.
EUR/GBP Daily Outlook
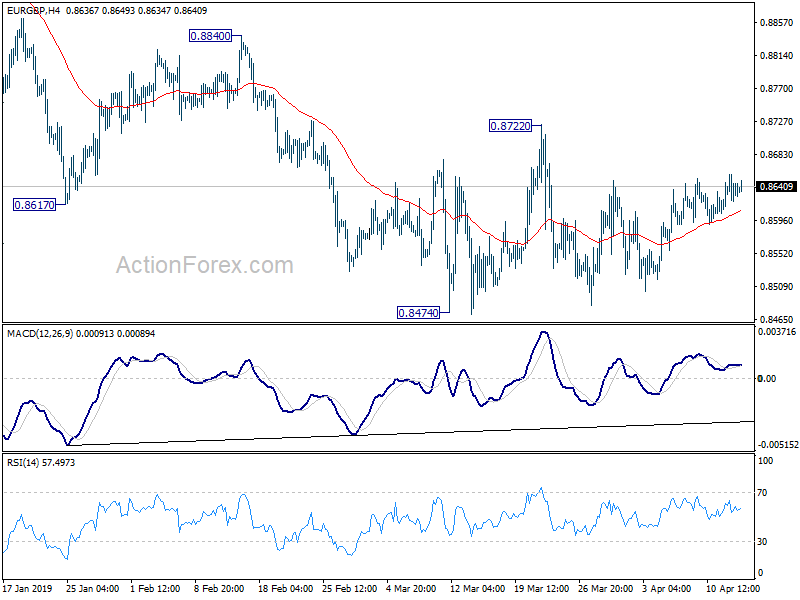
Daily Pivots: (S1) 0.8623; (P) 0.8641; (R1) 0.8664; More...
Intraday bias in EUR/GBP remains neutral at consolidation from 0.8474 is extending. Upside should be limited by 0.8722 resistance to bring down trend resumption. On the downside, firm break of 0.8474 will resume larger down trend for 0.8416 long term projection next. On the upside, though, sustained break of 0.8722 will suggest near term reversal and bring stronger rise back to 0.8840 resistance and above.
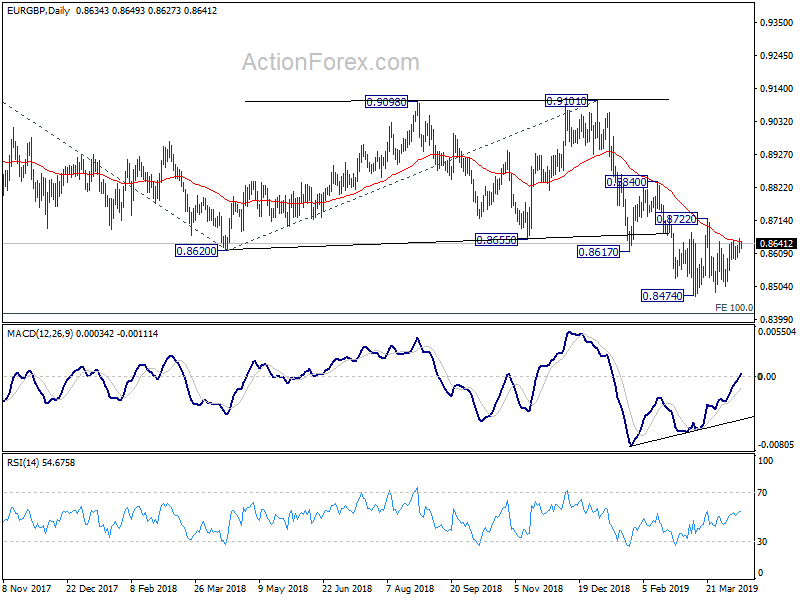
In the bigger picture, EUR/GBP is seen as staying in long term range pattern started at 0.9304 (2016 high). Current fall from 0.9305 (2017 high) is a falling leg inside the pattern. Such decline could extend to 100% projection of 0.9305 to 0.8620 from 0.9101 at 0.8416 and possibly below. But for now, we'd expect strong support around 0.8312 support to contain downside and bring rebound.
GBP/USD Continuation Of The Rebound
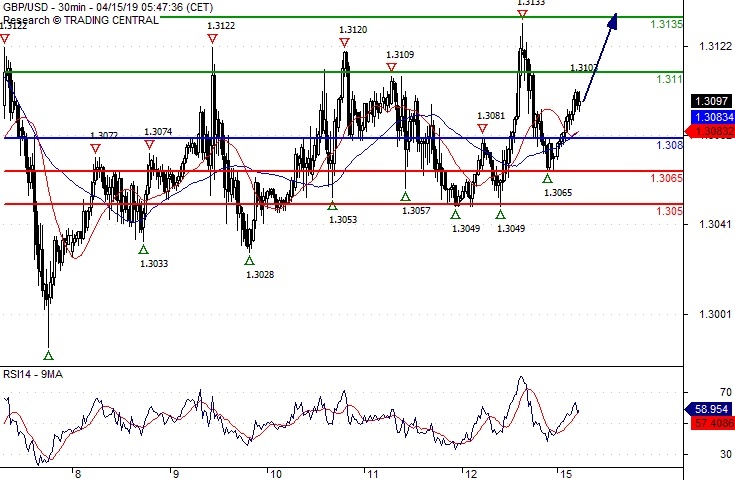
Pivot (invalidation): 1.3080
Our preference Long positions above 1.3080 with targets at 1.3110 & 1.3135 in extension.
Alternative scenario Below 1.3080 look for further downside with 1.3065 & 1.3050 as targets.
Comment The break above 1.3080 is a positive signal that has opened a path to 1.3110.
EUR/USD The Upside Prevails
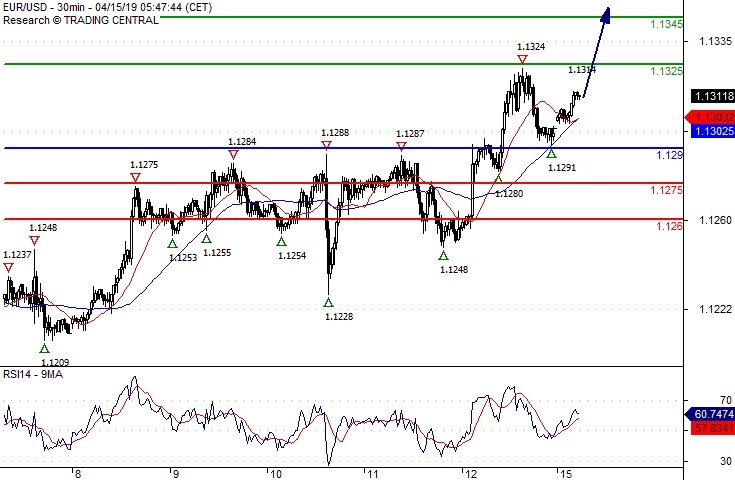
Pivot (invalidation): 1.1290
Our preference Long positions above 1.1290 with targets at 1.1325 & 1.1345 in extension.
Alternative scenario Below 1.1290 look for further downside with 1.1275 & 1.1260 as targets.
Comment The RSI has just landed on its neutrality area at 50% and is turning up.
EUR/AUD Daily Outlook
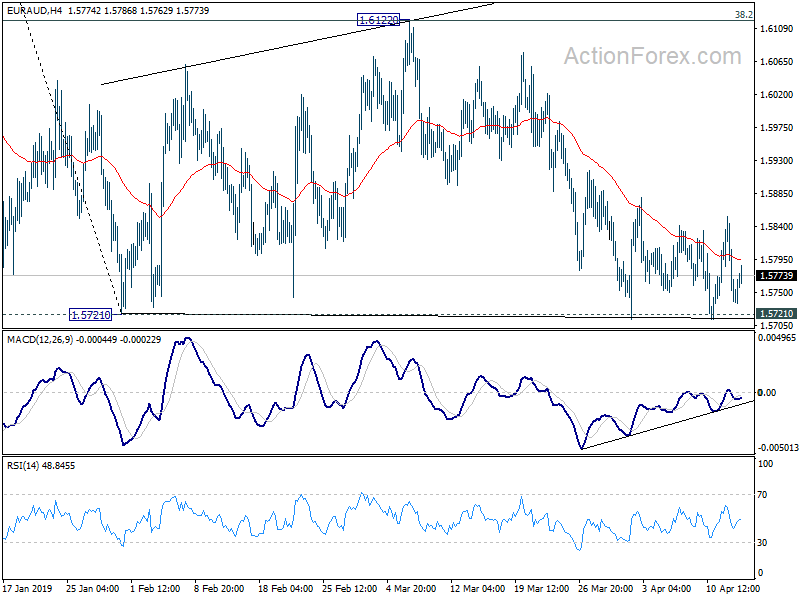
Daily Pivots: (S1) 1.5708; (P) 1.5781; (R1) 1.5826; More...
Intraday bias in EUR/AUD remains neutral for the moment. Consolidation from 1.5721 might extend further. But in case of another rise, upside should be limited by 1.6122 near term resistance. On the downside, decisive break of 1.5721 will resume the decline from 1.6765 to 1.5346 key support next.
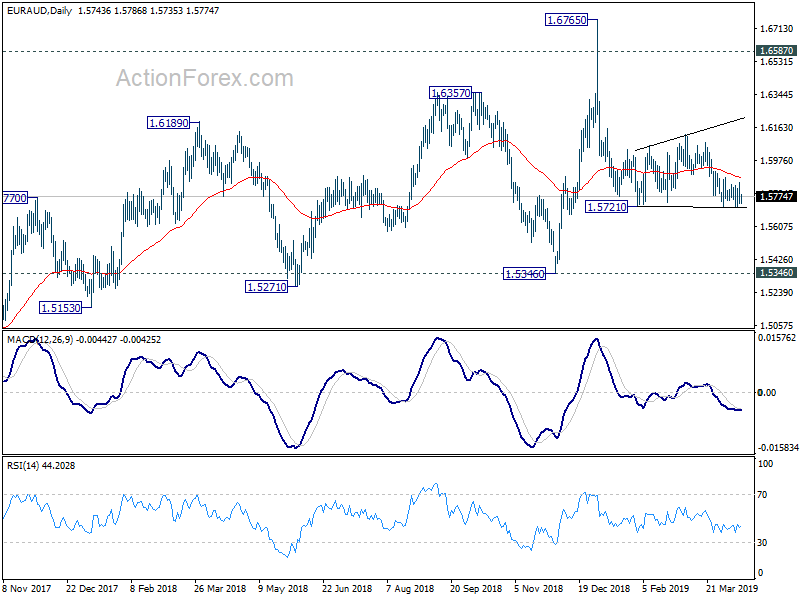
In the bigger picture, as long as 1.5346 support holds, outlook will still remain bullish. Uptrend from 1.1602 (2012 low) is expected to resume sooner or later. Break of 1.6765 will target 61.8% retracement of 2.1127 (2008 high) to 1.1602 at 1.7488 next. However, firm break of 1.5346 key support will indicate trend reversal, with bearish divergence condition in weekly MACD, and turn outlook bearish.
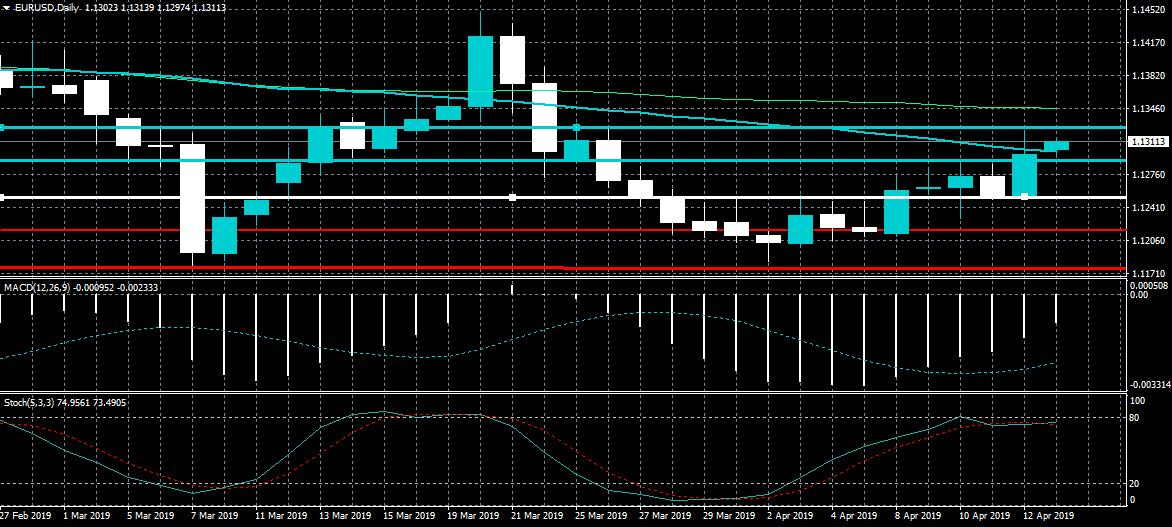
EURUSD 1.1360 Major Resistance
The euro is trading close to the 1.1300 level against the US dollar after finding strong technical resistance from the 1.1325 level last Friday. The bullish inverted head and shoulders on the lower time frames has reached its upside target, with the 1.1360 level now major weekly resistance. Looking at the downside, if sellers move price below the 1.1250 support level the intraday sentiment towards the EURUSD pair will turn bearish.
The EURUSD pair is strongly bullish while trading above the 1.1290 level, key technical resistance is found at the 1.1325 and 1.1360 levels.
If the EURUSD pair trades below 1.1290 level, key intraday support is found at the 1.1250 and 1.1216 support levels.
BTCUSD $4,920 Major Support
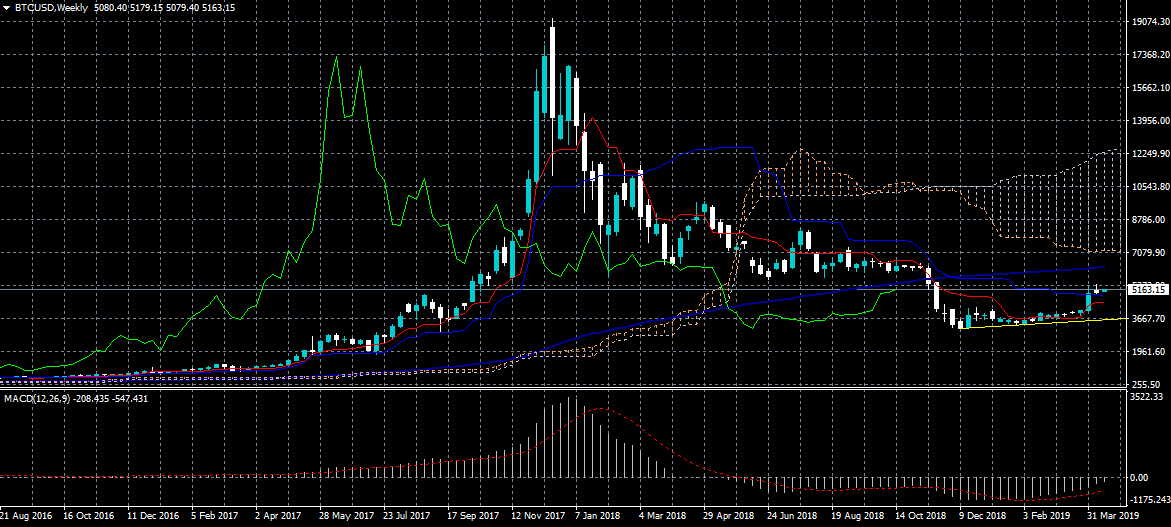
Bitcoin has opened the new trading week with a bullish tone, as BTCUSD buyers attempt to recover the losses that occurred towards the end of last week. The Ichimoku indicator is currently showing that major weekly support is located at the $4,920 level, while critical support is located at the $4,500 level. Key weekly resistance for the BTCUSD pair is currently found at the $5,454 and $6,200 levels.
The BTCUSD pair is bullish while trading above the $4,920 level, key intraday resistance is found at the $5,454 and $6,200 levels.
If the BTCUSD pair trades under the $4,920 level, sellers may test towards the $4,700 and $4,500 support levels.
USDJPY 113.20 Key Resistance
The US dollar continues to enjoy strong buying interest against the Japanese currency after the pair closed the former trading week above its key 200-day moving average. The USDJPY pair has a strong bullish bias while trading above the 111.80 level, with the 113.20 level the strongest weekly resistance area. The four-hour time is also showing that a bullish inverted head and shoulders pattern has formed.
The USDJPY pair is bullish while trading above the 111.80, key intraday resistance is found at the 112.30 and 113.20 levels.
If the USDJPY pair trades below the 111.80 level, key intraday support is found at the 111.60 and 111.30 levels.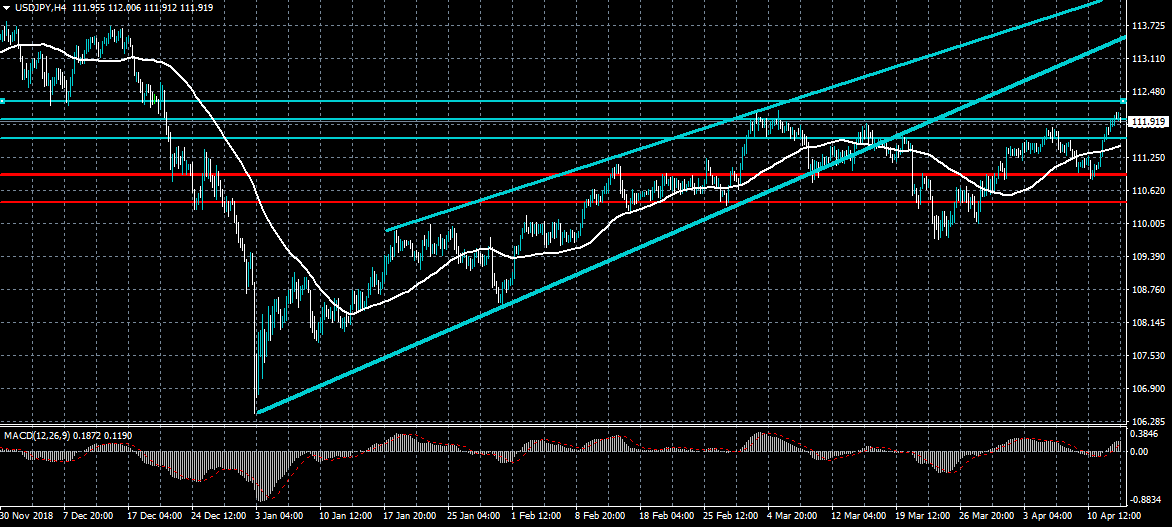
USD Falls As Central Bankers Warn Of Fed Independence
The USD index declined in the Asian session as the tension between Donald Trump and the Federal Reserve continued. Over the weekend, the President said that the Fed’s decision to raise interest rates had helped reduce the momentum in the US stock market. The Fed has raised interest rates eight times, a move that the President has called unacceptable. His combative style with the Fed was criticize by a group of former Federal Reserve officials and foreign central bankers who met in Washington for IMF meetings. They said that his actions could weaken the confidence the world has on the USD.
The price of crude oil remained near YTD high as traders continued to focus on the supply cuts from OPEC. Last week, a report showed that most of its members had continued to cut production in line with what was discussed in the previous meeting. Saudi Arabia had cut almost 1 million barrels per day while the involuntary cuts from Iran and Venezuela had contributed to the tightening. On Friday, data from Baker Hughes showed that the number of rigs increased from 831 to 833. However, the US oil sector continues to face the challenge of transportation, with key pipelines still in construction.
With no major economic data expected today, traders will focus on the earnings from the United States. Today, key banks like Citigroup, Goldman Sachs, and M&T Bank will release their earnings. This is after the impressive results released by JP Morgan, Wells Fargo, and PNC Financial on Friday. Other important earnings that investors will focus on are Charles Schwab, Washington Federal, and PacWest Bancorp. These earnings could help determine the trajectory of the US stock market this week.
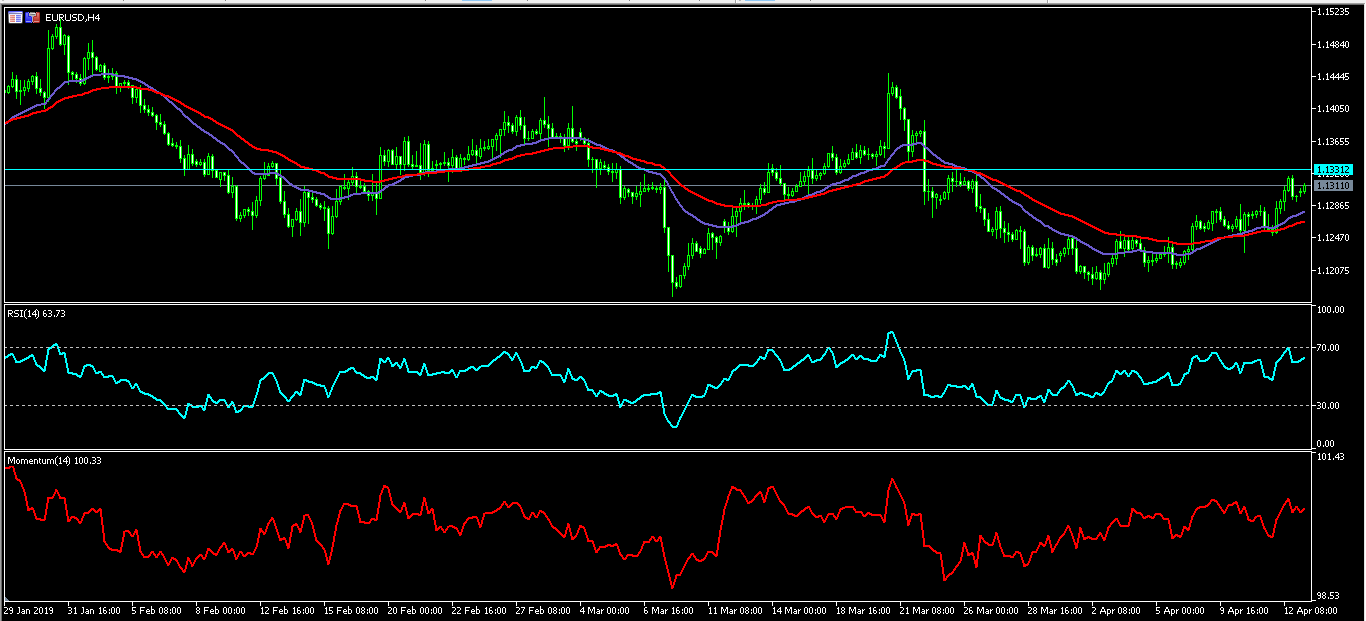
EUR/USD
The EUR/USD pair rose to a high of 1.1315. On the four-hour chart, the price has been rising since April 2, when it was trading at the 1.1182 level. The current price is slightly below the important resistance level of 1.1330. This price is below the 25-day and 50-day moving averages while the RSI remains slightly below the overbought level of 70. The momentum indicator is also moving higher. There is a likelihood that the price could continue moving higher today.
XTI/USD
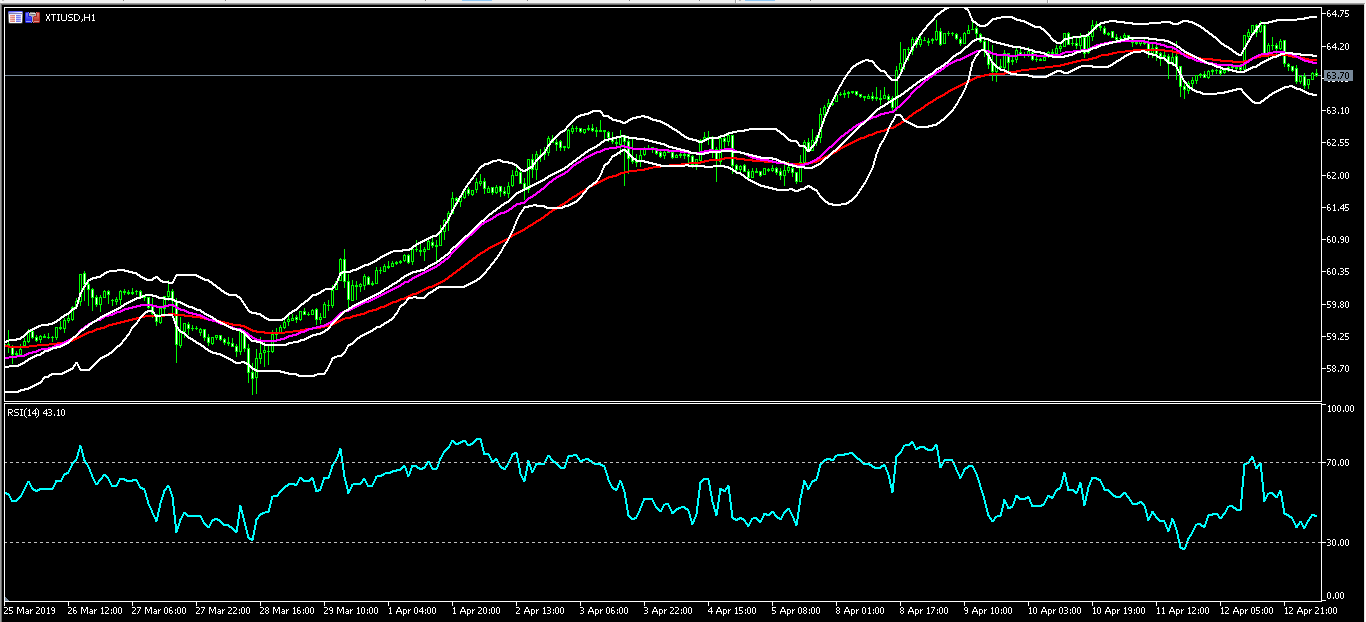
The XTI/USD pair was little moved today as traders continued to think about supply. The pair is now trading at 63.70. On the hourly chart, this price is slightly below the YTD high of 64.60. It is also slightly below the 25-day and 50-day moving averages and slightly above the lower line of the Bollinger Bands. The RSI has moved slightly higher to the current level of 43. The pair will likely continue the upward trend to test the previous high.
GBP/USD
The consolidation in the GBP/USD pair continued in overnight trading, with the pair now trading at the 1.3092 level. This level is along the 25-day and 50-day moving averages. The pair’s symmetrical triangle pattern is closer to reaching its apex. The price is also along the 50% Fibonacci Retracement level. This is an indication that the pair could have a major breakout this week depending on the progress made in the Brexit talks.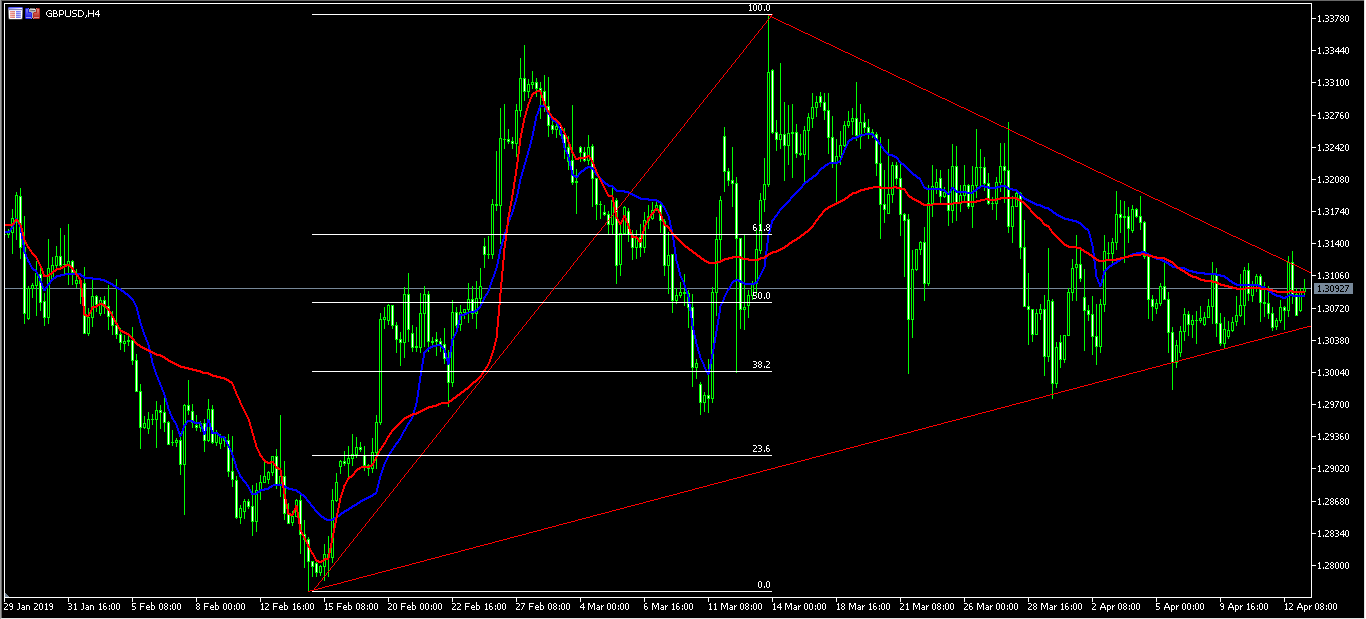
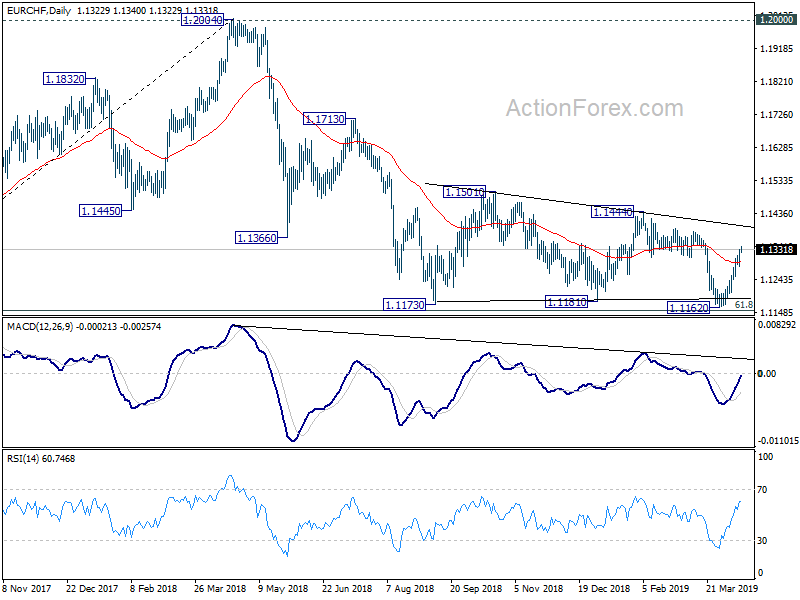
EUR/CHF Daily Outlook
Daily Pivots: (S1) 1.1299; (P) 1.1316; (R1) 1.1347; More....
Intraday bias in EUR/CHF remains on the upside for the moment. Current development suggests that fall from 1.1444 has completed at 1.1162 already. Further rise should be seen to 1.1384 resistance first. Break will target 1.1444 key resistance next. On the downside, however, break of 1.1254 will indicate completion of the rebound and turn bias back to the downside for 1.1162 low.
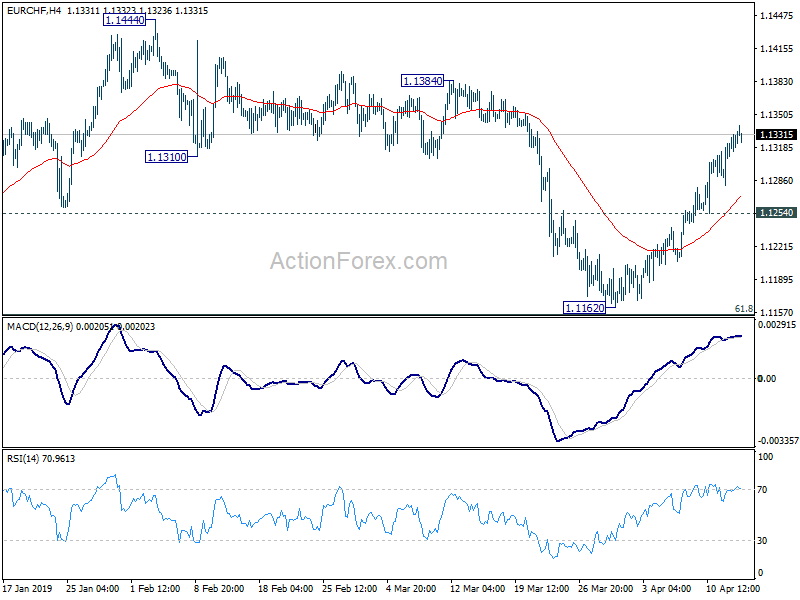
In the bigger picture, multiple rejection by 55 week EMA indicates medium term bearishness. Focus remains on 1.1154/98 support zone (2016 high and 61.8% retracement of 1.0629 to 1.2004 at 1.1154). Decisive break there will confirm resumption of whole down trend from 1.2004 and long term bearish reversal. EUR/CHF should then target 1.0629 support and below. This will now remain the favored case as long as 1.1444 resistance holds. However, decisive break of 1.1444 will indicate completion of fall from 1.2004 and turn medium term outlook bullish.