Sample Category Title
EUR/CAD 4H Chart: Reveals New Junior Channel
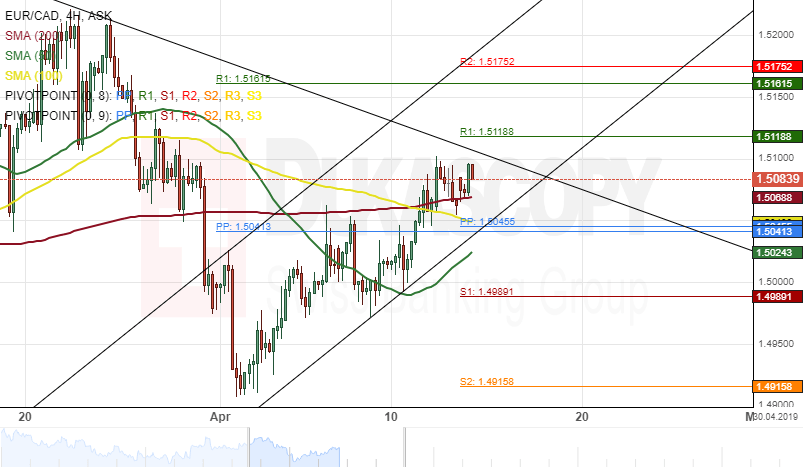
A junior ascending channel pattern has guided the Eurozone single currency versus the Canadian Dollar towards the upper boundary of a medium-term descending channel at 1.5099. The currency pair breached both the 100– and 200-hour SMAs during last week's trading session.
Everything being equal, it is likely that the currency exchange rate will continue to edge higher within this week's trading session. The potential targets for the pair will be near the weekly R1 at 1.5161.
Although, the upper boundary of the medium-term descending channel pattern could form as a resistance for the EUR/CAD pair in the short run.
The Analytical Overview Of The Main Currency Pairs
The EUR/USD currency pair
Technical indicators of the currency pair:
Prev Open: 1.12519
Open: 1.13032
% chg. over the last day: +0.44
Day's range: 1.12990 – 1.13157
52 wk range: 1.1214 – 1.2557
EUR/USD keeps showing a positive trend. Right now the EUR is consolidating around 1.13000. The demand for the risky assets remains relatively high. The local support and resistance levels are 1.12900 and 1.13200. The EUR/USD quotes have a tendency to grow further. You should open positions from the key levels.
This week will have some important releases which may affect the dynamics of the currency majors. The financial market participants also await for more data regarding Brexit and the US/China negotiations. On Friday the world trade platforms will be closed due to Good Friday.
The Economic News Feed for 15.04.2019 is calm.
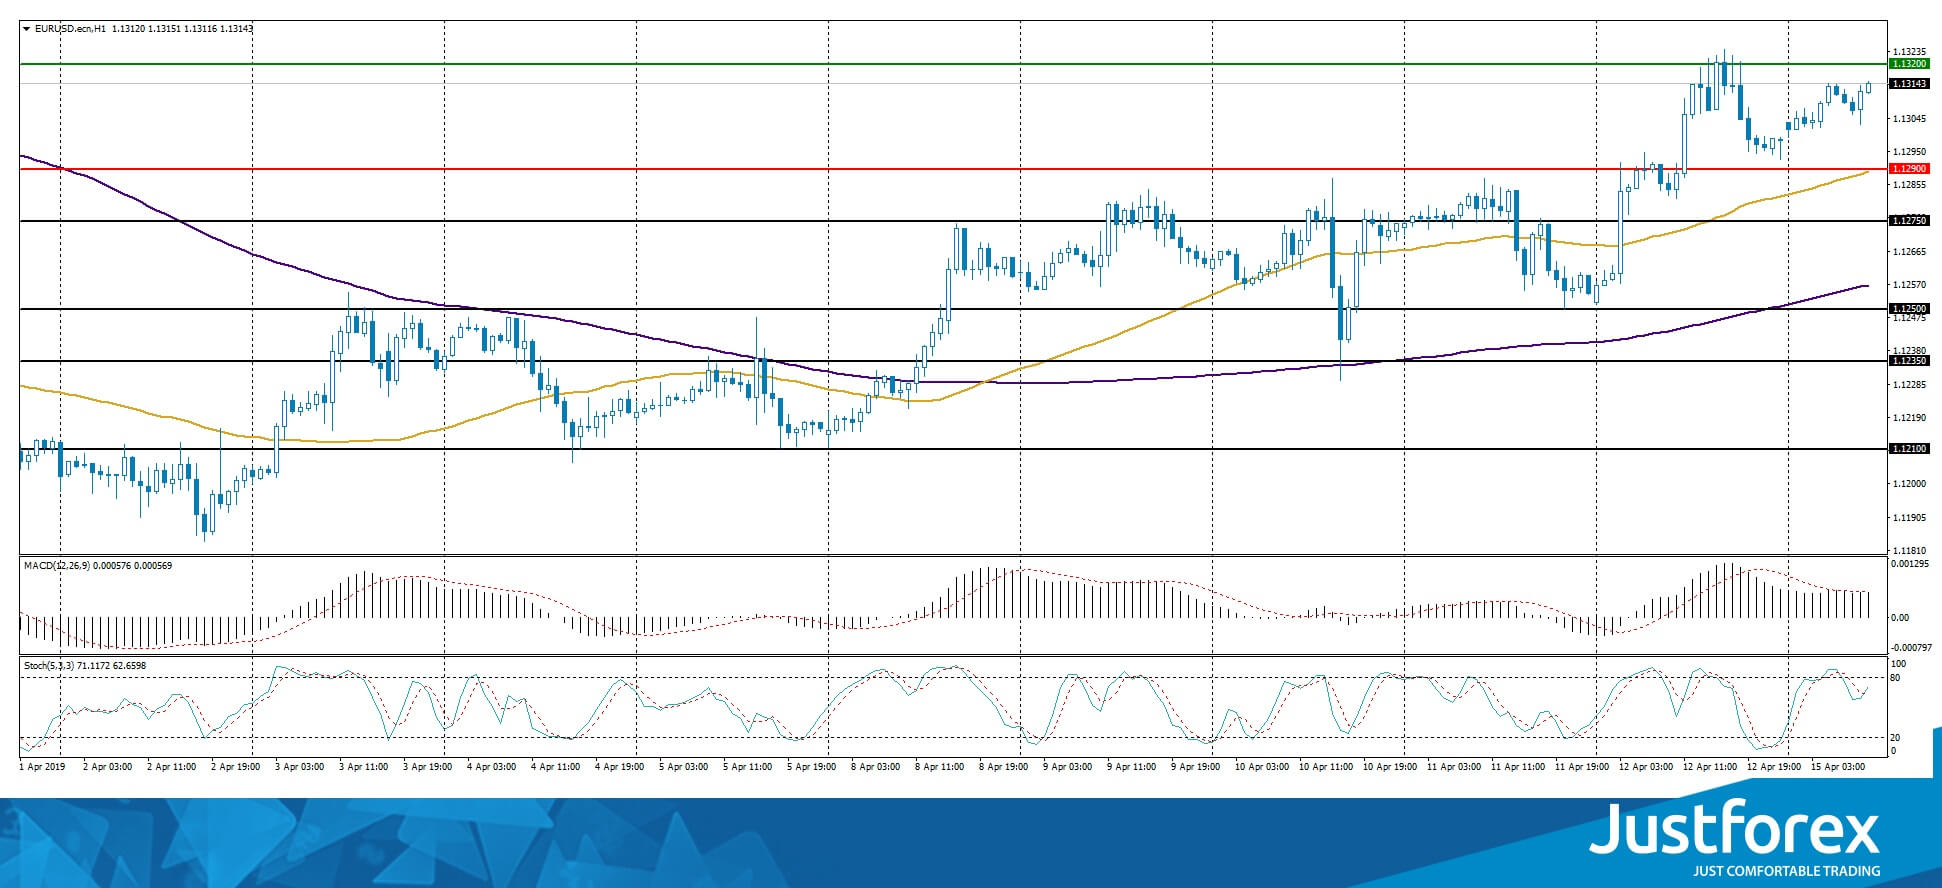
The price fixed above 50 MA and 200 MA which points to the power of the buyers.
The MACD histogram is in the positive zone and keeps rising, which points towards further growth of EUR/USD.
The Stochastic Oscillator is in the neutral zone, the %K line is crossing the %D line. There are no signals at the moment.
Trading recommendations
Support levels: 1.12900, 1.12750, 1.12500
Resistance levels: 1.13200, 1.13500, 1.14000
If the price fixes above 1.13200, expect the quotes to grow toward 1.13500-1.13800.
Alternatively, the quotes can fall toward 1.12700-1.12500.
The GBP/USD currency pair
Technical indicators of the currency pair:
Prev Open: 1.30526
Open: 1.30722
% chg. over the last day: +0.21
Day's range: 1.30673 – 1.31026
52 wk range: 1.2438 – 1.4378
GBP/USD keeps trading in a long flat. There is no defined trend. The investors are waiting for new info regarding Brexit. The EU postponed it last week, but the market participants are worried that Theresa May still won't be able to get an approval from the British lawmakers. Right now the local support and resistance are at 1.30650 and 1.31000 respectively. You should open positions from these levels.
The Economic News Feed for 15.04.2019 is calm.
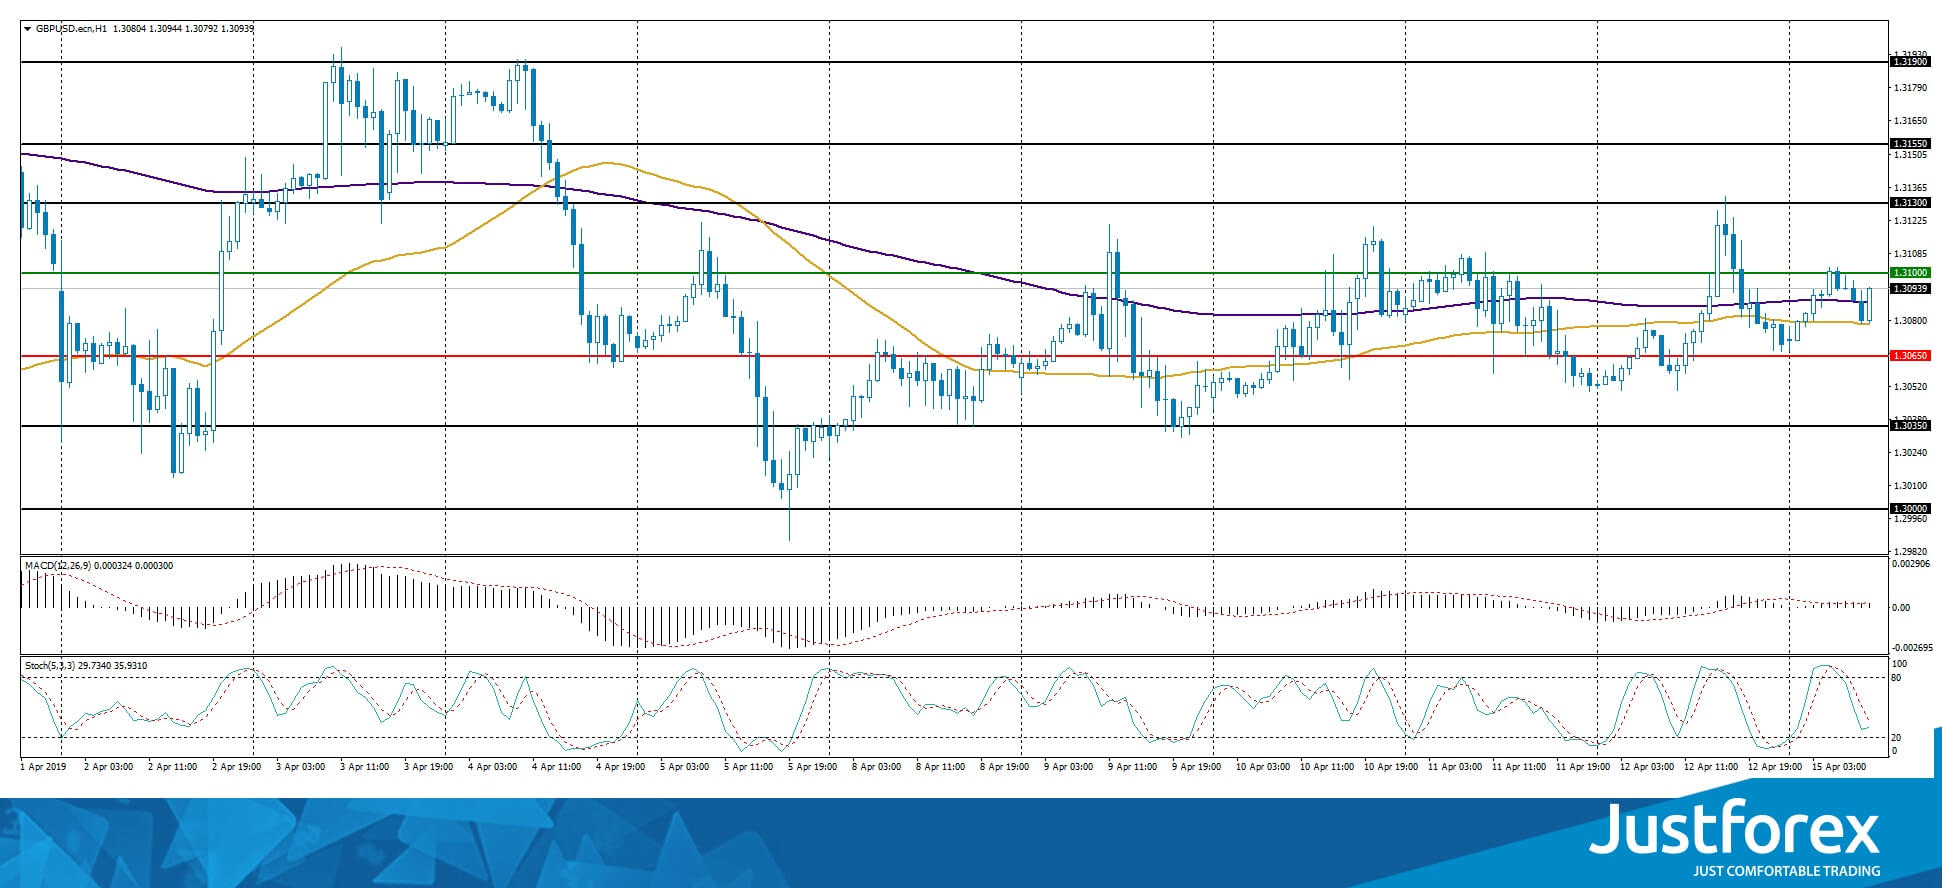
The indicators do not provide precise signals, the price has crossed 50 MA and 200 MA.
The MACD histogram is close to 0. There are no signals at the moment.
The Stochastic Oscillator is in the neutral zone, the %K line is below the %D line, which gives a signal to sell GBP/USD.
Trading recommendations
Support levels: 1.30650, 1.30350, 1.30000
Resistance levels: 1.31000, 1.31300, 1.31550
If the price fixes above 1.31000, expect the quotes to grow toward 1.31300-1.31500.
Alternatively, the quotes can fall toward 1.30400-1.30200.
The USD/CAD currency pair
Technical indicators of the currency pair:
Prev Open: 1.33845
Open: 1.33304
% chg. over the last day: -0.48
Day's range: 1.33197 – 1.33411
52 wk range: 1.2248 – 1.3664
USD/CAD shows an ambiguous technical picture. The CAD is consolidating at 1.33200-1.33400. The USD/CAD quotes have a tendency to descend. Keep an eye on the oil quotes dynamics and open positions from the key levels.
The Economic News Feed for 15.04.2019 is calm.
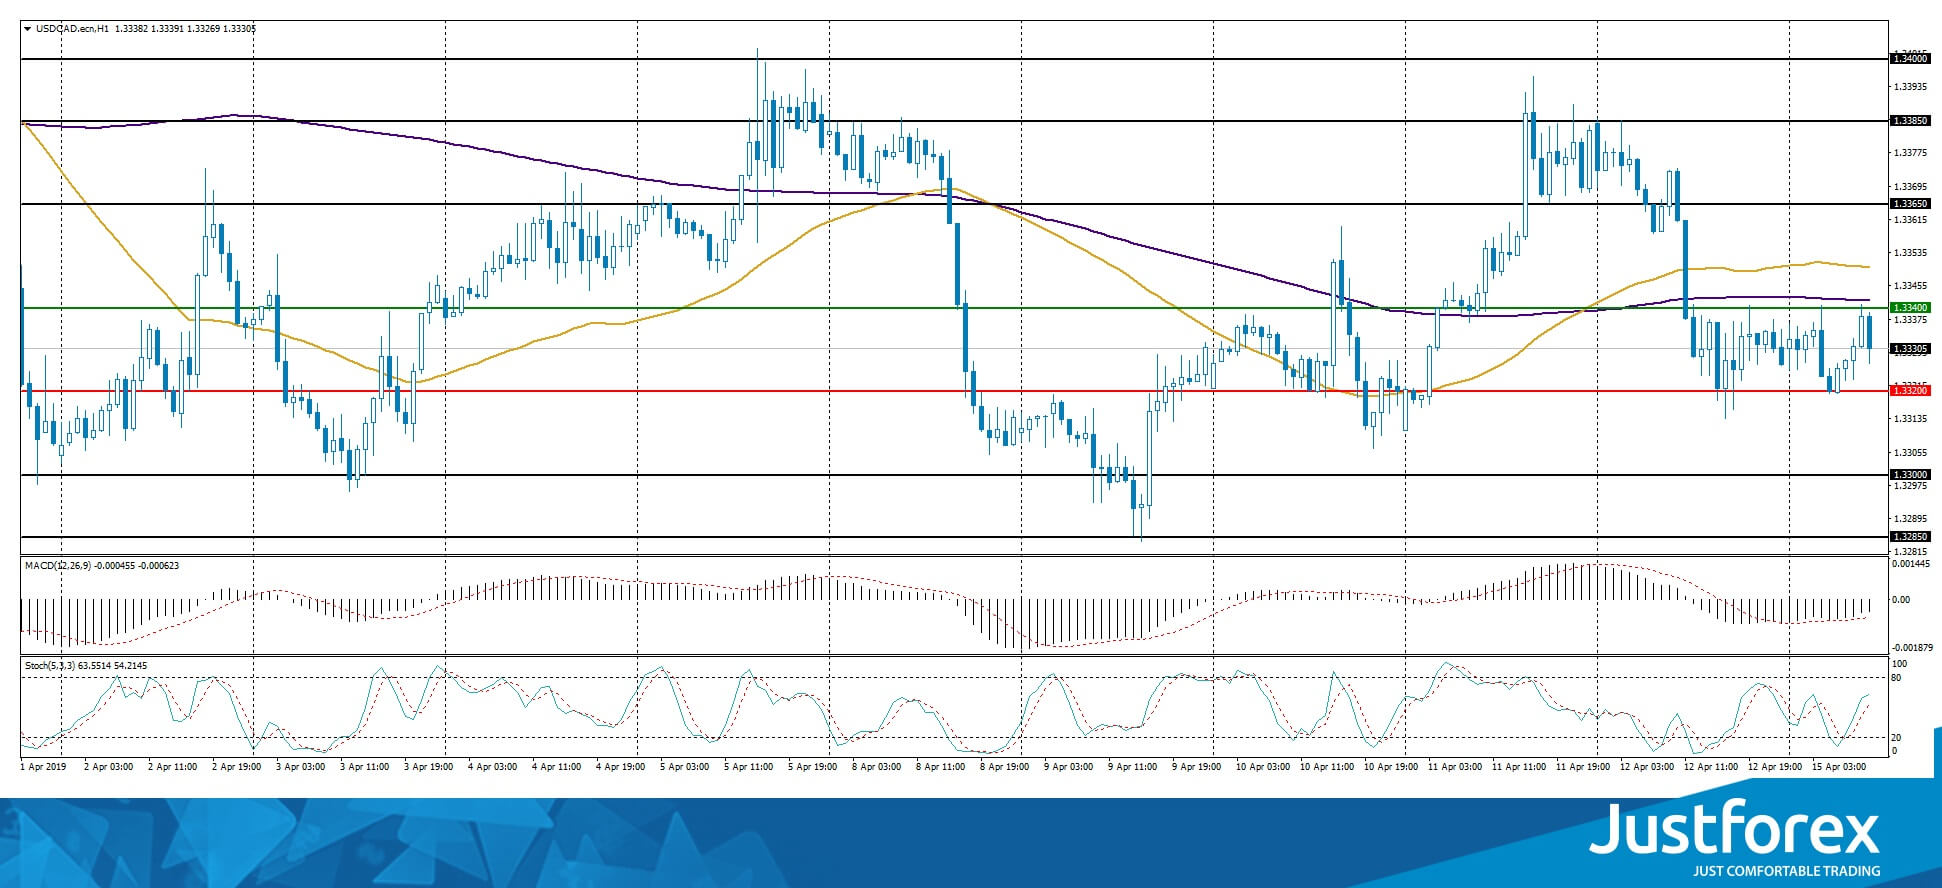
The indicators do not provide precise signals: 50 MA started to cross 200 MA.
The MACD histogram is in the negative zone but above the signal line which gives a weak signal to sell USD/CAD.
The Stochastic Oscillator is in the neutral zone, the %K line is above the %D line which points to the bullish mood.
Trading recommendations
Support levels: 1.33200, 1.33000, 1.32850
Resistance levels: 1.33400, 1.33650, 1.33850
If the price fixes below 1.33200, expect the quotes to fall toward 1.32900-1.32700.
Alternatively, the quotes can grow toward 1.33650-1.33850.
The USD/JPY currency pair
Technical indicators of the currency pair:
Prev Open: 111.640
Open: 111.961
% chg. over the last day: +0.32
Day's range: 111.888 – 112.098
52 wk range: 104.56 – 114.56
USD/JPY stays in a bullish mood. The trading instrument reached the annual maximums. Right now the USD/JPY quotes are consolidating next to 112.000-112.100. 111.800 acts as a mirror suport. The demand for safe assets lowered, a technical correction is possible soon. Keep an eye on the US Treasury bonds' yield and open positions from the key levels.
The Economic News Feed for 15.04.2019 is calm.
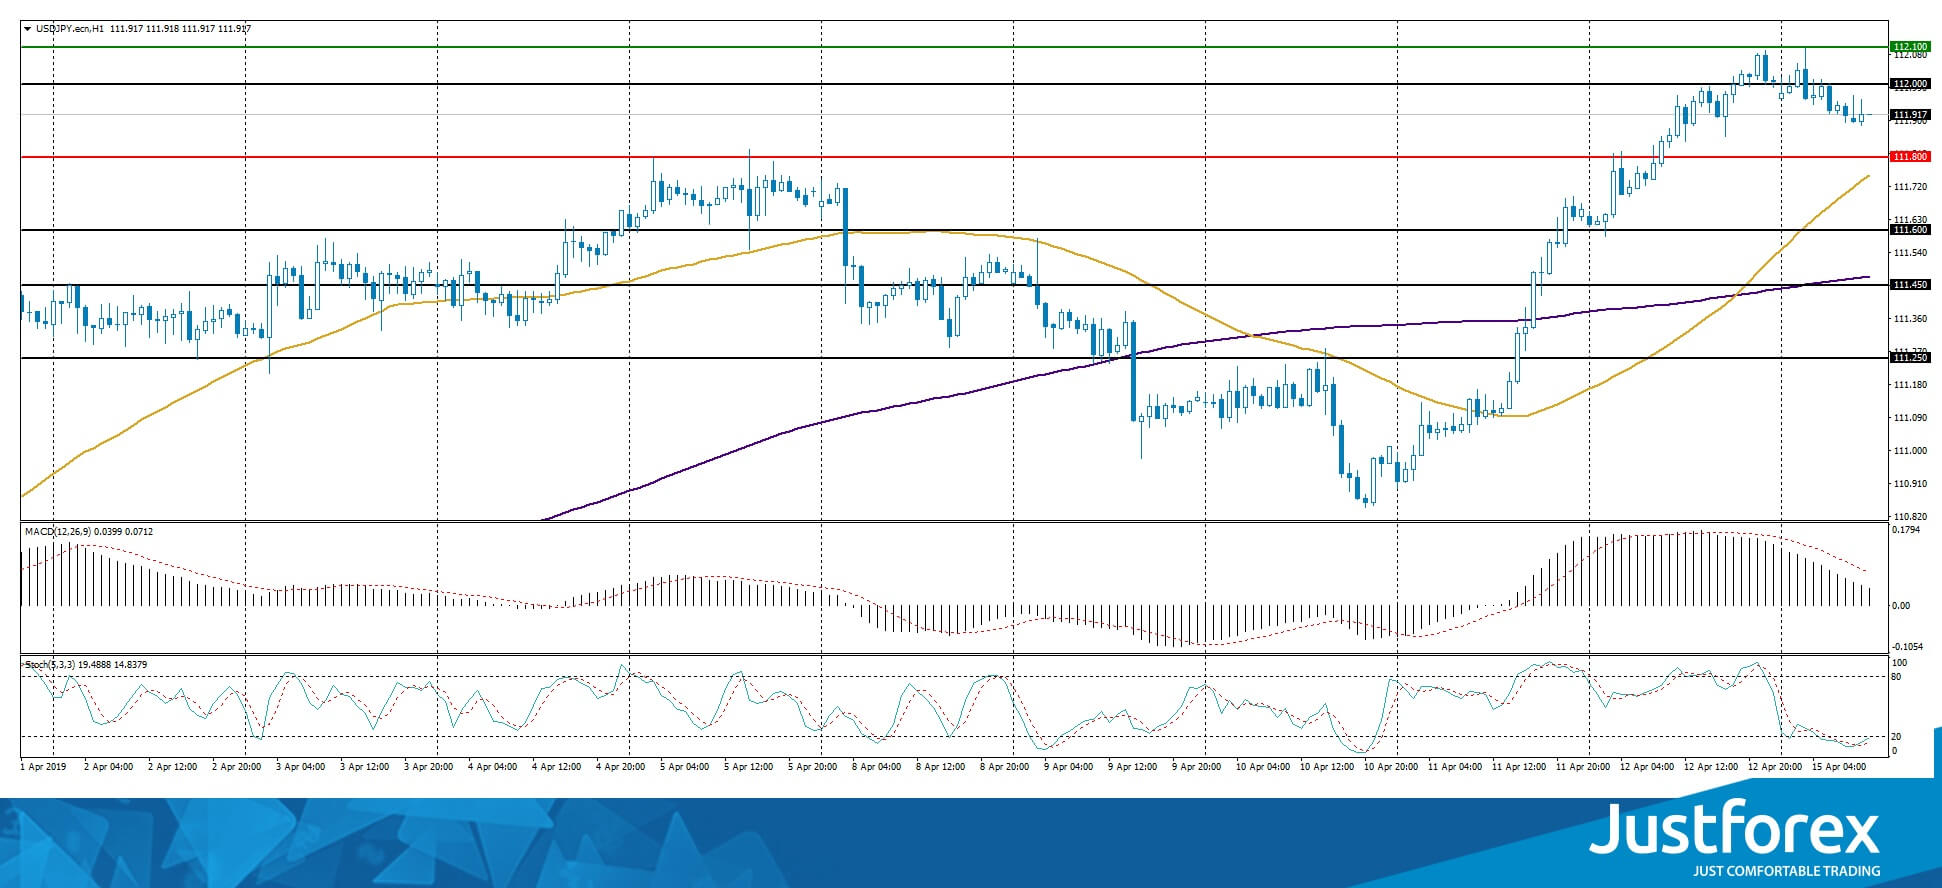
The price fixed above 50 MA and 200 MA which points to the power of the buyers.
The MACD histogram is in the positive zone but below the signal line which gives a weak signal to buy USD/JPY.
The Stochastic Oscillator is in the oversold zone, the %K line is crossing the %D line. There are no signals.
Trading recommendations
Support levels: 111.800, 111.600, 111.450
Resistance levels: 112.000, 112.400, 112.600
If the price fixes above 112.100, expect further growth toward 112.500-112.700.
Alternatively, the quotes can correct toward 111.600-111.450.
EUR/USD Could Breach Short-Term Channel
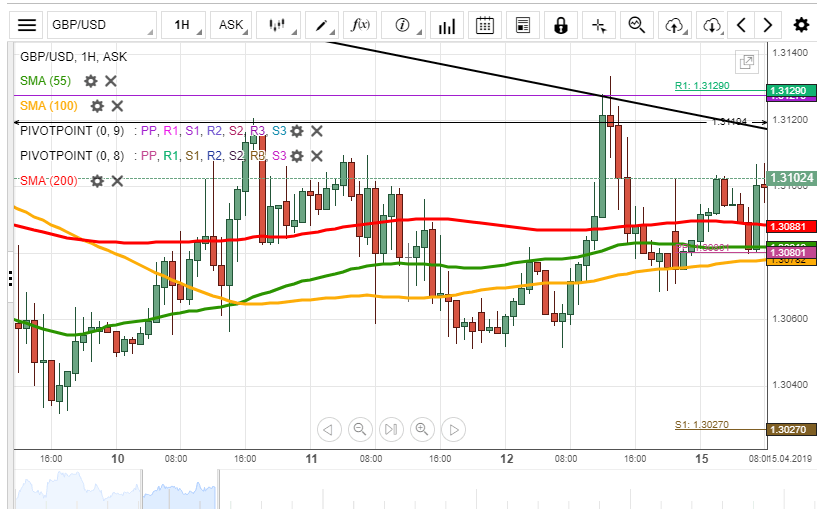
On Friday, the EUR/USD currency pair tried to breach the short-term channel north and reversed south from the upper channel line at 1.1324. On Monday's morning, the pair resumed going up.
It is likely, that the exchange rate re-tests the upper trend boundary in the nearest future. If the given channel does not hold, rate might reach the weekly R1 at 1.1350.
Otherwise, it is expected, that the rate trades sideways between the psychological levels at 1.1300 and 1.3200 respectively.
It is unlikely, that the pair could decline lower than 1.12800 due to the support level formed by the 55– and 100-hour SMAs, as well the weekly and monthly PPs.
GBP/USD Likely To Re-Test Falling Wedge North
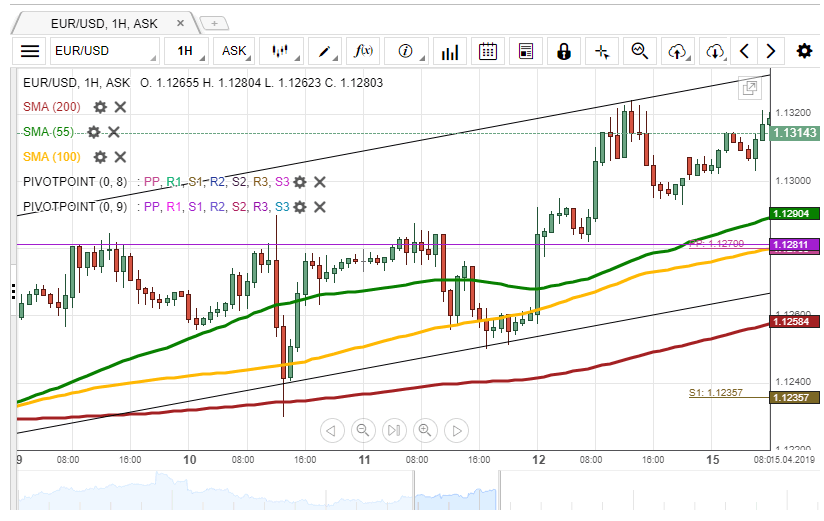
During previous trading session, the GBP/USD exchange rate tested the upper boundary of the falling wedge pattern at 1.3128 and reversed south.
From a technical point of view, it is unlikely that the pair could continue to decline due to the support cluster formed by a combination of the 55-, 100– and 200-hour SMAs, as well the weekly PP in the 1.3078/1.3088 range.
It is expected, that the currency pair re-tests the upper pattern line located in the 1.3100/1.3200 range. However, it is unlikely, that the pair could breach the given pattern due to the resistance level located at the 1.3119 mark.
USD/JPY: Two Scenarios Likely
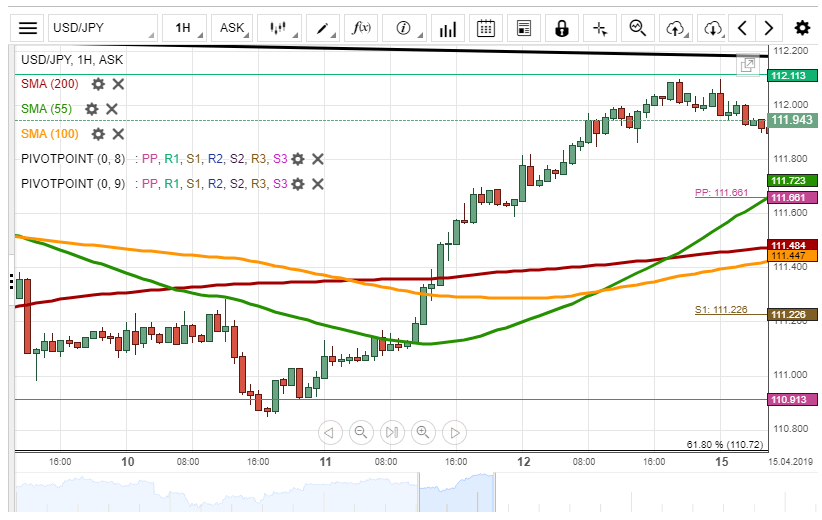
At the end of last week, the USD/JPY currency pair traded sideways around the psychological level at 112.00.
Note, that the pair is trading near the upper boundary of the long-term descending channel at 112.15, thus, theoretically, it is unlikely, that some bullish momentum could prevail in the market.
On the one hand, the exchange rate could trade sideways around the given level, trying to breach the given channel.
On the other hand, the rate could reverse south and step lower to the support level formed by the 55-hour SMA and the weekly PP at 111.66.
XAU/USD Could Continue To Decline
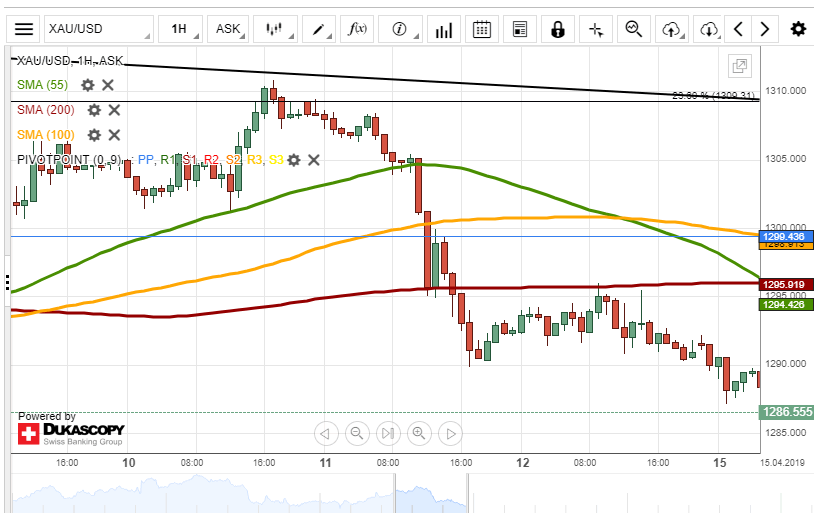
On Friday, the price for gold continued to diminish, surpassing the psychological level at 1,290.00.
Given that the XAU/USD exchange rate is pressured by the 55-, 100– and 200-hour SMAs, it is likely, that some bearish momentum continues to prevail in the market. A possible downside target is the lower boundary of the descending triangle pattern at 1,282.56.
It is the unlikely case, that bulls would prevail in the market in the short run, and the price for gold could jumped higher than 1,295.00 level due to the resistance of 55– and 200-hour moving averages
GBPUSD Testing Weekly Pivot
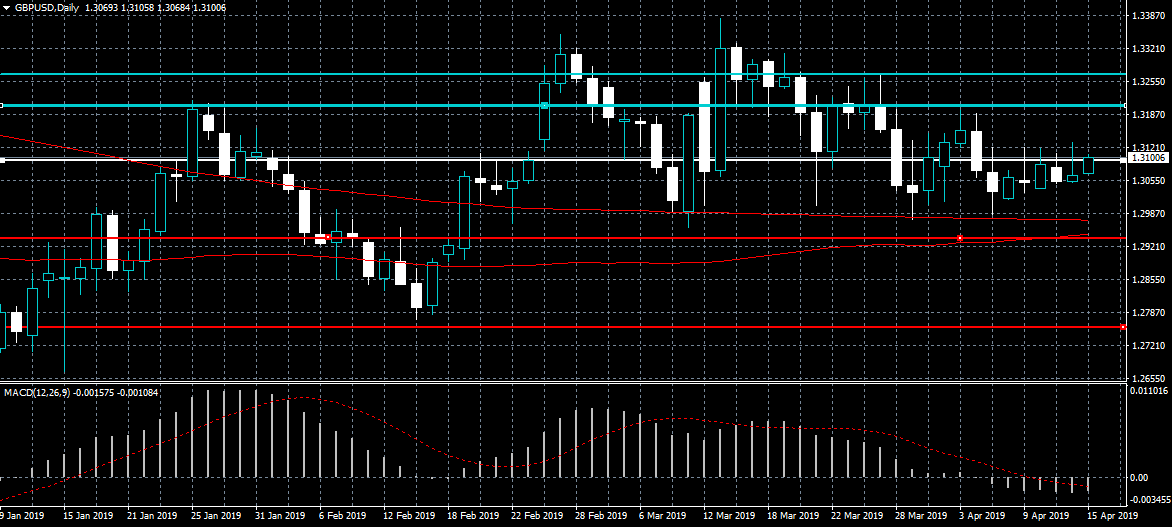
The British pound is testing towards its weekly pivot point against the US dollar as the greenback comes under mild selling pressure in early week trade. Technical indicators across the daily time frame suggest that the GBPUSD pair still remains weak. A further decline towards the 1.2980 support level remains likely if bulls continue to struggle to move price above the 1.3100 resistance level.
The GBPUSD pair is only bullish while trading above the 1.3100 level, key intraday resistance remains at the 1.3125 and 1.3200 levels.
If the GBPUSD pair trades under the 1.3055 level, key intraday support is found at the 1.2980 and 1.2940 levels.
EURUSD Still Bullish Above 1.1290
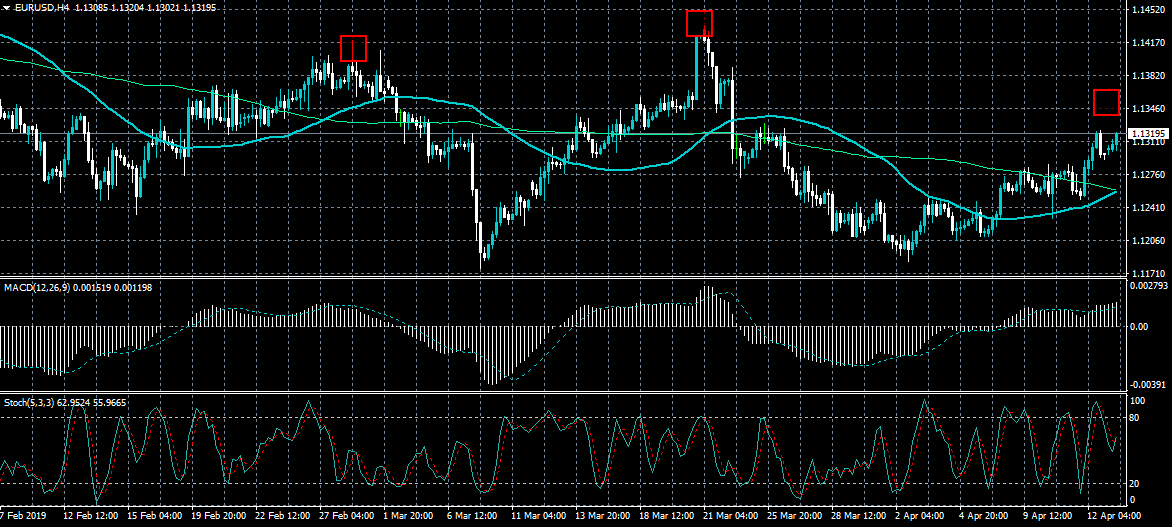
The euro currency has continued to move higher against the US dollar during the European trading session, with bulls now testing towards the pairs former weekly trading high. If the EURUSD pair trades above the 1.1325 level, a further advance towards the 1.1360 level may occur. The daily time frame is also showing that a bearish head and shoulders pattern could form.
The EURUSD pair is strongly bullish while trading above the 1.1290 level, key technical resistance is found at the 1.1325 and 1.1360 levels.
If the EURUSD pair trades below 1.1290 level, key intraday support is found at the 1.1250 and 1.1216 support levels.
AUDJPY Drifts Near 4-Month Peak, Turns Bias To Slightly Bullish
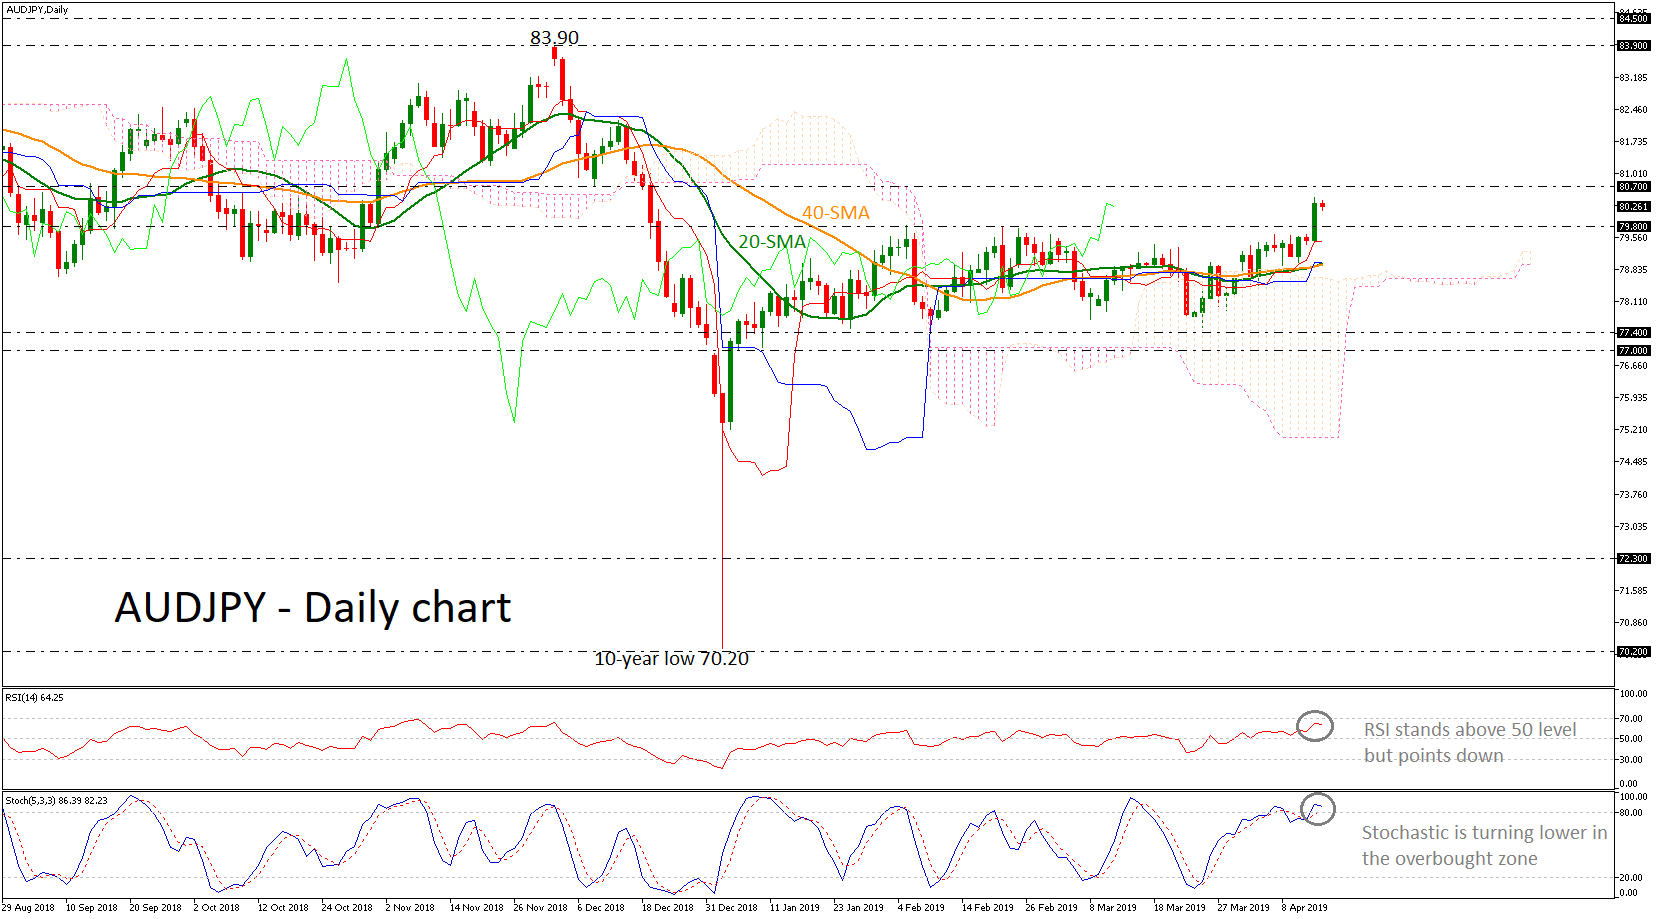
AUDJPY advanced considerably on Friday, jumping above the sideways channel of 77.40 – 79.80 and posting a new four-month high around 80.50. Ichimoku indicators are raising neutral flags as the red Tenkan-sen line is above the blue Kijun-sen line but failed to signal a direction. On the other hand, the RSI and the stochastic are pointing down in the positive area, suggesting bearish correction.
Should prices decline, immediate support could be found around 79.80, an area which has provided as strong resistance in the preceding four months. Then a leg below that level, the pair could meet the 20-and 40-simple moving averages (SMAs) currently at 79.00 in the daily timeframe. A step lower could find support at the 77.00 – 77.40 zone.
However, if the market manages to pick up speed, the 80.70 could offer nearby resistance ahead of the 83.90 hurdle, identified by the peak on December 3.
In the long-term, the outlook remains negative since prices hold below all the long-term moving average lines. But in the short-term view a significant climb above 83.90 could shift the bias to bullish.
Forex Technical Analysis: EUR/USD, USD/JPY, GBP/USD
EUR/USD
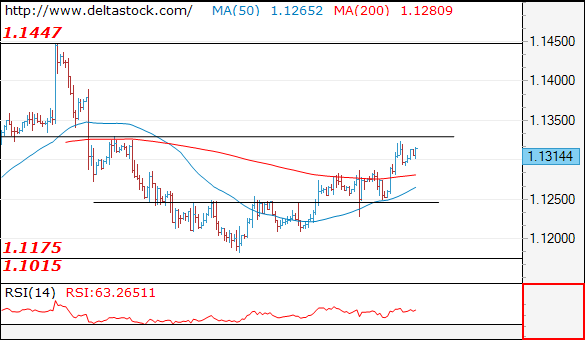
Current level - 1.1314
The initial test of 1.1330 resistance area failed, but the bias remains positive, with an initial support at 1.1280 and crucial low at 1.1250.
| Resistance | Support | ||
| intraday | intraweek | intraday | intraweek |
| 1.1330 | 1.1570 | 1.1250 | 1.1175 |
| 1.1330 | 1.1830 | 1.1175 | 1.0860 |
USD/JPY
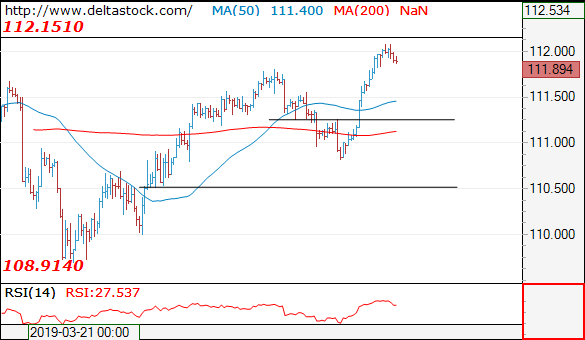
Current level - 111.89
The pair reached 112.15 resistance and I favor a corrective dip to 111.50 zone.
| Resistance | Support | ||
| intraday | intraweek | intraday | intraweek |
| 112.15 | 113.00 | 111.50 | 108.90 |
| 112.15 | 114.50 | 110.50 | 107.40 |
GBP/USD
Current level - 1.3083
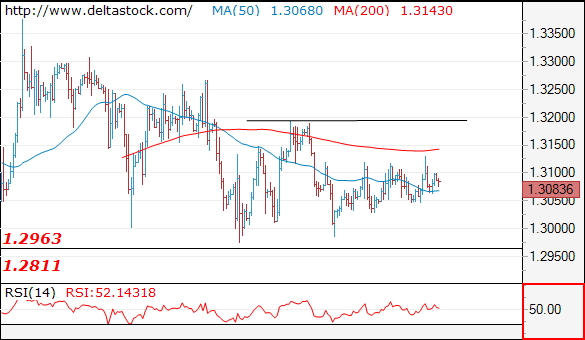
The lack of trend dynamics leaves the intraday outlook neutral. Major support lies at 1.2960 and minor resistance is projected at 1.3200.
| Resistance | Support | ||
| intraday | intraweek | intraday | intraweek |
| 1.3200 | 1.3450 | 1.2960 | 1.2820 |
| 1.3200 | 1.3450 | 1.2960 | 1.2610 |