Sample Category Title
The US Dollar Recovered Some Losses. Geopolitical Events Are Still In The Spotlight
Yesterday, the US dollar strengthened against a basket of major currencies. Positive economic data supported the US currency. Initial jobless claims fell to a 40-year low (196K), while experts expected 211K. The producer price index rose by 0.6% in March instead of the expected growth by 0.3%. The dollar index (#DX) closed yesterday in a positive zone (+0.26%).
Uncertainty concerning Brexit remains. The delay of the UK exit from the EU prevented the "hard" Brexit scenario, which was supposed to happen this Friday. However, this decision did not make investors happy. The European Union does not intend to revise the draft agreement, that means that there is a possibility that Prime Minister Theresa May will not be able to enlist the support of Parliament during these 6 months. So no-deal Brexit is still not excluded.
After continuous disputes, the EU countries agreed to start negotiations with the US on trade terms simplification. EU members intend to give the European Commissioner for Trade, Cecilia Malmstrom, a negotiating mandate to prevent the United States from imposing fines on European-made cars on April 15. It should be recalled that the United States and the European Union agreed to start preparing negotiations on free trade in July 2018.
The "black gold" prices have moved away from annual highs. At the moment, futures for the WTI crude oil are testing the mark of $64.00 per barrel. At 20:00 (GMT+3:00), a report on the US Baker Hughes total rig count will be published.
Market Indicators
- Yesterday, the bearish sentiment was observed in the US stock market: #SPY (-0.03%), #DIA (-0.08%), #QQQ (-0.24%).
- The 10-year US government bonds yield fell slightly. Currently, the indicator is at the level of 2.49-2.50%.
The news feed for 2019.04.12:
- Industrial production in the eurozone at 12:00 (GMT+3:00);
- Export and import price indexes in the US at 15:30 (GMT+3:00);
- Michigan consumer expectations and sentiment at 17:00 (GMT+3:00)
MAS Goes Into Neutral
MAS goes into Neutral
This week FX volatility faded further, credit spread tightened while US stocks headed towards 2900. Major central banks issued warning and IMF reduced outlook. Normalization is now a thing of the past for the G10. Despite clear warning of an economic downturn, markets are placing unconditional belief in policy maker’s ability to avoid crisis. For evidence that slowing global growth is causing concern between central banks, look no further than the Monetary Authority of Singapore (MAS) semi-annual monetary policy announcement. Given the small and open Singaporean economy, it was no surprise that challenging export environment and weak demand for electrics would weigh on outlook. Advance Q1 GDP report indicated the economy grew a modest 1.3% y/y in Q1 2019 from 1.9% in Q4. MAS is projecting a sustained deceleration in growth this year. After 24 months of acceleration and tightening twice (allowing the SGD NEER to appreciate), core inflation forecasts for 2019 was reduced to 1-2% range from 1.5% - 2.5% previously. MAS also reduced the headline inflation 2019 forecast to 0.5-1.5% from 1-2% previously.
In regards to SGD policy band, “ MAS will, therefore, maintain the current rate of appreciation of the SGD NEER policy band. There will be no change to its width and the level at which it is centered. This policy stance is consistent with a modest and gradual appreciation path of the SGD NEER policy band that will ensure medium-term price stability.”
Overall, the MAS has shifted into neutral from a tightening bias. With rising downside risk to growth and inflation and pricing of SGD close to the strong end of the policy band it is hard to see how SGD will further appreciate.
In broader terms, after a wave of global optimism and minor policy normalization, bond markets have now recorded the highest level of sub-zero paper since 2017 totaling $10.6 trillion. Clearly, markets are not functioning correctly and error drift is increasing. While in the short term this suggests risky asset will be in demand, in the longer term a crisis is building.
ZAR strength remains despite major domestic issues
Considering the recent development in USD/ZAR, one has to admit that FX traders remain highly indulgent as to what concerns the South African rand. While both rating agencies S&P and Fitch have been downgrading South African government debt from investment grade to junk last year due to unfavorable budgeting and political turmoil, Moody’s has been the last-standing agency to grant investment grade. Yet a new assessment had investors worried that a downgrade to junk would have consequences on ZAR exchange rates and cause substantial capital outflows. However, none of it occurred since the rating agency postponement of the review maintains the rating Baa3, the lowest investment grade rating.
Despite the rating, it appears that the recent statement made by the agency doesn’t give much room for potential improvement: the South African Reserve Bank stands on its (hawkish) position that it should raise its repurchase rate by 25 basis points by the end of 2019 (currently: 6.75%) – although it’s been revising growth (from 1.70% to 1.30%) while inflation should remain stable (4.80%). Dragging issues relating to power supply shortage amid a massive indebted energy department and upcoming uncertain general elections on 8 May 2019 apparently do not bother investors, who have been favoring a positive risk sentiment and take long ZAR positions following dovish Fed and ECB monetary policies. Furthermore, recent drop of March business confidence for the fifth consecutive month as well as a decline in both month-to-month February mining (-1.50%) and manufacturing production (-1.60%) do not seem to have any impact on the currency.
There is definitely inadequacy considering current circumstances. The postponement of Moody’s rating decision from end of March to November boosted the rand, even though South African fragile economy and a forthcoming change in credit rating should have a negative impact on the ZAR. We therefore suggest investors to remain highly cautious.
EUR/USD – Euro Jumps To 3-Week High As German Inflation Remains Steady
EUR/USD has reversed directions in the Friday session, after slight losses in the Thursday session. Currently, the pair is trading at 1.1311, up 0.50% on the day. On the release front, there are no major German or eurozone events. The German Wholesale Price Index remained steady in March, with a gain of 0.3%. Eurozone industrial production declined by 0.2%, above the estimate of -0.5%. In the U.S., UoM consumer sentiment is expected to improve to 98.1. As well, the Treasury department releases its semi-annual currency report.
U.S. inflation numbers showed improvement in March. CPI climbed to 0.4%, its highest gain since January 2018. The producers price index also looked strong, climbing 0.6%, a 5-month high. Inflation remains well below the Federal Reserve target of 2.0%, but stronger inflation numbers will bolster the case of Fed officials who favor raising rates in 2019 if the economic outlook improves. The Fed minutes from the March meeting left the door open to further rate hikes this year, but current market pricing suggests no hikes until 2020, and some analysts are expecting a cut in rates later this year.
There were no surprises from the ECB policy meeting, and the euro responded with limited movement. The bank held the minimum bid rate at 0.00%, where it has been pegged since 2016. Investors were more interested in Mario Draghi’s comments after the rate decision. Draghi acknowledged that eurozone economic data remains weak, particularly in the manufacturing sector. The economic outlook remains weak, with Draghi saying that “slower growth momentum is expected to extend into the current year”. At the same time, Draghi said that the likelihood of a recession remains low. On the inflation front, Draghi stated that interest rates will remain at current levels at least until the end of 2019 and possibly later.
Markets Mixed Ahead Of Earnings, Dollar Searches For Fresh Catalyst
Stocks in Asia were mostly mixed while European markets opened slightly lower on Friday as investors evaluated China's latest trade figures.
Although China's exports rebounded in March, rising over 14.0% year-on-year, imports disappointed by shrinking 7.6% - marking a fourth consecutive month of decline.
With the trade figures illustrating a mixed picture of the second largest economy in the world, investors are likely to adopt a guarded approach ahead offirst quarter earnings releases from two of the biggest banks in the United States.Investors may get a glimpse on how the fading impacts of tax cuts and the Federal Reserve's cautious shift on interest rates have impacted JP Morgan and Wells Fargo. Should earnings from both banks disappoint, risk sentiment for global equities may take a hit.
Dollar Searches for new catalyst
The Dollar Index has surrendered much of its gains and is now trading below the 97 mark, even as the latest US Producers Price Index exceeded market expectations, while jobless claims surprisingly fell to their lowest levels since 1969.
Coupled with the March US inflation data released earlier this week, the data underscores the central bank's “patience” on US interest rates, and this may remain unchanged for the rest of 2019.
Markets have now dialled back expectations of a US rate cut by December to just below 50 percent, from above 57 percent earlier this week. With such odds being priced into the Greenback, any data or event that tilts the balance of risks to either side could influence the Dollar's direction, although which is the way forward remains uncertain for the time being.
Gold steadies after biggest drop in twoweeks
Meanwhile, markets are pushing the boundaries on risk sentiment as Gold fell by over 1 percent on Thursday before bouncing off the $1,290 mark. Although the IMF's cut to its 2019 global growth forecast was a downer, investors are hoping that a not-too-distant US-China trade deal and a stabilizing Chinese economy may weaken headwinds currently felt by the global economy. However, should the outlook take a turn for the worse, that could jolt risk-off sentiment and rally support for the safe haven assets, including Bullion.
Oil set to post longest winning streak since 2016
Even as WTI futures have fallen below $64/bbl at the time of writing, Oil prices remain on course for its longest run of weekly gains since 2016.
The conflict in Libya and US sanctions on Venezuela and Iran are constraining Oil supplies, even as OPEC+ producers press on with output cuts through June. However, uncertainties on the demand side risk derailing attempts by OPEC+ to rebalance, as the International Energy Agency cautioned in its latest monthly report that it could lower global demand forecasts. Should global growth weaken further, that may result in Oil prices unravelling some of its year-to-date gains.
How Space Helps Stocks
Today we consider the stocks of three companies: Boeing, Tesla and Amazon.
In all cases, proximity to space improves the public image of companies, including for the investors, becoming the “last chance saloon” in difficult times. Boeing tests software updates, while an error could be a cause for two airplanes crashes in the previous six months in Indonesia and Ethiopia. The news helped the company to find support after a decline to $365, which is 14% below the levels preceding the March airplane crash.
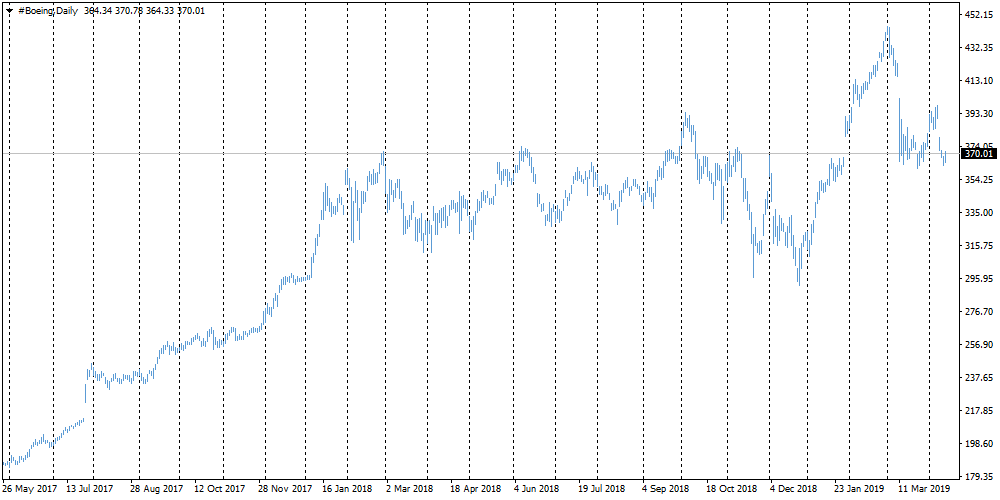
A decrease of 13% can be considered as a relatively modest reaction of investors against the background of almost total suspension of the use of 737 Max - the most popular model from the company. Investors remain confident in the viability of the company because of the stable and large contracts with NASA, providing a good cash safety cushion. Moreover, the administration of the President of the United States has been taking retaliatory steps recently, attacking its key competitor - Airbus. The soft power of the United States helps the company business interests, despite a series of setbacks.
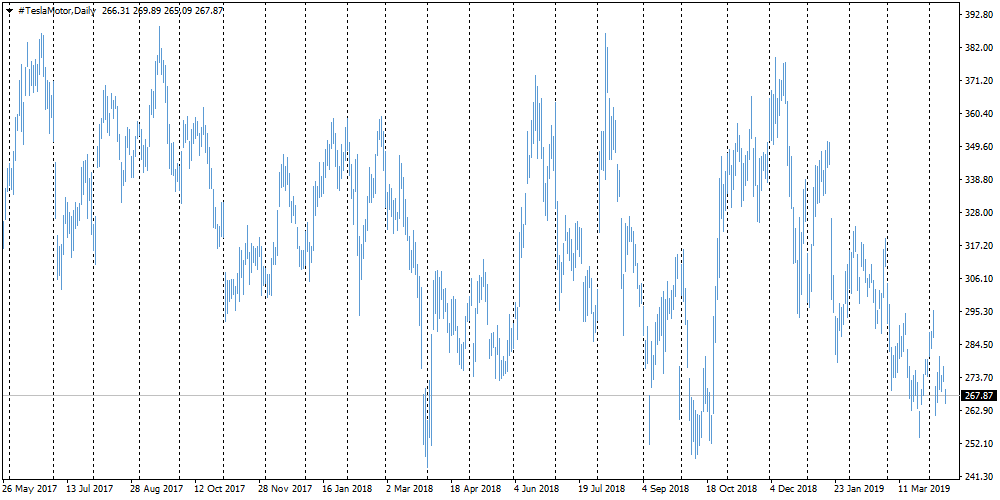
The Tesla prices were regularly supported by the news about the successful launch of the SpaceX ships. In January, the stocks of the electric vehicle manufacturer turned to growth and added 15% in the following days on the background of strengthened confidence in the management genius of Elon Musk and his ability to make technological breakthroughs. But, apparently, investors now need more good news from SpaceX, as Tesla stocks remain part of a broader trend to decline due to the company's problems with mass production adjustment. Like Roskosmos, Elon Musk's companies are faced with the fact that inventing the breakthrough idea and implementing it - these are completely different things that require different competencies. And it seems that investors in Tesla stocks began to separate these competencies from each other. However, it is possible that the temporary spikes of Tesla stocks on the news about SpaceX will persist in the foreseeable future.
It is possible that the ambitions of Amazon founder Jeff Bezos, who also founded Blue Space, could have been dictated by the desire to inspire investors. So far, he's doing well. Amazon's capitalization exceeded a trillion dollars, making Bezos the richest man on the planet. However, in the last letter for investors, they marked a slowdown in sales of goods, from which the company's business began. But it seems that it is becoming more crowded on Earth for Amazon. The company gradually switched to the "cloud": cloud storage and computing power businesses bring the greatest profit. But Bezos aims higher. The launch of the New Glenn rocket is already scheduled for 2020. As in the case of Tesla, the good news from this front is able to create a positive impetus for stocks and, possibly, to keep them from declining, as is the case with Tesla and Boeing. 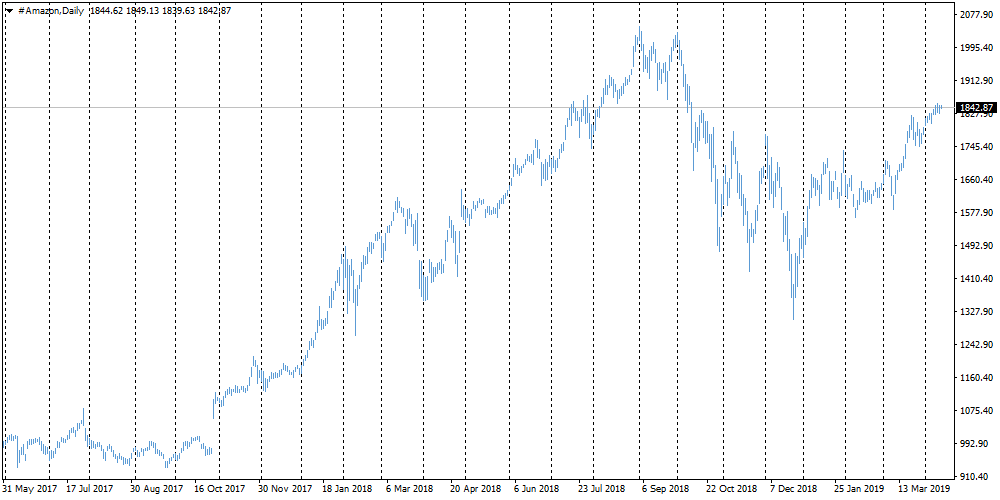
BTCUSD Dives Beneath SMAs, But Finds Support At 23.6% Fibonacci
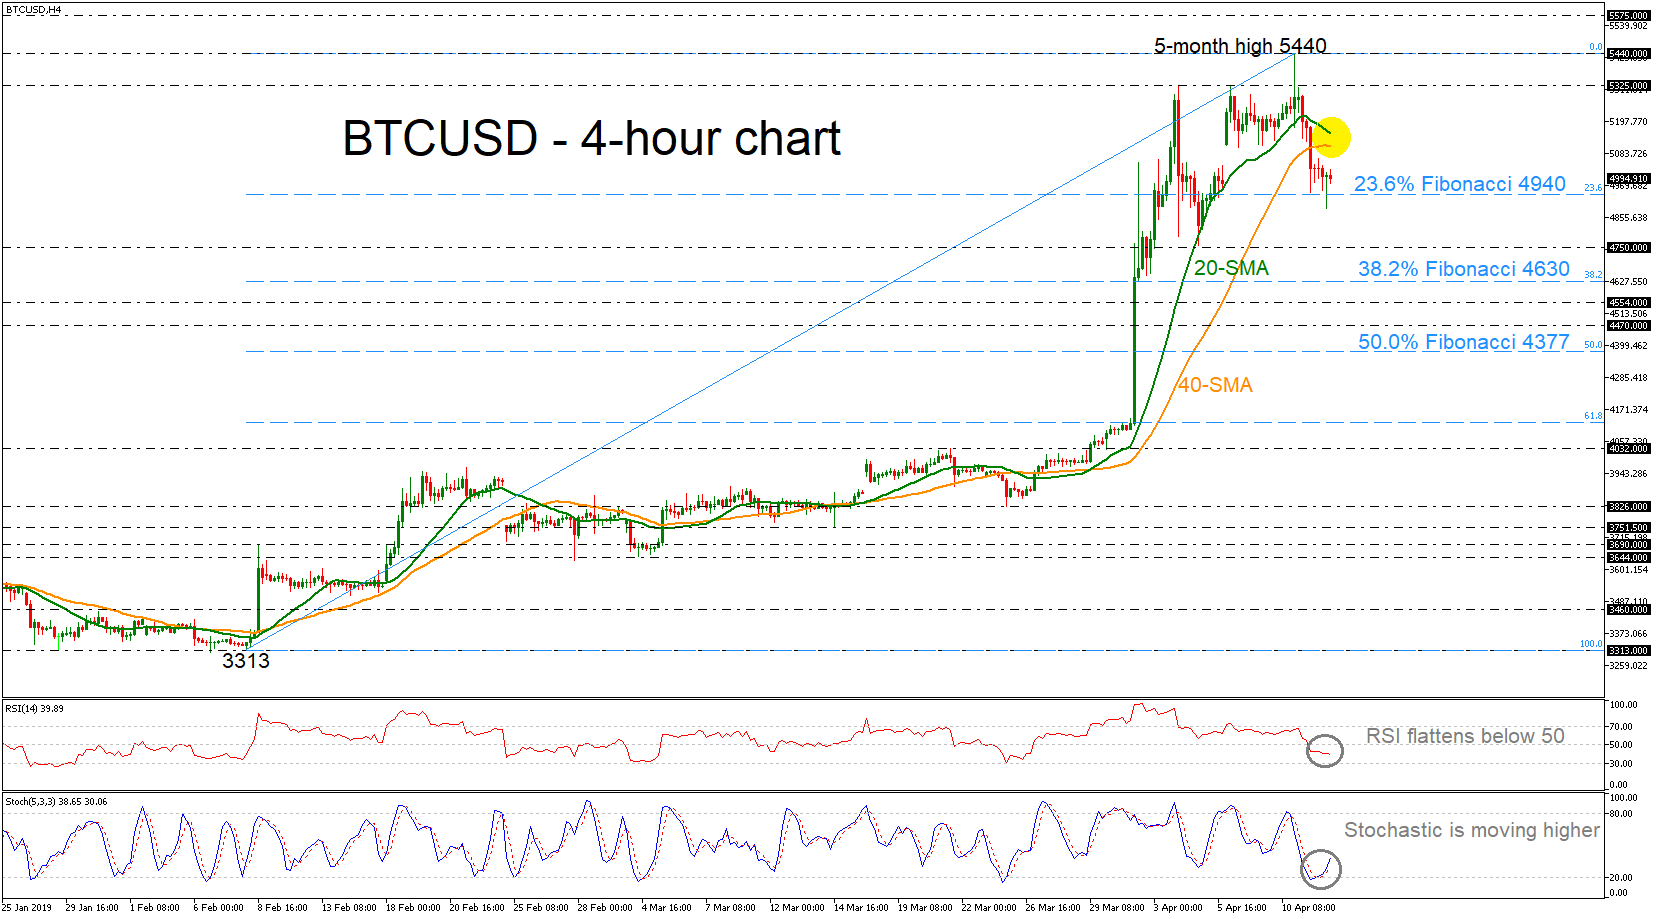
BTCUSD returned near the 23.6% Fibonacci retracement level of the upleg from 3313 to 5440 around 4940 but failed to drop below it over the last few sessions. The price found strong resistance near the five-month high of 5440, slipping below the 20- and 40-simple moving averages (SMAs), however, the technical indicators suggest that bearish correction may came to an end. The stochastic is edging higher after the dive in oversold zone, while the RSI is flattening in the negative zone.
In case of an upside run once again, immediate resistance would come from the 40- and then the 20-SMA currently at 5112 and 5155 respectively, ahead of the 5325 resistance, identified by the peaks on April 8. More gains could drive bitcoin to challenge 5440.
On the flipside, if bitcoin retreats below the 23.6% Fibonacci, support would be faced near 4750, and then a touch of the 38.2% Fibonacci region of 4630 is possible.
Overall, BTCUSD created a strong upward movement after a long time before slipping lower but indicators suggest a possible positive bias again.
USD Strengthens On Strong Financial Data
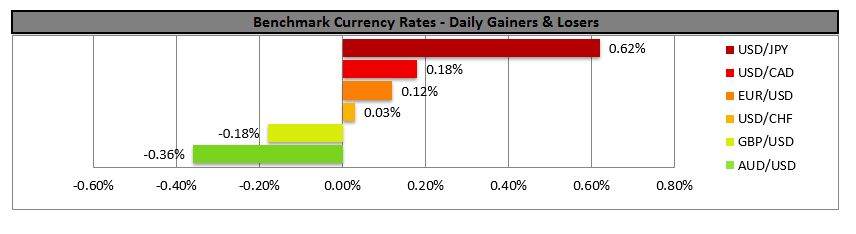
The USD strengthened against a number of its counterparts yesterday, as it was supported by the release of strong US financial data. As per analysts the strong inflation and labour data released yesterday soothed concerns about the US economy, supporting the USD. It should be noted that yesterday’s inflation data, send out a bullish signal for the USD, contradicting the mixed signals sent on Wednesday by the US inflation rates. Analysts point out that it remains to be seen if the dollar can sustain its bounce and the prospects of a rate cut by the Fed until year’s end may have diminished, yet the prospects of a rate hike are still to be seen. The advance of the USD was also supported by a subsequent rise in US treasury yields. We expect the USD to remain data driven for the near term, yet at the same time any statements of Fed officials will probably be scrutinized by the market for any further signals. USD/JPY rose yesterday, breaking the 111.40 (S1) resistance line (now turned to support). The par could prove sensitive to today’s financial releases, however should optimism continue to strengthen the greenback, we could see the pair continuing its rise. Should the bulls maintain control over the pair’s direction, we could see it breaking the 112.00 (R1) resistance line and aim for the 112.50 (R2) resistance level. On the flip side, should the bears take over, we could see the pair breaking the 111.40 (S1) support line and aim for the 110.90 (S2).
Oil prices remain stable despite OPEC led production cuts.
Oil prices remained rather stable yesterday and during today’s Asian session being pressured from recent oil stock surpluses in the US oil market on the one hand and OPEC supply cuts on the other. US sanctions on petroleum exporters Iran and Venezuela seem also to be pushing the bulls of the oil market. Also it should be mentioned that the strains in Libya’s civil war adds further nervousness in the supply side of oil. Analysts point out that rallies of oil prices triggered from geopolitical issues could shoot oil prices well above current levels. On the demand side, growth in oil consumption still originates from Asia and growth in areas such as China and India are seen as critical. We see the case for oil prices to continue to rise, however there may be some instability in the near term, as oil prices seem to be at a crossroad. WTI dropped a bit, yet overall the movement could be characterized as sideways, testing the 63.80 (R1) support line (now turned to resistance). We maintain a bullish outlook for the pair, as technically the upward trendline remains intact. Should the commodity’s long positions come under the market’s favor, we could see WTI prices breaking above the 63.80 (R1) resistance line and aim for the 65.30 (R2) resistance level. On the other hand, should WTI prices, come under the selling interest of the market, we could see WTI prices dropping and aiming if not breaking the 62.00 (S1) support line and continue to threaten the prementioned upward trendline.
Other economic highlights, today and early tomorrow
In today’s European session, we get China’s trading data for March and Eurozone’s industrial production growth rate for February. In the American session we get form the US the preliminary University of Michigan consumer sentiment indicator for April and the Baker Hughes oil rig count.
USD/JPY H4
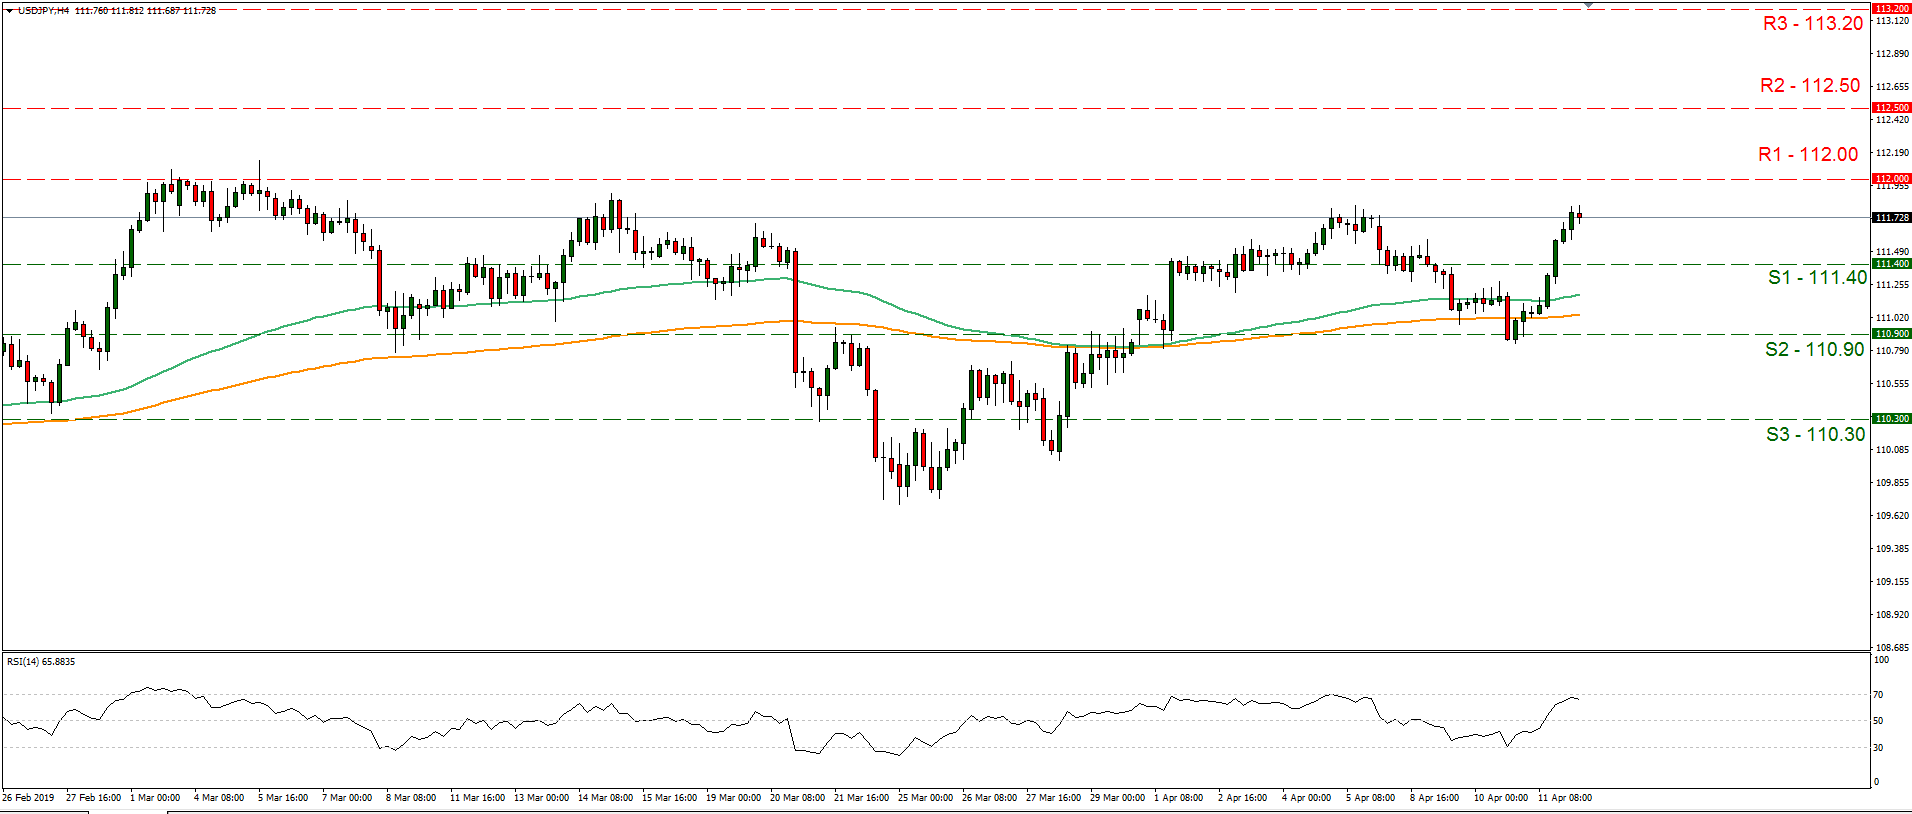
Support: 111.40 (S1), 110.90 (S2), 110.30 (S3)
Resistance: 112.00 (R1), 112.50 (R2), 113.20 (R3)
WTI H4
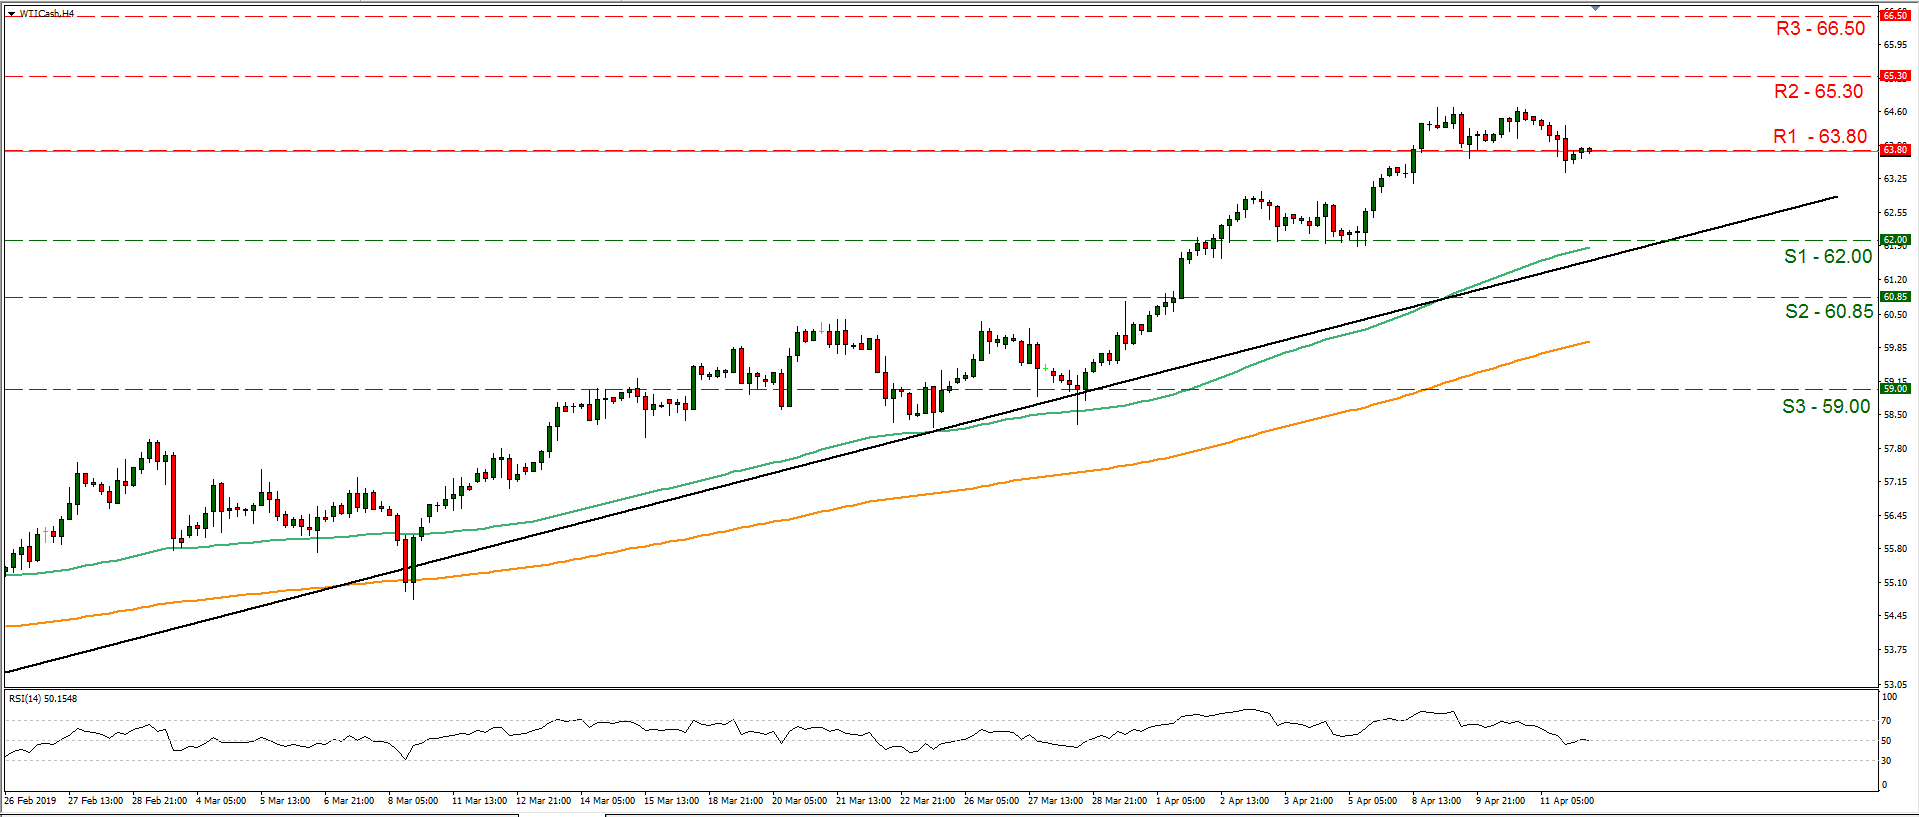
Support: 62.00 (S1), 60.85 (S2), 59.00 (S3)
Resistance: 63.80 (R1), 65.30 (R2), 66.50 (R3)
EUR/USD Reached Weekly R2
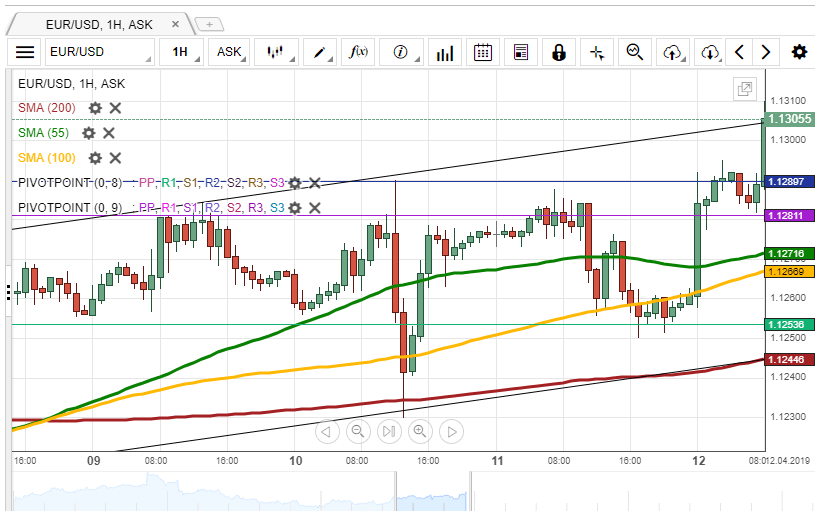
During Thursday's trading session, the Euro declined to the support level formed by the weekly R1 at 1.1254. During today's morning, the EUR/USD exchange rate reversed north towards the resistance level—the weekly R2 at 1.1290.
If the given resistance does not hold, it is likely, that the pair continues to go upwards and reaches the upper boundary of the short-term channel located circa 1.3130.
Otherwise, it is expected, that the currency pair trades sideways between the given resistance level and the 100-hour SMA, currently located at the 1.1266 mark.
China import from US dropped massive -31.8% in Q1, healthy trade growth with EU
Latest trade data from China showed that total trade between US and China shrank -15.4% in Q1, comparing with last year, as result of trade war. In particular, imports from US dropped a massive -31.8% yoy in the quarter. On the other hand, imports from Canada jumped 25.9% yoy and imports from Brazil surged 23.8% yoy. Overall trade growth with EU remained healthy.
China trade surplus widened to USD 32.6B in March, well above expectation of USD 8.1B. Exports jumped 14.2% yoy in USD 198.7B, well above expectation of 7.7% yoy. Imports, however, dropped -7.6% yoy to USD 166.0B, much weaker than expectation of -0.1% yoy. Cumulative from January to March, expects rose 1.4% yoy to USD 551.8B. Imports dropped -4.8% yoy USD 475.4B. Trade surplus was at USD 76.3B.
From January to March cumulative, in USD term, with EU:
- Total trade rose 5.9% yoy to USD 162.6B
- Exports to EU rose 8.8% yoy to USD 97.8B.
- Imports from EU rose 1.8% yoy to USD 64.8B.
- Trade surplus was at USD 33.0B.
With US:
- Total trade dropped -15.4% to USD 119.6B.
- Exports to US dropped -8.5% to USD 91.1B.
- Imports from USD dropped -31.8% to USD 28.5B.
- Trade surplus was at USD 62.6B
With AU
- Total trade rose 5.7% to USD 37.9B.
- Exports to AU rose 9.7% to USD 11.0B.
- Imports from AU rose 4.1% to USD 26.9B.
- Trade deficit was at USD 15.9.
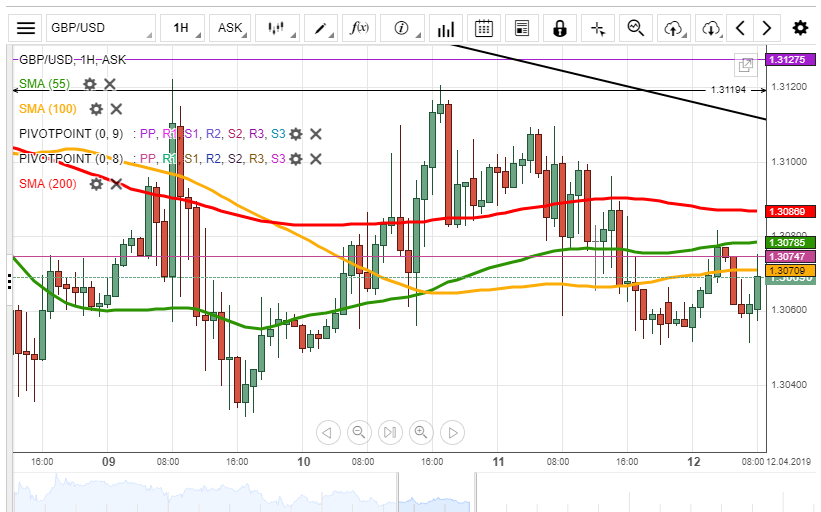
GBP/USD Pressured By 55-, 100– And 200-Hour SMAs
Yesterday, the GBP/USD currency pair stepped lower to the psychological level at the 1.3060 mark.
From a technical perspective, it is unlikely, that the pair could resume rising due to the resistance cluster formed by a combination of the 55-, 100– and 200-hour SMAs, as well the weekly PP in the 1.3071/1.3087 range.
It is likely, that the exchange rate continues trading down and surpasses the psychological level at the 1.3040 mark.
However, if the given resistance does not hold, the rate could reach the upper boundary of the falling wedge pattern located circa 1.3100.