Sample Category Title
EUR/AUD Daily Outlook
Daily Pivots: (S1) 1.5737; (P) 1.5778; (R1) 1.5841; More...
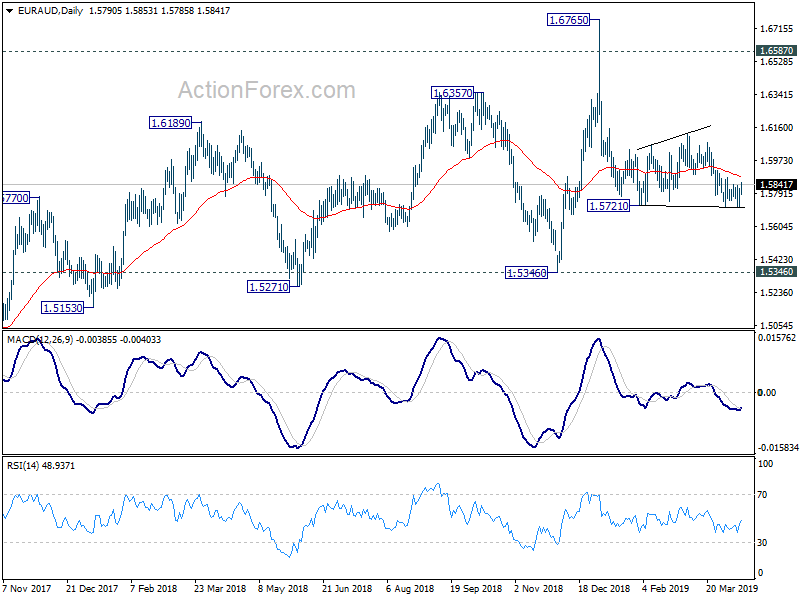
Intraday bias in EUR/AUD remains neutral as consolidation from 1.5271 is extending. Stronger rebound could be seen. But upside should be limited by 1.6122 resistance to bring fall resumption. On the downside, sustained break of 1.5721 will resume the decline from 1.6765 to 1.5346 key support next.
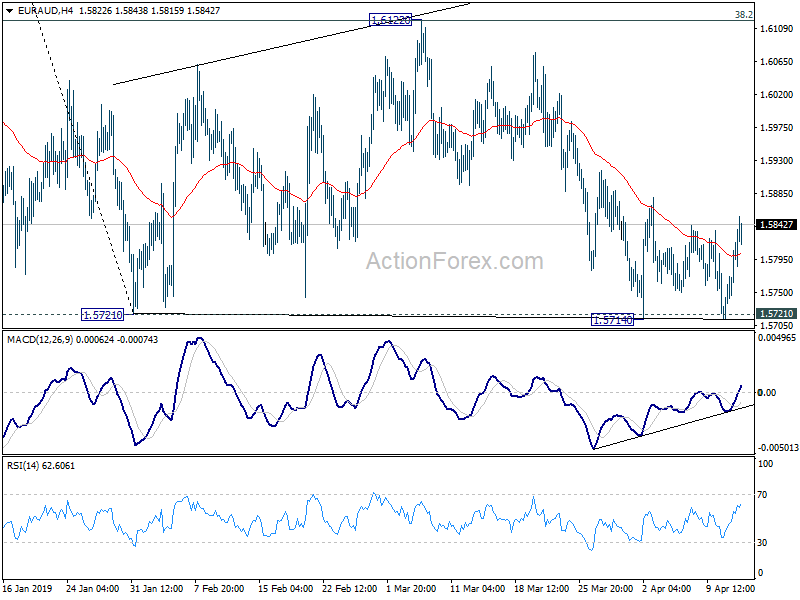
In the bigger picture, as long as 1.5346 support holds, outlook will still remain bullish. Uptrend from 1.1602 (2012 low) is expected to resume sooner or later. Break of 1.6765 will target 61.8% retracement of 2.1127 (2008 high) to 1.1602 at 1.7488 next. However, firm break of 1.5346 key support will indicate trend reversal, with bearish divergence condition in weekly MACD, and turn outlook bearish.
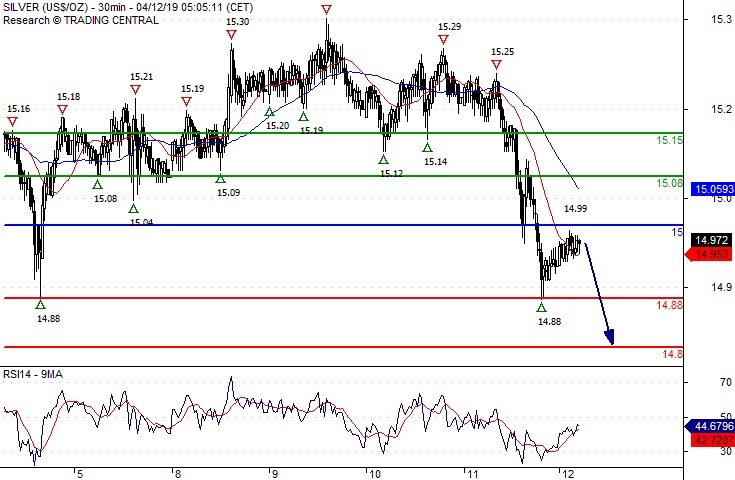
Silver Spot 14.8000 Expected
Pivot (invalidation): 15.0000
Our preference Short positions below 15.0000 with targets at 14.8800 & 14.8000 in extension.
Alternative scenario Above 15.0000 look for further upside with 15.0800 & 15.1500 as targets.
Comment Technically the RSI is below its neutrality area at 50.
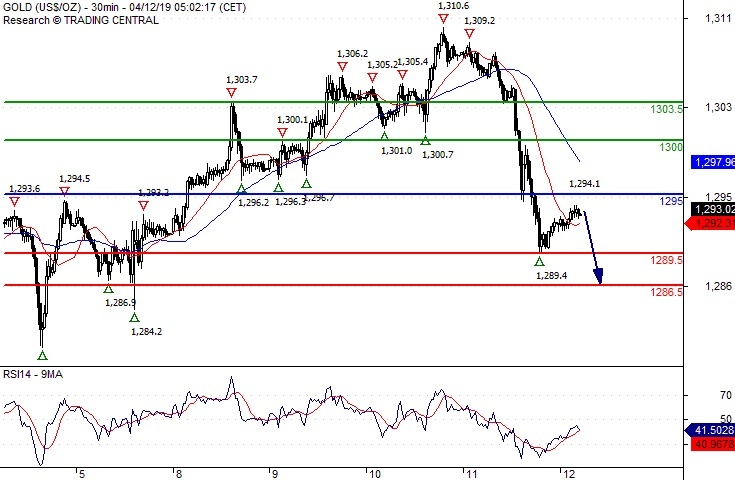
Gold Spot Under Pressure
Pivot (invalidation): 1295.00
Our preference Short positions below 1295.00 with targets at 1289.50 & 1286.50 in extension.
Alternative scenario Above 1295.00 look for further upside with 1300.00 & 1303.50 as targets.
Comment The RSI is mixed to bearish.
EUR/USD Daily Outlook
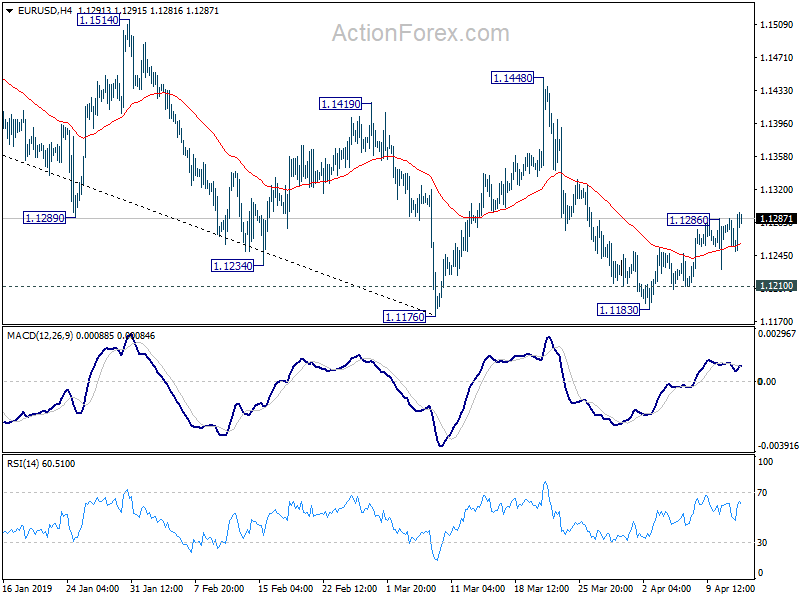
Daily Pivots: (S1) 1.1241; (P) 1.1264; (R1) 1.1278; More.....
EUR/USD's rebound from 1.1183 resumes by taking out 1.1286. Intraday bias is back on the upside for 1.1448 resistance. For now, we'd expect strong resistance between 1.1448/1569 to limit upside. On the downside, below 1.1210 minor support will turn bias to the downside. Decisive break of 1.1176 will resume the down trend from 1.2555.
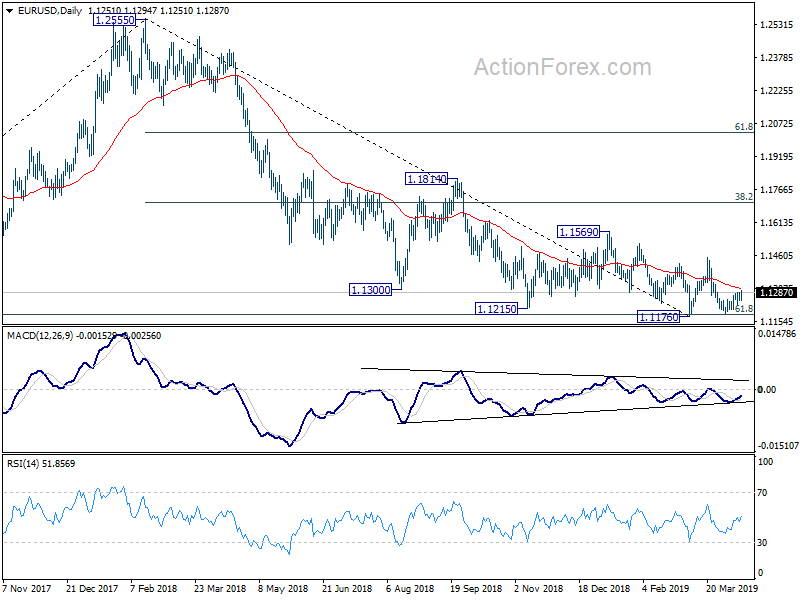
In the bigger picture, medium term weakness was revived as the weak rebound from 1.1176 was rejected well below 55 week EMA and failed to sustain above 55 day EMA. Focus is back on 1.1176 low, with 61.8% retracement of 1.0339 (2016 low) to 1.2555 (2018 high) at 1.1186. Decisive break there will resume whole down trend from 1.2555. Such decline target 1.0339 low next. On the upside, firm break of 1.1569 resistance is needed to be the first sign of medium term bottoming. Otherwise, downside breakout will be in favor.
ETHUSD Bearish Below $160.00
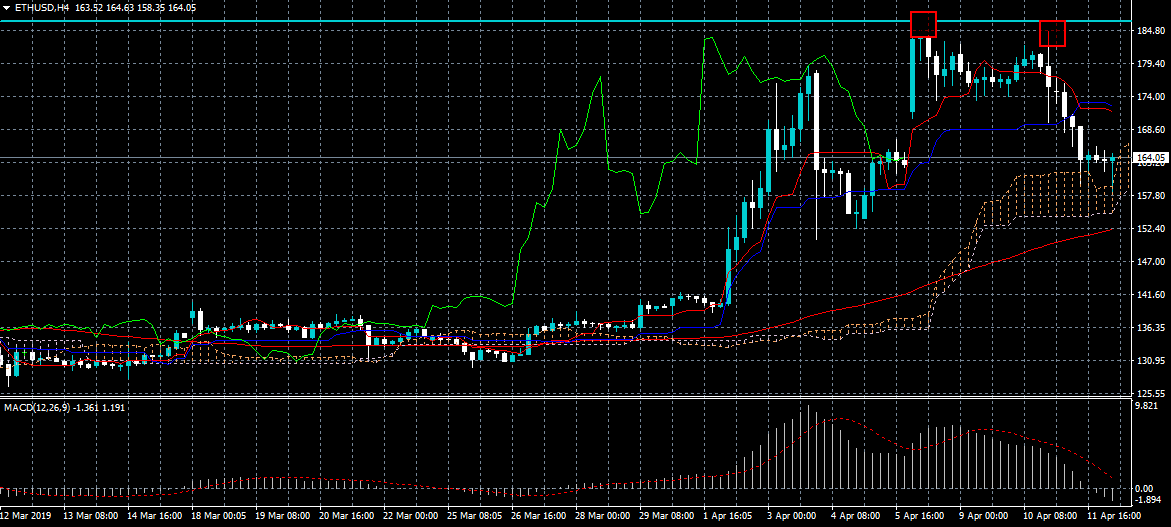
Ethereum is under selling pressure on Friday after bulls failed to move the second largest cryptocurrency above the $185.00 resistance level. A bearish double-top pattern has formed on the four-hour time frame, which is adding to intraday technical selling pressure on the ETHUSD pair. The ETHUSD pair could start to slip towards its 200-day moving average if price falls below the $160.00 level.
If the ETHUSD pair trade below the $160.00 level, key support is found at the $152.00 and $140.00 levels.
If ETHUSD bulls hold price above the $160.00 level, key resistance is found at the $185.00 and $200.00 levels.
EURUSD Testing Breakout Resistance
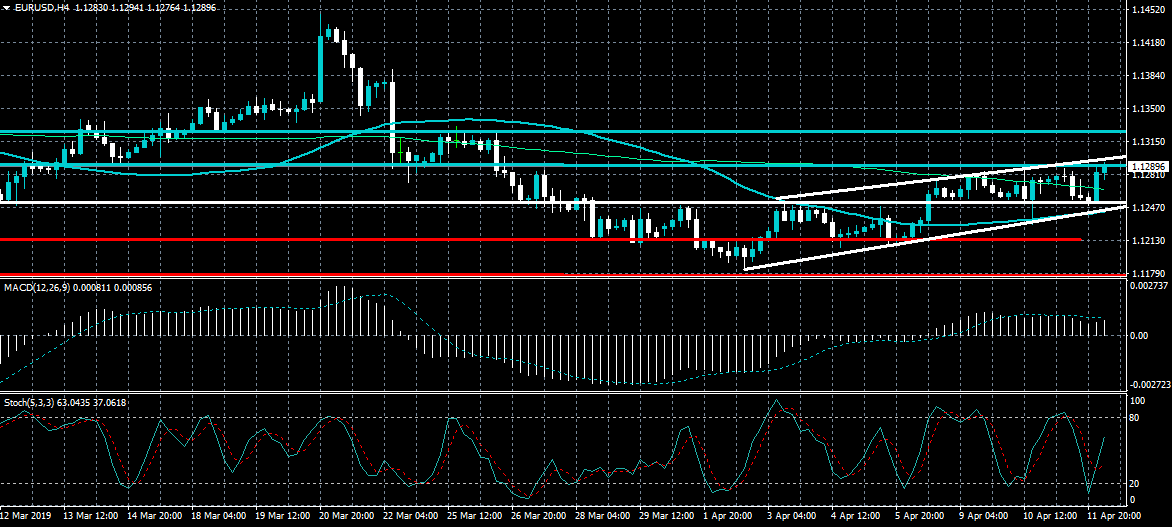
The euro currency has recovered higher against the US dollar in early Friday trading as buyers move price back towards breakout resistance. The EURUSD pair has a bullish intraday outlook while trading above the 1.1250 level, although the 1.1290 level remains critical weekly resistance. If buyers lift the EURUSD pair above the 1.1290 level further short-term buying towards the 1.1330 level appears possible.
The EURUSD pair is only bullish while trading above the 1.1250 level, key technical resistance is found at the 1.1290 and 1.1330 levels.
If the EURUSD pair trades below 1.1230 level, key intraday support is found at the 1.1216 and 1.1170 resistance levels.
USDJPY Bulls Return
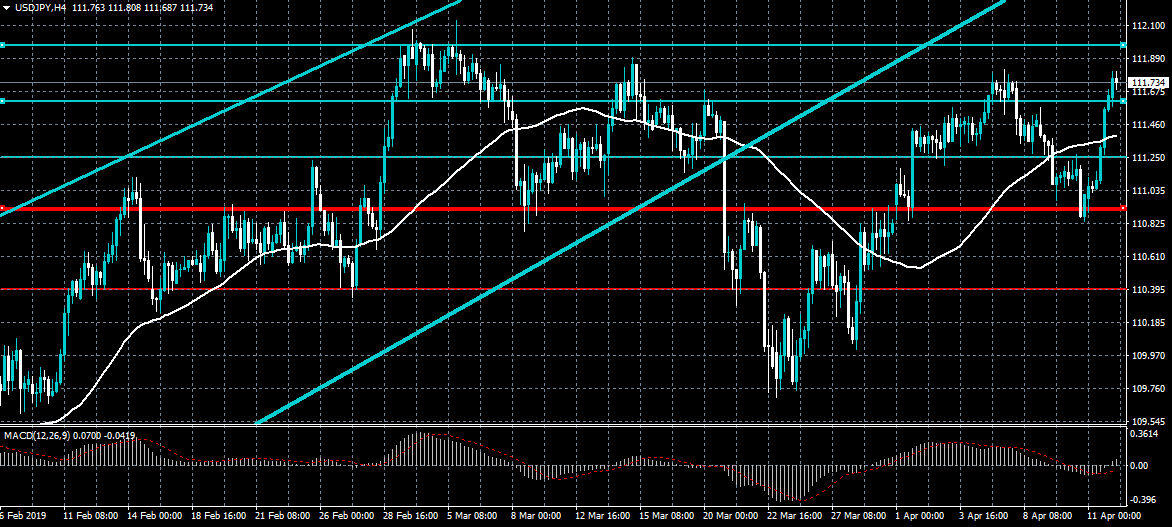
The US dollar has made a strong upside recovery from the 111.00 level against the Japanese yen currency as investor demand for the greenback returns. The USDJPY pair has a strong intraday bullish bias while trading above the 111.60 resistance level. Technical indicators on the four-hour time frame suggest that the USDJPY pair can trade higher over the short-term.
If the USDJPY pair trades above the 111.60 level, buyers may test towards the 112.00 and 112.45 levels.
If the USDJPY pair trades below the 111.60, key intraday support is found at the 111.30 and 110.90 levels.
EURO Rises After EU Leaders Agree To US Trade Talks
The euro rose after European leaders agreed to start trade talks with the United States. The leaders directed the European Commission to start focusing on slashing tariffs on industrial goods while excluding agriculture. United States negotiators have said that agricultural products like soybeans and corn must be included in the deal. This has been opposed by agricultural countries like France, who believe that removing tariffs will put their farmers at risk. New discussions come at a time when Donald Trump is close to making a decision on whether he will add tariffs worth $60 billion on European goods. Last year, the US trade deficit with the EU widened to $157 billion.
US futures point to a higher open as traders prepare for the earnings season, which will start today. As is the norm, the season will start with the release of financials from leading banks such as Wells Fargo, JP Morgan, and PNC Financial. The banks earnings are important to investors because they provide important perspective about the activity of the consumers and businesses. Better-than-expected earnings show that their customers are doing well, which provides a boost to the economy.
The price of crude oil paused as investors wondered about the impacts of the ongoing crisis in the Middle East. In recent months, demonstrations in the oil-rich countries of Sudan and Algeria have forced the countries’ leaders to leave office. Yesterday, Sudan’s leader, Omar al-Bashir was forced to resign as the military took over. In Libya, fighting has continued in Tripoli as Khalifa Haftar’s militia battles with the forces of the UN-recognized Mohammed Magariaf. Investors believe that these protests could unveil the Arab Spring 2.0.
Regarding economic data, traders will watch trade data from China. This data is expected to show that in March, exports grew by 7.3% while imports declined by 1.3%. The trade surplus is expected to grow by $7 billion. They will also receive the CPI numbers from Spain, the industrial production from the European Union, sentiment numbers from the US, and Baker Hughes rigs count.
XTI/USD
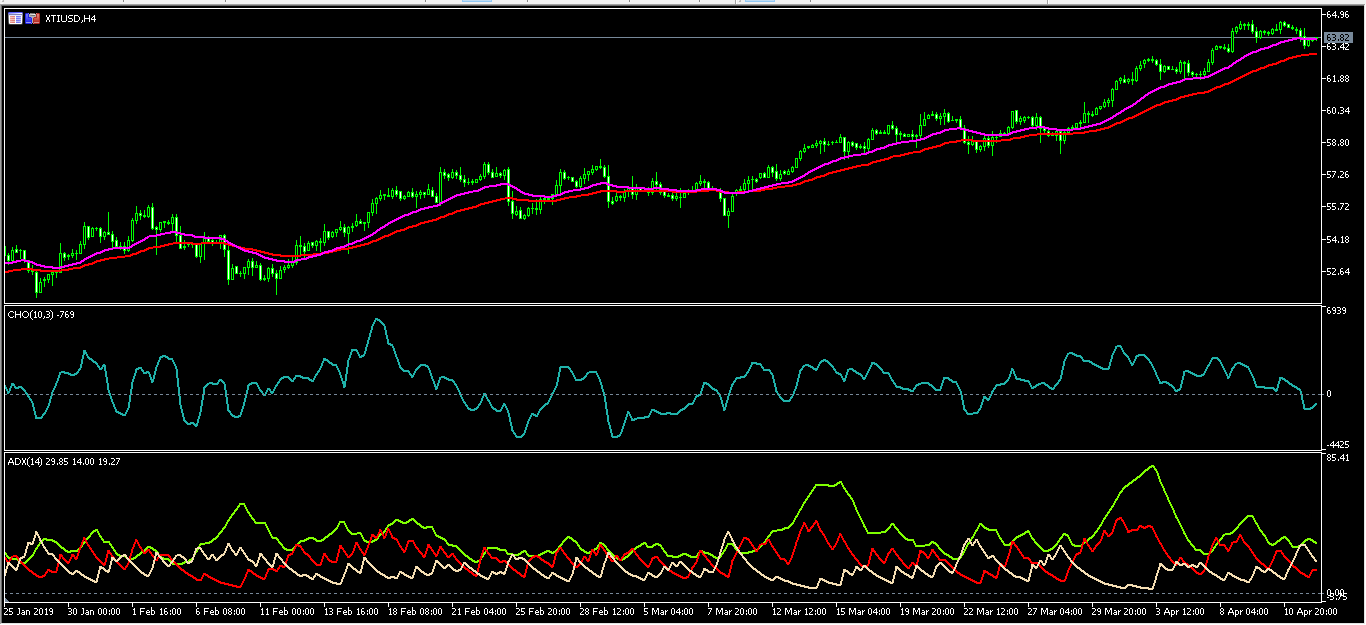
After declining yesterday, the price of WTI crude rose slightly today. It is now trading at the 63.78 level, which is closer to the five-month high of 64.70. On the four-hour chart, this price is along the 25-day moving averages but slightly above the 50-day moving averages. After dropping below the zero line, the Chaiking Oscillator is rising again while the Average Directional Index (ADX) has stabilized at the current levels of 30. Therefore, the pair could move upwards to test the important resistance of 70.
DOW30
Yesterday, the Dow ended the day lower by 15 points. In recent weeks, it has been dragged by Boeing, which is facing billions of dollars in penalties. It is now trading at $26172, while futures are priced at $26180. On the hourly chart, the price is along the short and medium-term moving averages while the RSI is currently at 50. It is slightly above the 61.8% Fibonacci Retracement level. Today, the index will be watched closely as the earnings season kicks off. The key levels to watch will be $26000 and $26200.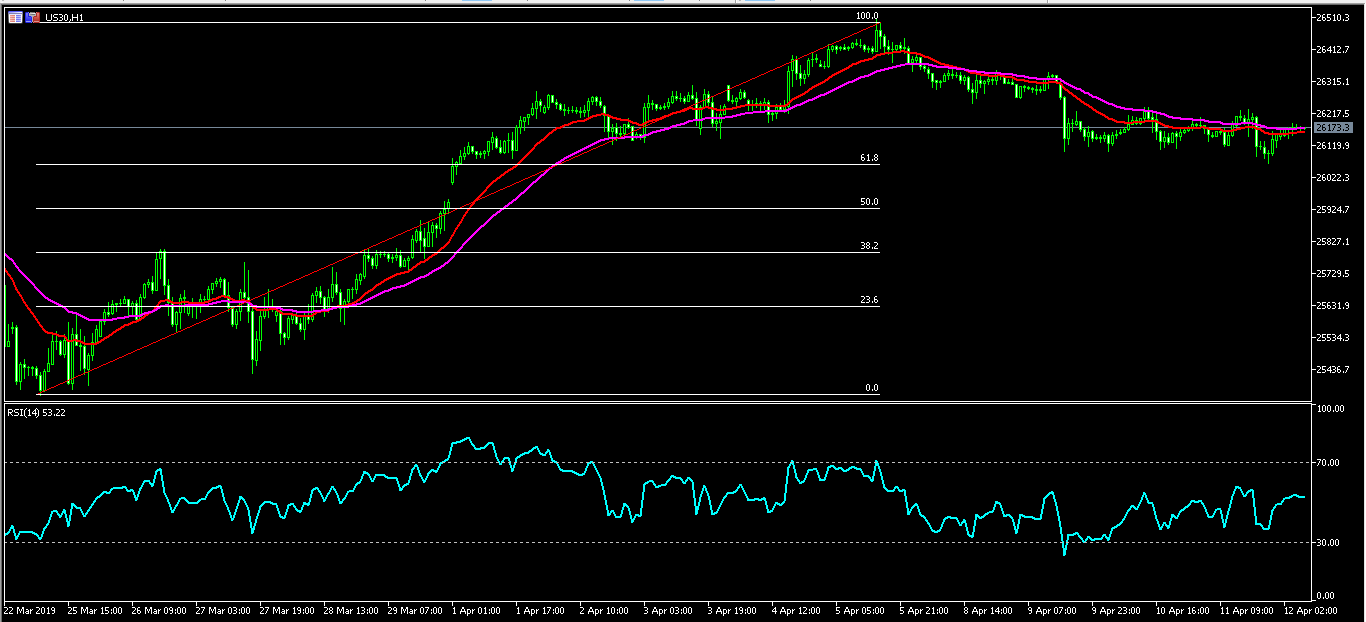
EUR/USD
After yesterday’s declines, the EUR/USD pair rose sharply in overnight trading. The pair reached a high of 1.1293, which was above the 21-day and 42-day Fractal Adaptive Moving Average. On the 30-minute chart, the RSI has remained above the overbought level of 70 while volumes have declined. Today, traders will continue to watch out for the developments in the US-EU dispute.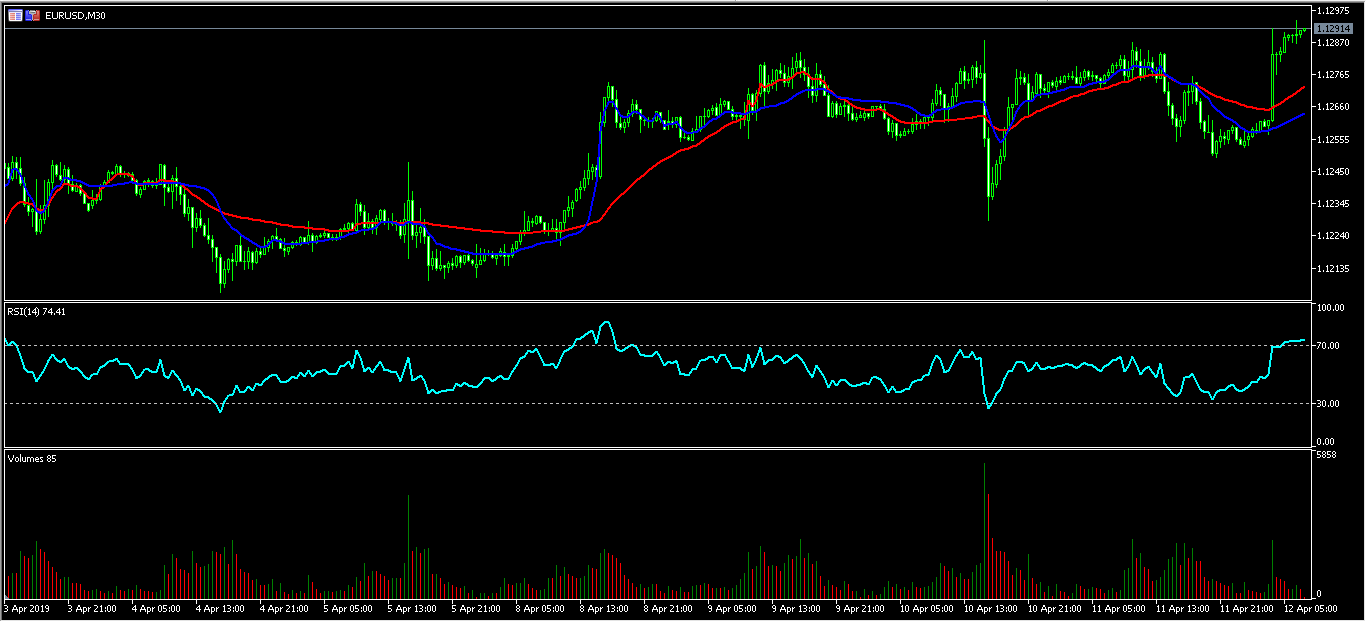
USDCAD Fails To Improve Bullish Actions, Neutral In Near Term
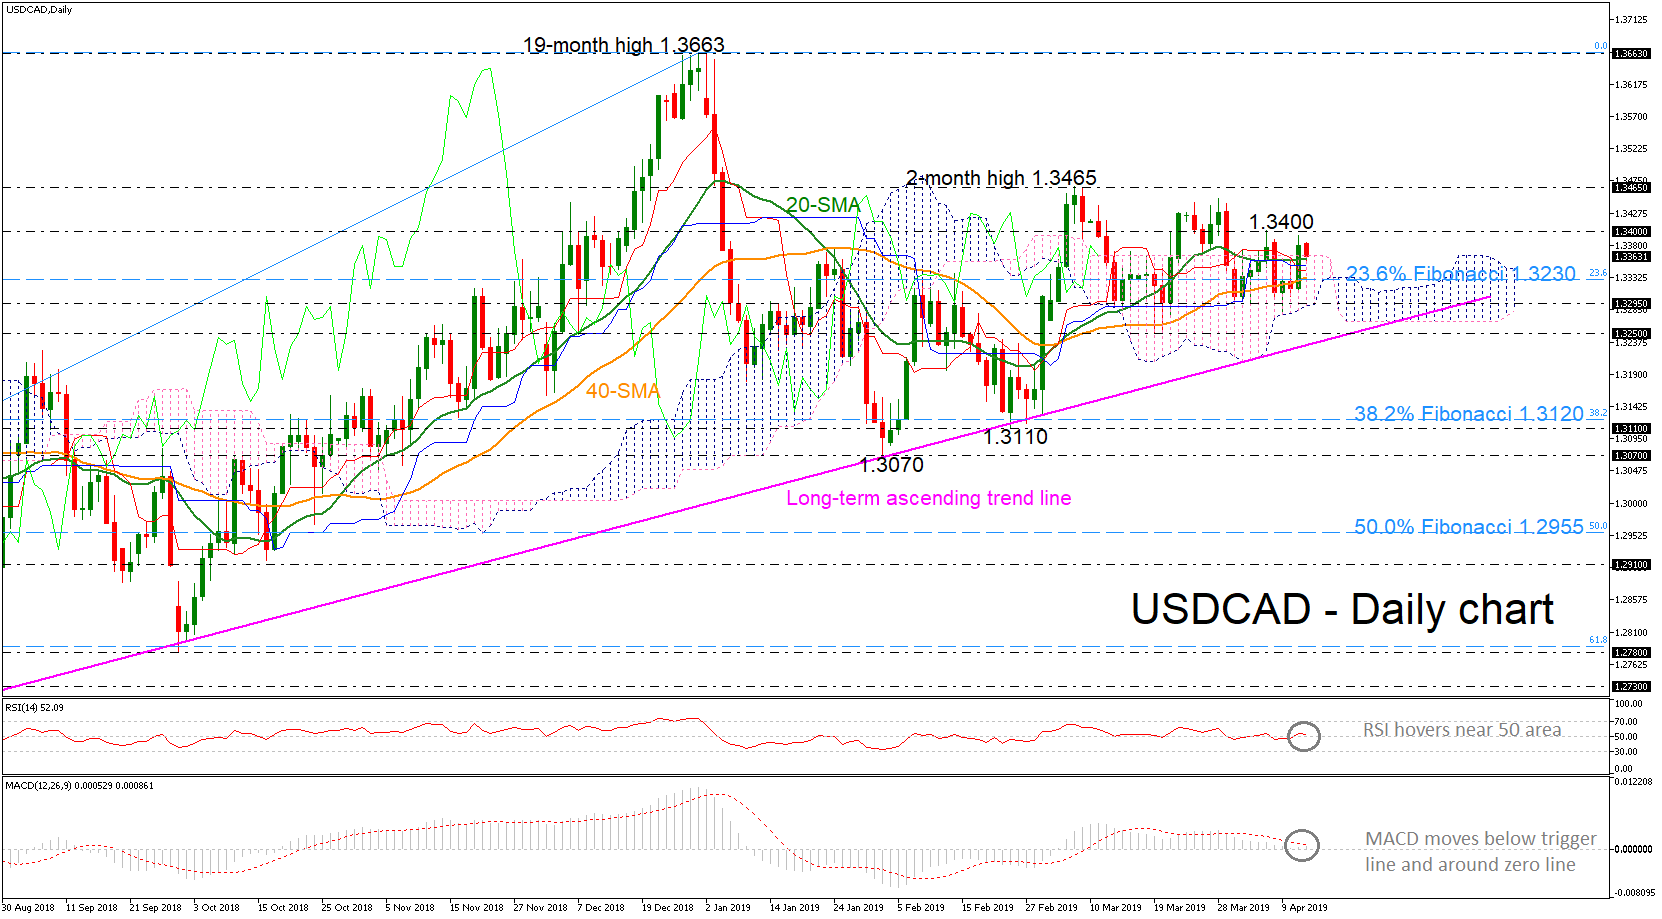
USDCAD has been remaining steady near the 23.6% Fibonacci retracement level of the upleg from 1.2250 to 1.3663 around 1.3230 over the last month, failing confirm once again its long-term upside tendency. The price is hovering within the Ichimoku cloud, while the red Tenkan-sen and the blue Kijun-sen lines are flattening. Furthermore, the RSI holds near the threshold of 50 and the MACD is standing below its trigger line and near its zero level. Both are confirming the recent bias in the daily timeframe.
In case of a jump above the psychological level of 1.3400, this may lead the price towards the two-month high of 1.3465 and an aggressive jump above this level could send the market until the 19-month high of 1.3663.
Alternatively, a failure to overcome 1.3400, would send the price back down to the 23.6% Fibonacci of 1.3230 before touching 1.3295. Lower, the 1.3250 and the ascending trend line could halt downside movements, but if not, then more losses could follow, probably towards the 38.2% Fibonacci of 1.3120, shifting the bullish long-term structure to neutral.
To sum up, in the long-term timeframe, the market has been developing in an upside movement since February 2018, completing higher highs and higher lows. However, in the short-term, only a daily close above the two-month high would resume bullish actions.
GBP/USD Daily Outlook
Daily Pivots: (S1) 1.3032; (P) 1.3071; (R1) 1.3091; More....
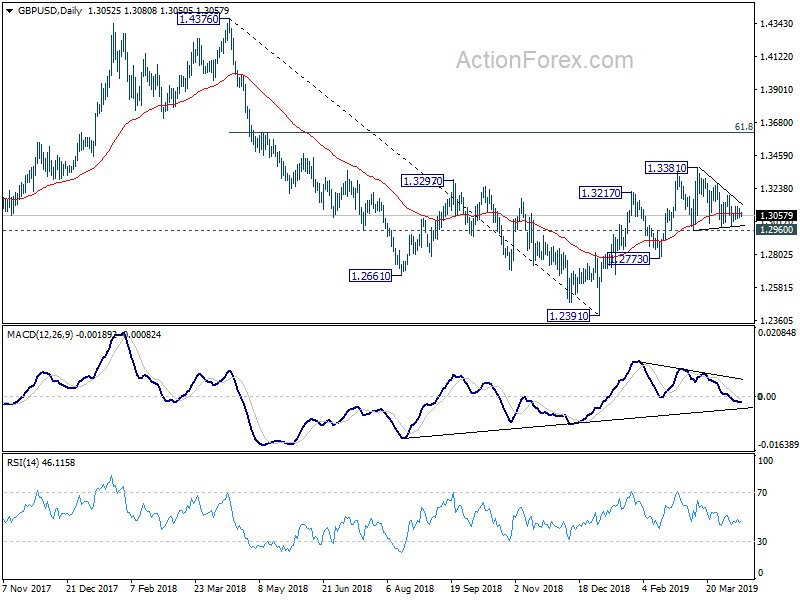
No change in GBP/USD's outlook as it's staying in consolidation from 1.3381. Intraday bias remains neutral at this point. Further rally remains mildly in favor with 1.2960 support intact. On the upside, decisive break of 1.3381 will extend the rise from 1.2391 and target 61.8% retracement of 1.4376 to 1.2391 at 1.3618 next. However, on the downside, sustained break of 1.2960 will indicate that rebound from 1.2391 has completed earlier than expected. Deeper fall would then be seen to 1.2773 support for confirmation.
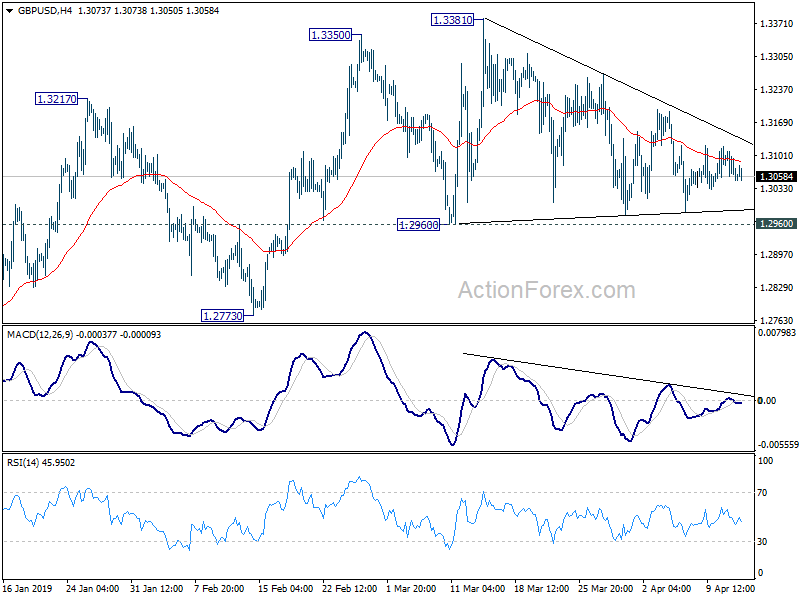
In the bigger picture, medium term decline from 1.4376 (2018 high) should have completed at 1.2391. Rise from 1.2391 is seen as the third leg of the corrective pattern from 1.1946 (2016 low). Further rise could be seen through 1.4376 in medium term. On the downside, though, break of 1.2773 support will dampen this view. Focus will be turned back to 1.2391 low and break will resume the fall from 1.4376 to 1.1946.