

Sample Category Title
Markets Steady Ahead Of China Trade Data
Data seen mixed
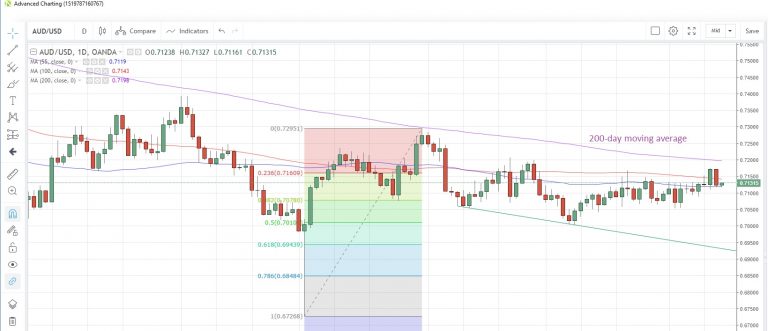
The release of March’s trade data out of China is unusually late today, and markets are being held in limbo in the process. Expectations are that exports would rise 7.3% y/y after a 20.8% decline in February (New Year-related), while imports are seen falling 1.3% y/y after a 5.2% contraction the previous month. Consequently, the trade surplus is expected to widen to $7.05 billion from $4.08 billion. AUD/USD has been quiet in the run-up to the data, trading in a narrow 0.7116-0.7133 range. It is currently at 0.7131.
AUD/USD Daily Chart
Singapore GDP growth below forecast
The Singapore economy grew less than economists had forecast in Q1, expanding 1.3% y/y, missing the estimate of +1.5% growth. This was the slowest annualized growth since 2016. A 1.9% annual contraction in the manufacturing sector was countered by growth in the services and construction sector. The government has predicted that growth in 2019 will slow to the midpoint of its 1.5 to 3.5% target range from 3.2% in 2018.
In response to the weaker expectations, the Monetary Authority of Singapore kept its policy unchanged at its semi-annual meeting, keeping the slope and the width of the Singapore dollar trading band, as well as the level at which it is centred. The MAS doesn’t fix interest rates, but uses the currency basket as its main tool of monetary policy.
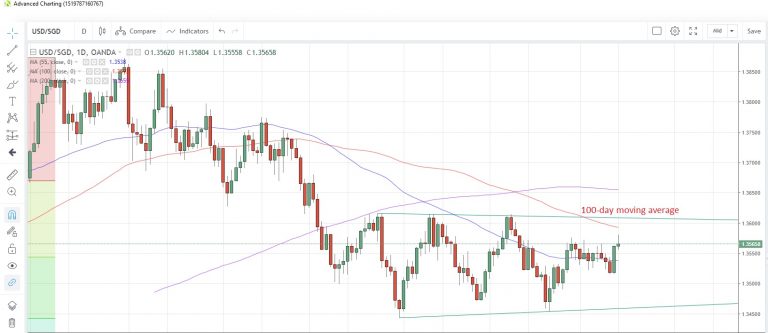
In response to the dovish undertones of the MAS move, the Singapore dollar weakened across the board with USD/SGD rising 0.14% to touch 1.3581, the highest in a month. The FX pair is facing the 100-day moving average at 1.3592, which has capped prices since December 26.
USD/SGD Daily Chart
A slow finish to the week
The data calendar is relatively sparse today, with German wholesale prices and Euro-zone industrial production for March the only items on the European calendar. The US session features March export and import prices together with the Michigan consumer sentiment index for April. This index is expected to slide to 98.0 from 98.4 in March, which could further cloud the outlook for the US economy.
Banking shares could be in the spotlight as Wells Fargo and JPMorgan announce first-quarter earnings that will lead off the reporting season today.
EUR/JPY Daily Outlook
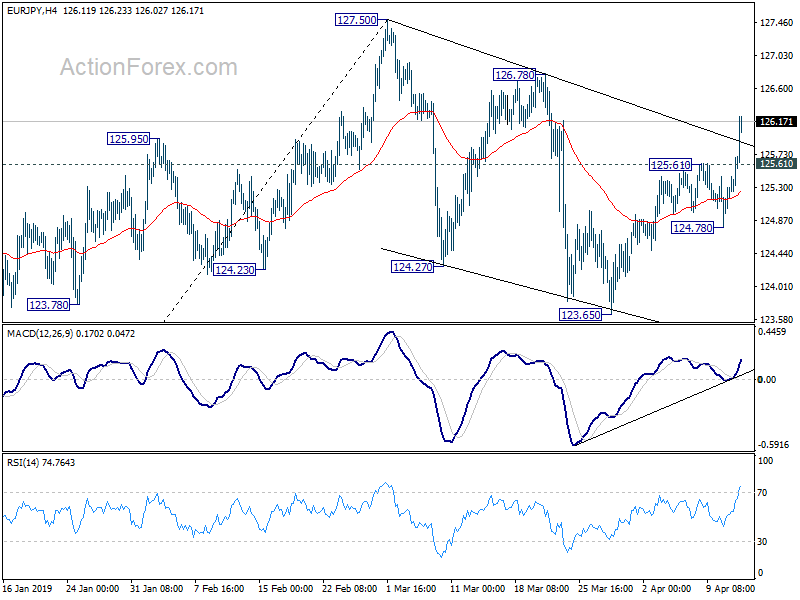
Daily Pivots: (S1) 125.17; (P) 125.45; (R1) 125.95; More....
EUR/JPY surges to as high as 126.23 so far today as rise from 123.65 resumed. The development revived that case that corrective fall from 127.50 has completed at 123.65 already. Intraday bias is back on the upside for 126.78/127.50 resistance zone. Decisive break there will resume whole rise from 118.62 spike low. On the downside, below 125.61 minor support will turn intraday bias neutral first. But further rally will remain in favor as long as 124.78 support holds.
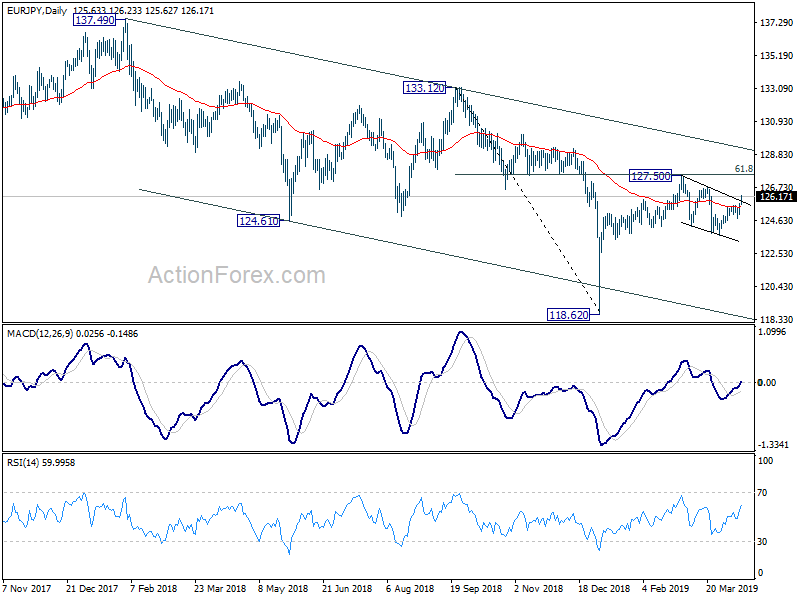
In the bigger picture, EUR/JPY is staying well inside medium term falling channel from 137.49 (2018 high). It's also held below 55 week EMA (now at 127.53). Thus, down trend from 137.49 might still extend lower. Break of 118.62 will target 109.03/114.84 long term support zone. On the upside, however, break of 127.50 will solidify the case of medium term bullish reversal. Rise from 118.76 should extend to 133.12 key resistance instead.
Euro Picks Up Broad Based Strength Thanks to Rebounds in Crosses
Euro jumps broadly in Asian session today, partly by extended rebound in EUR/AUD, EUR/CAD, and more importantly EUR/CHF. The common currency has clearly left behind the mild dovishness of ECB earlier this week. EUR/JPY also resumed recent rise thanks to broad based weakness in Yen. Stocks markets are mixed but resilience in treasury yields is pressuring the Japanese currency. US 10-year yield close above 2.5 handle overnight and there is prospect of German 10-year yield turning positive again before weekly close.
Dollar is softer after comments from Fed officials, reaffirmed the patience stance. A key message was from Bullard that normalization of monetary policy has completed successfully. It's seen as the consensus position among Fed policymakers. This reaffirmed that Fed's default position has changed. That is, before the last hike in December, when there was nothing wrong with data, Fed continued rate hikes. Now, if there is nothing wrong with data, upside or downside, don't move. Kashkari also reminded the markets that Fed has a "symmetric target" and inflation could be allowed to run above 2%.
In other markets, Nikkei is current up 0.44%. Hong Kong HSI is down -0.36%. China Shanghai SSE is down -0.44%. Singapore Strait Times is down -0.16%. Japan 10-year JGB yield is up 0.002 at -0.057. Overnight, DOW dropped -0.05%. S&P 500 rose -0.00%. NASDAQ dropped -0.21%. 10-year yield rose 0.027 to 2.504.
Fed Bullard: Upcoming policy adjustments no longer part of normalization campaign
St. Louis Fed President James Bullard said if economy evolves as expected, current interest rate will be appropriate through 2019. Balance sheet reduction program will end this autumn. "These events mark the end of monetary policy normalization in the U.S."
Bullard said the normalization campaign has been "largely successful". Nominal short-term interest rates have been raised from near-zero levels, and the size of the Fed's balance sheet has been reduced as the economic expansion has continued.
Going forward, the FOMC may elect to adjust monetary policy going forward. However, Bullard said that will not be "part of an ongoing normalization strategy". Adjustments will be "in response to incoming macroeconomic data".
On yield curve inversion, Bullard said "yield curve information is not infallible, and inversion could be driven by other factors unrelated to future macroeconomic performance"."Nevertheless, the empirical evidence is relatively strong. Therefore, both policymakers and market professionals need to take the possibility of a meaningful and sustained yield curve inversion seriously."
Fed Kashkari: We should really live the symmetric inflation target
Minneapolis Fed President Neel Kashkari noted that Fed "officially have a symmetric target" on inflation. Actual inflation has "averaged around 1.7%" for the past seven years, which was below the 2% target. Therefore, "if we were at 2.3% for several years that shouldn't be concerning." He also emphasized that "we should really live the symmetric target and not tap the brakes prematurely." Thus, "this is why I've been arguing for more accommodative monetary policy.
Kashkari also said he's "concerned" with yield curve inversion. However, he added: "I don't necessarily believe it causes recessions but i believe it's giving feedback that monetary policy is close to neutral today. We don't want contractionary monetary policy unless we have good reason. We should be careful not to end the expansion."
UK PM May urged MPs to use Easter recess for Brexit reflections
In the parliament, Prime Minister Theresa May insisted that UK can still pass the Brexit Withdrawal Agreement by May 22 to avoid taking part in European parliament elections. And it can still leave EU by the end of next month. May also emphasized the important of cross-party negotiations with Labours and she hoped to reach an agreement in the coming days. May urged MPs to "use the opportunity of the recess to reflect on the decisions that will have to be made swiftly on our return after Easter. And let us then resolve to find a way through this impasse."
BoE Governor Mark Carney said with the flexible Article 50 extension till October 31, there was now a "window of time" to forge consensus. And, "we will see how that time is used". "Right up until yesterday it could be argued that the UK had run out of time to forge that consensus. There are cross-party talks to try to find that, and that may take some time," he added.
BoJ Kuroda: Global economy will recover in second half of the year
BoJ Governor Haruhiko Kuroda said that global economy would recover in the second half as he arrived for the G20 finance ministers meeting in Washington yesterday. He said, "our baseline scenario is that the global economy will recover in the latter half of this year, and achieve sufficiently high growth next year."
Also, he defended rule-based multilateral trade system. Kuroda warned that "protectionism benefits neither the United States nor China." He urged "both countries, as well as each G20 economy, must make efforts to solve problems based on the understanding that free trade under World Trade Organization rules has brought enormous benefits to the global economy."
Japan-US trade talks to start next week for exchanging views
Japan Economy Minister Toshimitsu Motegi announced today that the first round of Japan-US trade talks will start next week on April 15-16 in Washington. He said he'd intend to exchange view frankly with US Trade Representative Robert Lighthizer. It's believed that a core topic is Japan's near USD 70B trade surplus, with nearly two-thirds from auto exports.
Finance Minister Taro Aso reiterated Japan's intention to "further expand trade and investment between" between the two countries, in a "mutually beneficial manner". He also pointed to the joint statement made last September. However, Japan has been very clear on its intention to defend the multilateral trade pact TPP that it leads, and US quitted under Trump. Hence, no matter what Japan is going to offer to the US, they won't be something better than what's offered to TPP partners.
IMF Gopinath: Auto tariffs could be more damaging to US-China trade war
IMF chief economist Gita Gopinath warned that auto tariffs could be more damaging to the world economy than US-China trade war. She said on the sidelines of IMF and World Bank annual meeting, "we are concerned about what auto tariffs would do to the global economy at a time when we are more in the recovery phase."
Trade conflicts of the US and others, including China, EU, Canada and Japan could spill over into the auto sector. And that could have severe damage to the global manufacturing supply chains, She warned, "that would actually be far more costly for the world economy than just the U.S.-China trade tensions that we had."
In the US, the Commerce Department has already submitted Section 232 national security report on auto imports earlier this year. Trump will have until May 17 to decide whether he wants to extend punitive tariffs from steal to auto, and from rival in China to allies in EU, Canada and Japan.
On the data front
New Zealand BusinessNZ manufacturing index dropped to 51.9 in March, down from 53.7. Eurozone will release industrial production today. US will release import price index and U of Michigan sentiments.
EUR/JPY Daily Outlook
Daily Pivots: (S1) 125.17; (P) 125.45; (R1) 125.95; More....
EUR/JPY surges to as high as 126.23 so far today as rise from 123.65 resumed. The development revived that case that corrective fall from 127.50 has completed at 123.65 already. Intraday bias is back on the upside for 126.78/127.50 resistance zone. Decisive break there will resume whole rise from 118.62 spike low. On the downside, below 125.61 minor support will turn intraday bias neutral first. But further rally will remain in favor as long as 124.78 support holds.
In the bigger picture, EUR/JPY is staying well inside medium term falling channel from 137.49 (2018 high). It's also held below 55 week EMA (now at 127.53). Thus, down trend from 137.49 might still extend lower. Break of 118.62 will target 109.03/114.84 long term support zone. On the upside, however, break of 127.50 will solidify the case of medium term bullish reversal. Rise from 118.76 should extend to 133.12 key resistance instead.
Economic Indicators Update
| GMT | Ccy | Events | Actual | Forecast | Previous | Revised |
|---|---|---|---|---|---|---|
| CNY | Trade Balance (USD) Mar | 8.1B | 4.1B | |||
| CNY | Exports Y/Y Mar | 7.70% | -20.70% | |||
| CNY | Imports Y/Y Mar | -0.10% | -5.20% | |||
| CNY | Trade Balance CNY Mar | 2B | 34B | |||
| CNY | Exports Y/Y CNY Mar | 5.80% | -16.60% | |||
| CNY | Imports Y/Y CNY Mar | 1.00% | -0.30% | |||
| 22:30 | NZD | BusinessNZ Manufacturing PMI Mar | 51.9 | 53.7 | ||
| 01:30 | AUD | RBA Financial Stability Review | ||||
| 09:00 | EUR | Eurozone Industrial Production M/M Feb | -0.60% | 1.40% | ||
| 12:30 | USD | Import Price Index M/M Mar | 0.40% | 0.60% | ||
| 14:00 | USD | U. of Mich. Sentiment Apr P | 98.3 | 98.4 |
Brexit Update – Article 50 Extended Again
European Parliament approved that Brexit would be extended further to October 31, from April 12. It is possible for the UK to leave earlier should the UK Parliament approve a Withdrawal Agreement (the deal). A review of the situation would take place in June so as to check if the UK has held its part of EU parliamentary election properly. The arrangement appears a compromise between the EU members who opted for a longer delay until December 31 and French President Emmanuel Macron who preferred a short extension. While this arrangement offers temporary relief to the market as the UK avoids leaving the EU without a deal this month, the risk of no-deal Brexit is still not eliminated.
Cross Party Talks
For the six months ahead, UK PM Theresa May would continue to get a deal approved in the UK Parliament, although she got defeated for three times in the meaningful vote over the past months. Although the margin of rejection has been declining, it remains uncertain that whether a deal would be approved before the October deadline. The cross-party talk between the Labors and the Conservatives are closely- watched. Yet, it is difficult to get a compromise between the former and the Brexit hardliners of the latter. We doubt if the Brexit hardliners would accept Labors’ request to stay in the Customs Union permanently. Meanwhile, Labors’ leader Jeremy Corbyn might find the refusal to form an alliance with the Conservatives politically favorable.
PM May’s Departure and General Election
PM May promises to step down after completing the first phase (Withdrawal Agreement) of the Brexit negotiation. She probably has a few more months; buffer with the extension arrangement. However, calls for her resignation could intensify if the deadlock continues. According to YouGov polls, 48% of Conservative voters believe a ‘no deal’ Brexit is a good outcome. It appears likely that May’s successor could be Eurosceptic. This would heighten market volatility.
Another possibility is early general election, which could be triggered in two ways. First, the Commons votes for a new election. This required at least two-thirds of the House vote for a dissolution. Second, there is a vote of no confidence in the Government. Yet, a general election is by no means a guarantee to unlock the deadlock. Opinion polls show that support for conservatives is falling while that Labors is climbing up slowing. However, neither party is strong enough to gain majority in the Parliament. Meanwhile, the local council elections on May 2, as well as the European Parliament elections on May 23 might offer us insight to the political spectrum of the new Parliament (in case of an early election,
Second Referendum
A second referendum is time-wise feasible as the minimum time to pass the legislation, complete question testing and hold a campaign is about 22 weeks. The key is whether PM May would prefer this option as "no Brexit" would probably be one of choices in the referendum question.
Although the MPs have recently rejected all alternatives to the deal, they have also voted down the possibility of leaving the EU without a deal! This is why we refrain from overly concerned about the case of no deal Brexit. While the risk of no-deal Brexit is not eliminated, the possibility is not high. In an extreme scenario, the MPs can decide to revoke Article 50. Indeed, 191 MPs voted in favor of this option in the last round of "indicative votes". More might go for this if all other windows are closed.
AUD/USD And NZD/USD Turned Sell On Rallies
AUD/USD struggled near the 0.7175 level and recently corrected below the 0.7140 support. NZD/USD also declined recently and broke the key 0.6750 and 0.6740 support levels.
Important Takeaways for AUD/USD and NZD/USD
- The Aussie Dollar topped near the 0.7174 level and declined recently against the US Dollar.
- There was a break below a crucial bullish trend line with support at 0.7125 on the hourly chart of AUD/USD.
- NZD/USD declined sharply after it failed to clear the 0.6775-0.6780 resistance area.
- There was a break below a major ascending channel with support at 0.6755 on the hourly chart.
AUD/USD Technical Analysis
There was a decent upward move this week above 0.7120 in the Aussie Dollar against the US Dollar. The AUD/USD pair traded close to the 0.7175 resistance level, where sellers emerged.
As a result, the pair started a downside correction below the 0.7150 support level. There was also a break below the key 0.7130 support plus there was a close below the 50 hourly simple moving average.
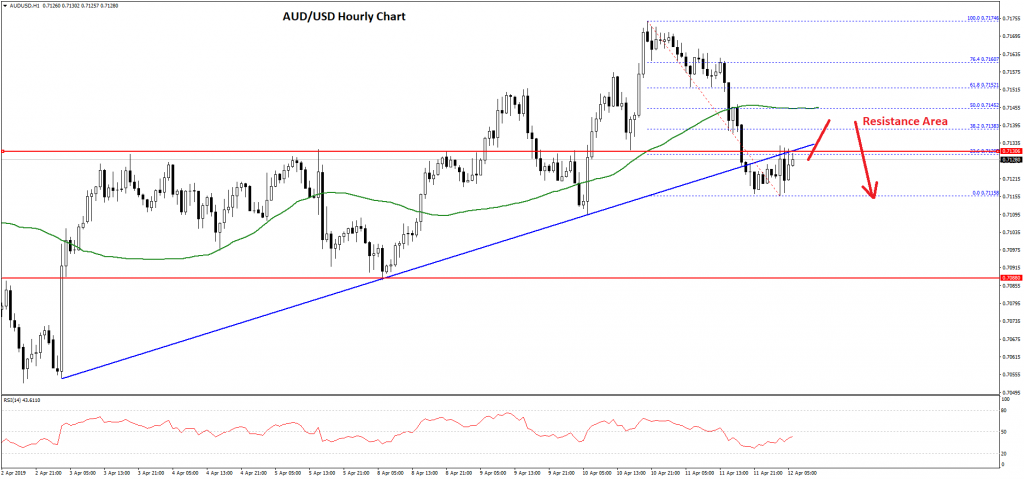
The pair traded as low as 0.7115 on FXOpen and it is currently consolidating losses. During the decline, there was a break below a crucial bullish trend line with support at 0.7125 on the hourly chart of AUD/USD.
The same trend line is currently acting as a resistance along with the 23.6% Fib retracement level of the recent decline from the 0.7174 high to 0.7115 low. However, the main resistance for buyers is near the 0.7150 level and the 50 hourly simple moving average.
The 50% Fib retracement level of the recent decline from the 0.7174 high to 0.7115 low is also near the 0.7145 level to act as a strong resistance.
Therefore, if the pair corrects higher, it is likely to face sellers near the 0.7145 and 0.7150 levels. On the downside, an initial support is at 0.7115, below which the price is likely to trade towards the 0.7100 support area in the near term.
NZD/USD Technical Analysis
The New Zealand Dollar followed a slow and steady uptrend and tested the 0.6775-0.6780 resistance area against the US Dollar. The NZD/USD pair struggled to clear the 0.6775 resistance and recently declined below the 0.6750 support level.
During the recent drop, the pair settled below the 0.6750 support and the 50 hourly simple moving average. More importantly, there was a break below a major ascending channel with support at 0.6755 on the hourly chart.
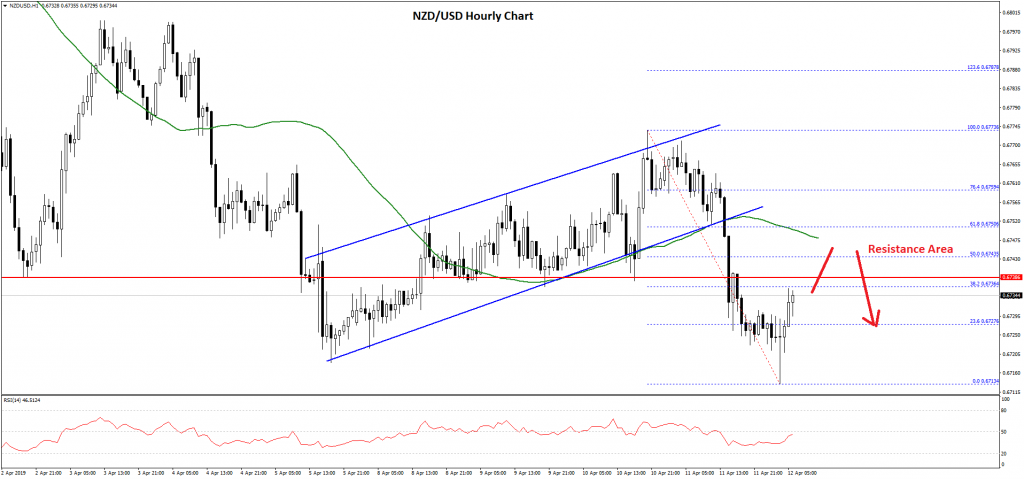
The pair declined sharply below the 0.6730 level and traded close to the 0.6710 level. A swing low was formed at 0.6713 and recently the pair corrected higher.
It traded above the 23.6% Fib retracement level of the recent decline from the 0.6773 high to 0.6713 low. However, there are many hurdles for buyers near the 0.6740 and 0.6750 resistance levels.
The 50 hourly simple moving average is positioned near the 0.7150 level along with the 50% Fib retracement level of the recent decline from the 0.6773 high to 0.6713 low.
Therefore, if there is a decent rebound, NZD/USD may perhaps face a strong resistance near the 0.6740-50 resistance area. On the downside, an initial support is near the 0.6725 level, below which there is a risk of an extended decline towards the 0.6700 support area.
IMF Gopinath: Auto tariffs could be more damaging to US-China trade war
IMF chief economist Gita Gopinath warned that auto tariffs could be more damaging to the world economy than US-China trade war. She said on the sidelines of IMF and World Bank annual meeting, "we are concerned about what auto tariffs would do to the global economy at a time when we are more in the recovery phase."
Trade conflicts of the US and others, including China, EU, Canada and Japan could spill over into the auto sector. And that could have severe damage to the global manufacturing supply chains, She warned, "that would actually be far more costly for the world economy than just the U.S.-China trade tensions that we had."
In the US, the Commerce Department has already submitted Section 232 national security report on auto imports earlier this year. Trump will have until May 17 to decide whether he wants to extend punitive tariffs from steal to auto, and from rival in China to allies in EU, Canada and Japan.
USD/JPY Testing Crucial Resistance Near 112.00
Key Highlights
- The US Dollar corrected lower this week and recently rebounded above 111.50 against the Japanese Yen.
- A major bullish trend line is formed with support at 111.10 on the 4-hours chart of USD/JPY.
- The US Initial Jobless Claims for the week ending April 06, 2019 declined to 196K.
- The Michigan Consumer Sentiment Index in April 2019 (Prelim) might drop from 98.4 to 98.0.
USDJPY Technical Analysis
This past week, the US Dollar revisited the 111.80-112.00 resistance area and later declined against the Japanese Yen. The USD/JPY pair tested the 110.85 level, recovered recently, and now it is testing the 111.80-112.00 resistance area.
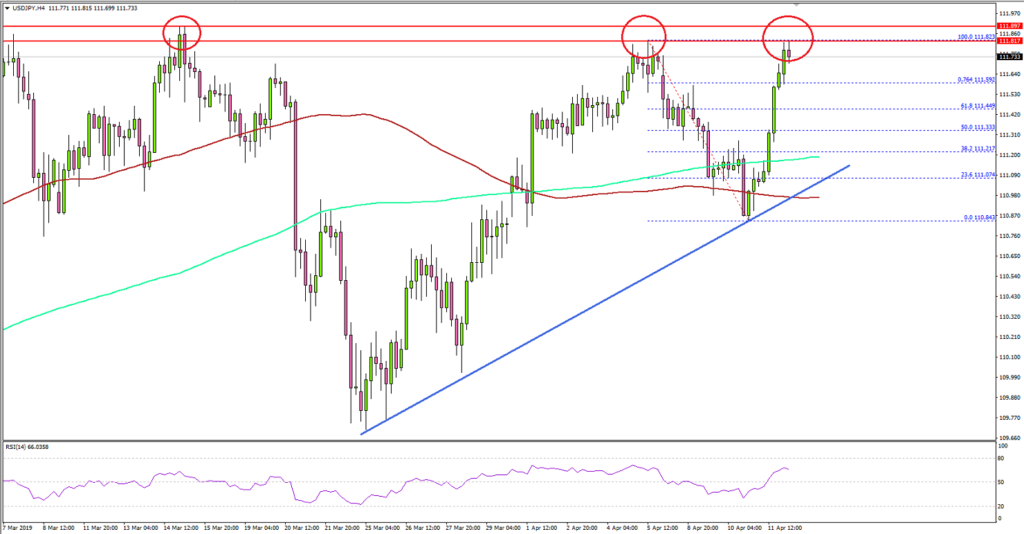
Looking at the 4-hours chart, the pair traded as low as 110.84 and corrected above the 111.00 level. There was a break above the 111.20 resistance, the 100 simple moving average (4-hours, red), and the 200 simple moving average (4-hours, green).
The pair surpassed the 50% Fib retracement level of the last decline from the 111.82 high to 110.84 low. Therefore, there are chances of more gains above the 111.80 level.
An immediate resistance was surpassed at 111.60 and the 76.4% Fib retracement level of the last decline from the 111.82 high to 110.84 low. The pair is now testing the key 111.80 and 112.00 resistance levels, where sellers protecting gains.
On the downside, an initial support is at 111.20. There is also a major bullish trend line formed with support at 111.10 on the same chart. Therefore, it seems like dips remain supported near 111.20 and the pair could retest the key 112.00 resistance area in the near term. If bulls manage to clear the 112.00 resistance this time, the pair could rally significantly.
Fundamentally, the US Initial Jobless Claims report for the week ending April 06, 2019 was released by the US Department of Labor. The market was looking for a rise in claims from the last reading of 202K to 211K.
The actual result was better than the forecast, as the US Initial Jobless Claims declined to 196K. However, the last reading was revised up from 202K to 204K.
The report added that:
The 4-week moving average was 207,000, a decrease of 7,000 from the previous week’s revised average. This is the lowest level for this average since December 6, 1969 when it was 204,500.
Overall, the current trend is positive and USD/JPY could continue higher towards 112.00. However, it won’t be easy for bulls to gain strength above 112.00 in the short term and there could be another bearish reaction.
Economic Releases to Watch Today
- US Import Price Index March 2019 (MoM) – Forecast +0.4%, versus +0.6% previous.
- US Export Price Index March 2019 (MoM) – Forecast +0.2%, versus +0.6% previous.
- Michigan Consumer Sentiment Index April 2019 (Prelim) – Forecast 98.0, versus 98.4 previous.
Market Morning Briefing: Aussie Has Dipped A Bit
STOCKS
Global indices are mixed. Dow remains below key resistance and looks vulnerable for a fall. DAX and Nikkei can see some upticks in the near term. Shanghai has declined below a key support and is on a corrective fall. Sensex and Nifty looks mixed and can remain range bound.
Dow (26143.05, -14.11, -0.05%) broke below 26100 but has bounced from the low of 26062. As mentioned yesterday, the index has to breach 26250 decisively to gain strength and rally to 26500 levels again. But while below 26250, the possibility is high for the Dow to fall to 25750 and 25700.
DAX (11935.20, +29.29, +0.25%) is getting support around 11850. An upmove to 11985-12000 is possible in the near term. A range-bound move between 11850 and 12000 is possible for some time.
Nikkei (21824.50, +113.12, +0.52%) has been inching higher over the last couple of days. A test of the key 21930-21950 resistance region is likely in the near term. A pull-back from this resistance region can take the index lower to 21500 again. But a strong break above 21950 will be bullish for a fresh a rally to 22750 over the medium term.
Shanghai (3185.05, -4.91, -0.15%) has declined below 3200 and has tested 3180 as expected. The corrective fall can extend to 3150 and 3130 while the index remains below 3200.
Sensex (38607.01, +21.66, +0.06%) is holding above 38500. While it manages to sustain above 38500, it can bounce to 39000 and retain the 38500-39000 sideways range for some more time. But a break below 38500 will drag it to 38000.
Similarly, Nifty (11596.7, +12.40, +0.11%) can bounce to 11700 if it sustains above 11550. But a break below 11550 can take it to 11500. It will also increase the possibility of the index declining below 11500 and target 11400 thereafter.
COMMODITIES
Gold and Silver have come under pressure and looks vulnerable for further fall. Copper hovers above key support. Oil has come-off from its highs but is managing to hold above a key near-term support which keeps the possibilities alive of seeing further rise.
Gold (1293) has tumbled below 1300 and has bounced slightly after making a low of 1288. A dip to 1287-1285 cannot be ruled out in the near term
Silver (14.98) is trading below the psychological level of 15 and is likely to test the crucial support level of 14.85 while it remain below 15.05. A strong break below 14.85 will be very negative silver which will increase the possibility of the prices tumbling to 14.5 or even 14 thereafter.
Copper (2.89) has a crucial supports between current levels and 2.88. A bounce from here can take it back to 2.90 and 2.95 levels again. It will also retain the 2.89-2.96 sideways range. But a break below 2.88 will bring pressure on copper and will take it lower to 2.86 in the near term.
WTI (63.77) has come-off sharply from its resistance at 64.8. However, the support at 63.4 is holding well as of now. As long as WTI sustains above 63.40, a bounce to 64.8 again is possible. It will also keep our bullish view intact for a test of 66. The view will turn negative for a fall to 62 if WTI breaks below 63.4
Brent (70.98) has come-off from its high around 71.78. However, the support around 70.40 seems to be holding well as of now and keeps alive the possibility of Brent moving higher to 72.7. A break below 70.4 can take it to 69.80 and 69.40.
FOREX
Dollar Index looks strong and could pull up Euro-Yen, Dollar Yen and Dollar Yuan with itself. Euro could fall from 1.13.
Dollar-Index (96.98) is almost stable and while immediate support at 96.75 holds, the index could have some scope of rising towards 97.25/35 in the near term.
Euro (1.1288) could dip towards 1.1250-1.1200 if resistance near 1.13 holds. This is preferred view for now unless we see a sharp rise above 1.13.
Euro-Yen (126.11) has broken above 126 but could face resistance near 126.50 which if holds could push the pair towards 126-125 levels. Alternatively, if the pair manages to break above 126.50, it would turn bullish towards 127.50-128.
Dollar Yen (111.71) has risen sharply and could test 112.0-112.5 on the upside soon. While the Dollar Index looks bullish in the coming sessions, there is scope for Dollar-Yen to rise higher too in the near term.
Aussie (0.7127) has dipped a bit. While immediate resistance near 0.72 holds, Aussie could fall towards 0.71 or lower in the coming sessions. A break above 0.72, if seen would turn bullish towards 0.73.
Pound (1.3067) is trading along support trend line and stuck within the 1.3150-1.30 region for now. Looking at the 3-day candles, while support at 1.30 holds, Pound could turn upwards targeting 1.34 in the medium term.
USDCNY (6.7192) has immediate resistance at 6.72 which if holds could keep the pair stable below 6.72 for a few sessions. A break above 6.72 could make it bullish towards 6.74/75 in the medium term.
Dollar-Rupee (68.93) bounced from 68.83 yesterday. While support at 68.75 holds, Dollar-Rupee could move up to test 69.07/10 initially, break above which would pull the pair up towards 69.25/35 levels. If 69.07/10 holds, we could see another dip towards 68.80/75 keeping the pair in a sideways range for a few sessions.
INTEREST RATES
The US yields look in a sideways range just now. While the medium term view is bearish, we could see some interim upward corrective movements in the near term. The 2Yr (2.36%), 5YR (2.32%), 10YR (2.50%) and 30YR (2.93%) are trading higher today again. Our medium term bearish view remains intact. On the upside there is room towards 2.55% and 3% for the 10YR and 30YR respectively.
The German 10YR (-0.007%), 30YR (0.633%), 2Yr (-0.572%) and the 5YR (-0.421%) yields have risen from yesterday’s levels. While there is scope of falling in the near term, the yields may remain stable for a few sessions.
The 10Yr GOI (7.5201%) is holding below 7.55/58% and could well come off towards 7.45% in the near term. A break above 7.58% could se a test of 7.60%.
Japan-US trade talks to start next week for exchanging views
Japan Economy Minister Toshimitsu Motegi announced today that the first round of Japan-US trade talks will start next week on April 15-16 in Washington. He said he'd intend to exchange view frankly with US Trade Representative Robert Lighthizer. It's believed that a core topic is Japan's near USD 70B trade surplus, with nearly two-thirds from auto exports.
Finance Minister Taro Aso reiterated Japan's intention to "further expand trade and investment between" between the two countries, in a "mutually beneficial manner". He also pointed to the joint statement made last September. However, Japan has been very clear on its intention to defend the multilateral trade pact TPP that it leads, and US quitted under Trump. Hence, no matter what Japan is going to offer to the US, they won't be something better than what's offered to TPP partners.Ja
Daily Markets Broadcast
Wall Street edges lower ahead of earnings season
US indices closed marginally lower yesterday on below-average volumes ahead of the Q1 reporting season, which kicks off today. UK PM Theresa May obtained a six month Brexit deadline extension. FOMC minutes showed most officials didn’t see the need for a rate hike this year.
US30USD Daily Chart

The US30 index edged marginally lower yesterday, recording the fourth down day in five days, after touching a six month high on Friday
The index is falling toward the 55-day moving average at 25,697
The Michigan consumer sentiment index is expected to drift down to 98.0 in April from 98.4 in March, adding to the uncertainty surrounding the state of the US economy.
DE30EUR Daily Chart

The Germany30 index rose for a second straight day yesterday as the Brexit deadline was pushed back to October
The index has held above the 23.6% Fibonacci retracement of the March 22 – April 4 rally at 11,856
Euro-zone industrial production data for February are expected to show a 0.6% contraction following a 1.4% increase in January.
UK100GBP Monthly Chart
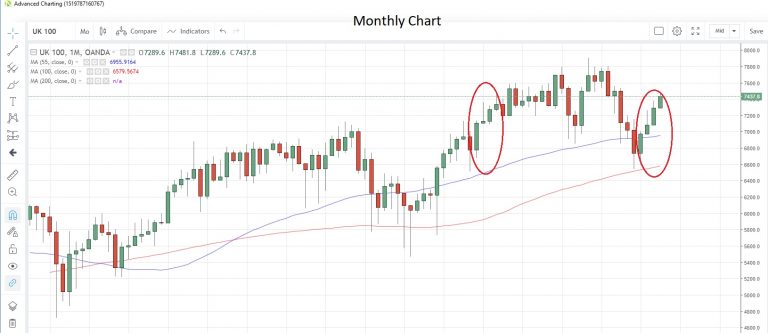
The UK100 index advanced for the first time in four days yesterday after the Brexit extension
The index looks on track for the fourth consecutive monthly gain now that the Brexit uncertainty has been pushed back temporarily. That would be the longest winning streak since the December 2017 – March 2017 run
The EU agreed that the UK would keep full membership rights during the extension period, which could end as soon as the Withdrawal Agreement was ratified by Parliament. UK could leave EU before June 30, and would not need to hold EU elections if a deal was reached by May 22.