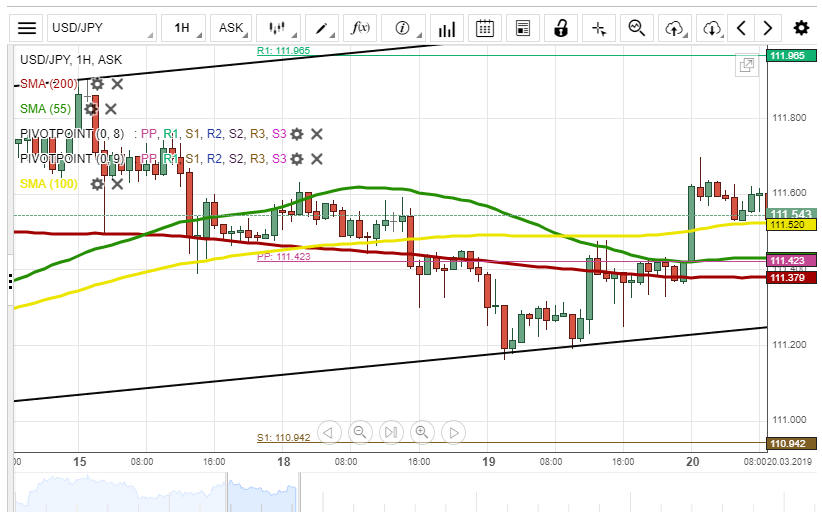
Sample Category Title
Bitcoin Is a Bubble, Yet Cryptotrading Still Works
The first major economic bubble is related to the very idea of public trading. The moment East India Company started selling stock, it had dozens of copycats. Most of them ended up disappointing their investors, being unable to keep up with the first corporate world power. Other people made a smart choice and invested in shipyards and ports — the infrastructure that the Company used. Not all of them succeeded, but the success rate was still much higher.
Since then, we’ve had California Gold Rush, Florida Real Estate Bubble, Stock Market Bubble of 1929, Stock Market Bubble of 1987, Dotcom Bubble and many smaller ones. The only people that made money off each of them were shop owners, realtors, brokers and domain providers.
The current bubble is built around cryptocurrency, and some say that it has already popped. However, there still are ways to make money off it without actually investing in crypto itself.
Why Investments Aren’t Working In Crypto
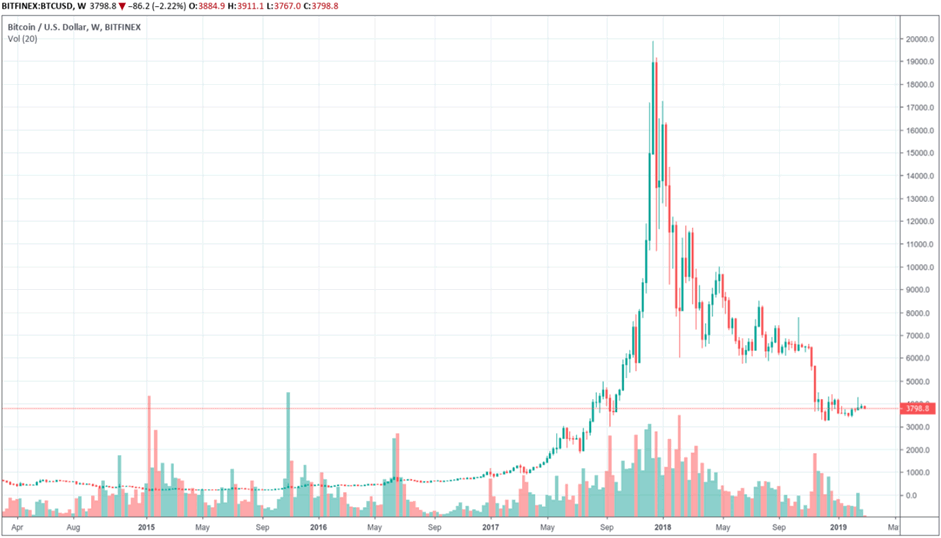
Investments need to grow in value with time. And cryptocurrency doesn’t do it anymore. Since January 2018, the price has been in a sharp decline. Occasionally it attempts a bullrush, but one has yet to stick.
Overall, unless you picked up crypto before December 2017, you are probably in the red right now.
Even those that invested in the cryptocurrency industry aren’t feeling too good. Thousands of ICOs turned out to be scams; others simply failed and quietly closed down. A small amount produced what they intended to do but still couldn’t survive in the bearish economy. The investors are now wary of crypto, and there is no way to attract more money to the market at the moment.
There still are people that invest in crypto and hope for it to grow, but they are not entirely reasonable. While the next bullrush may be right around the corner, there is very little evidence to that. However, there is another way to profit from cryptocurrency.
Trading Crypto As a Way to Make Money
Cryptocurrency market still has 130 billion USD of total capitalization — and all this money is actively moving around. Unlike the precious metals market, there is a lot of trading going on constantly — and you can make money on that trading.
There are even ways to trade on descending markets — so-called short-trading. The only problem with it is that you need a partner that holds a large amount of Bitcoin. In other words, you need a broker.
How To Trade Bitcoin Effectively
Cryptocurrency trading is not as developed as other types of trading. Most exchanges still use custom software which doesn’t have features like delayed orders or trailing stop loss. Those that have that features, like Coinbase Pro, come with their own limitations — i.e., you need to be a US citizen to open an account.
Right now, the best way to trade cryptocurrency is via the Forex channels — the brokers solved all those issues a long time ago. Most brokers use MetaTrader 4 and other advanced software that makes trading a lot easier and less risky. On the downside, you don’t own cryptocurrency you trade with them — which might be an issue if you suddenly decide to invest.
If you have no qualms about it — check out JustForex cryptocurrency accounts. Their system is remarkably stable and fast, which minimizes slippage. But, most importantly, they allow Bitcoin shorting and make trading on descending markets a breeze.
Open an account with JustForex right now, and they will double your deposit. Alternatively, you can open a demo account and test your understanding of trading before jumping into the fray.
The Analytical Overview Of The Main Currency Pairs
The EUR/USD currency pair
Technical indicators of the currency pair:
Prev Open: 1.13362
Open: 1.13506
% chg. over the last day: +0.15
Day's range: 1.13355 – 1.13570
52 wk range: 1.1214 – 1.2557
EUR/USD keeps consolidating. The financial market participants are waiting for the Federal Reserve's decision regarding the key interest rate, as well as updated FOMC forecasts. The majority of experts conclude that the FRS will keep the key interest rate around 2.25%-2.50% and will keep using a careful approach toward hardening the monetary policy. Right now the key trading range is 1.13250-1.13600. You should open positions from these levels.
At 20:00 (GMT+2:00), the Federal Reserve will decide on the key interest rate.
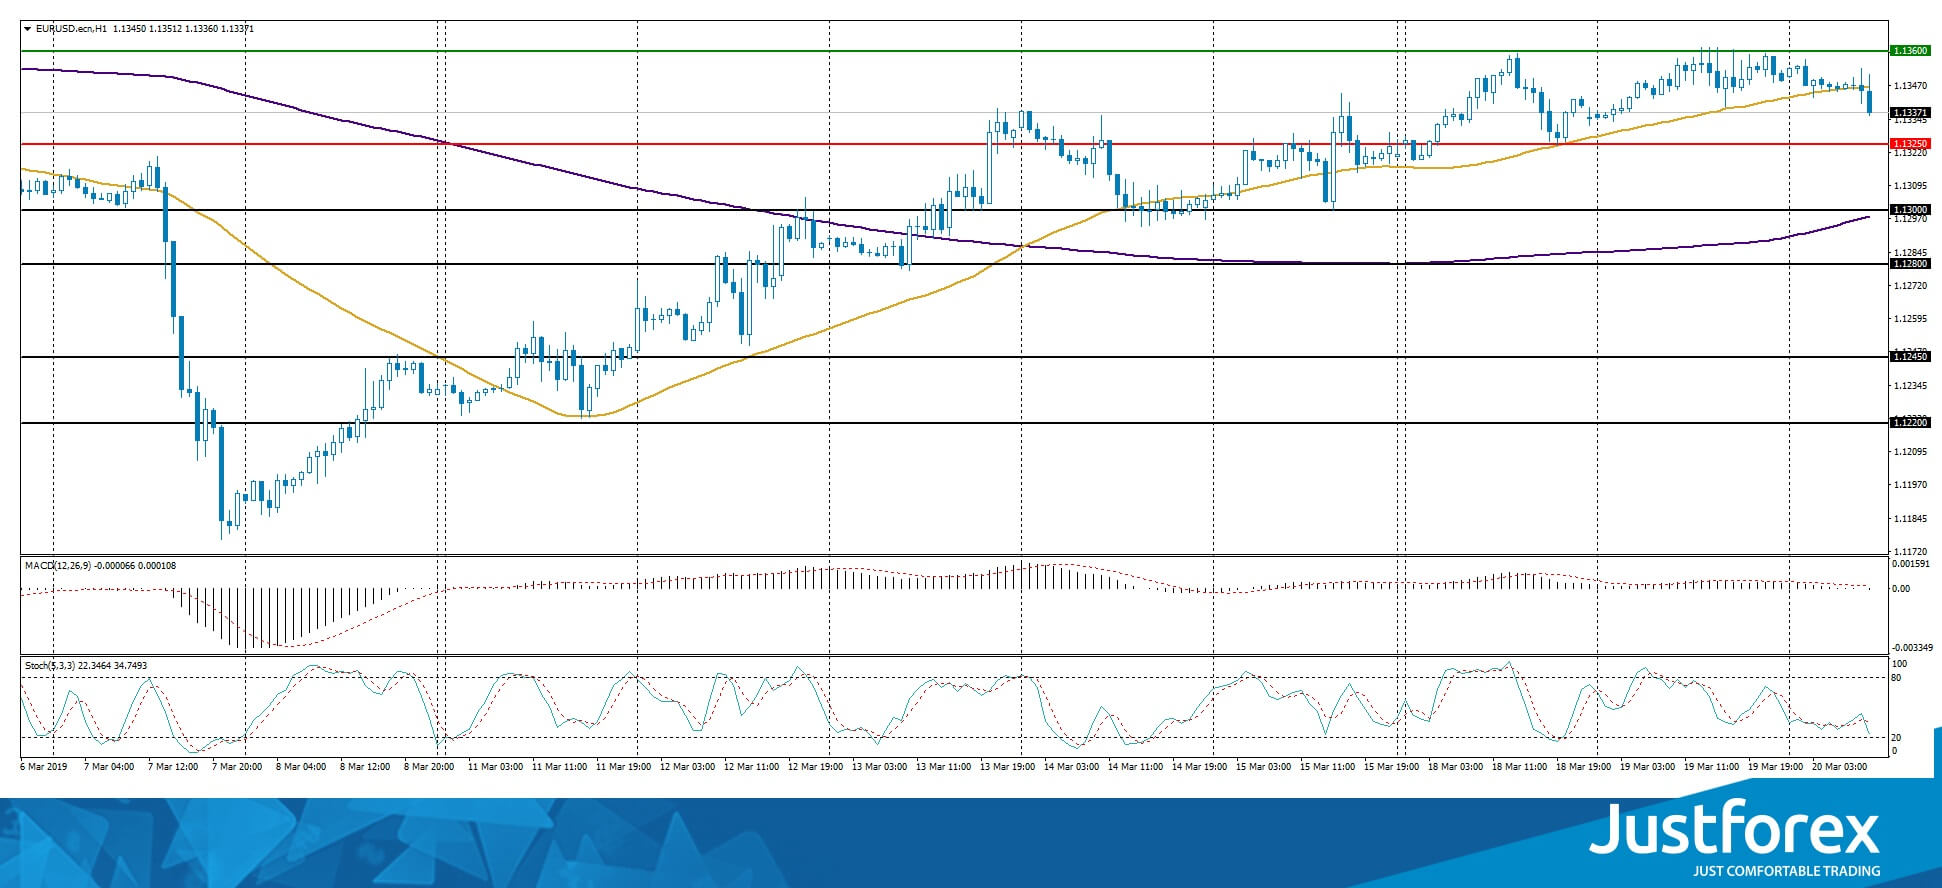
The indicators do not provide precise signals, the price has crossed 50 MA.
The MACD histogram is close to 0.
The Stochastic Oscillator is in the neutral zone, the %K line is crossing the %D line. There are no signals at the moment.
Trading recommendations
Support levels: 1.13250, 1.13000, 1.12800
Resistance levels: 1.13250, 1.13000, 1.12800
If the price fixes above the 1.13600, expect the quotes to grow toward 1.14000.
Alternatively, the quotes can descend toward 1.13000-1.12700.
The GBP/USD currency pair
Technical indicators of the currency pair:
Prev Open: 1.32466
Open: 1.32668
% chg. over the last day: +0.09
Day's range: 1.32125 – 1.32753
52 wk range: 1.2438 – 1.4378
The GBP/USD technical picture remains ambiguous. Yesterday the National Statistic Service published mixed labour market reports. The investors are waiting for new intel regarding Brexit. The local support and resistance levels are 1.32000 and 1.32600. You should open positions from these levels.
At 11:30 (GMT+2:00) the UK will publish a consumer price index.
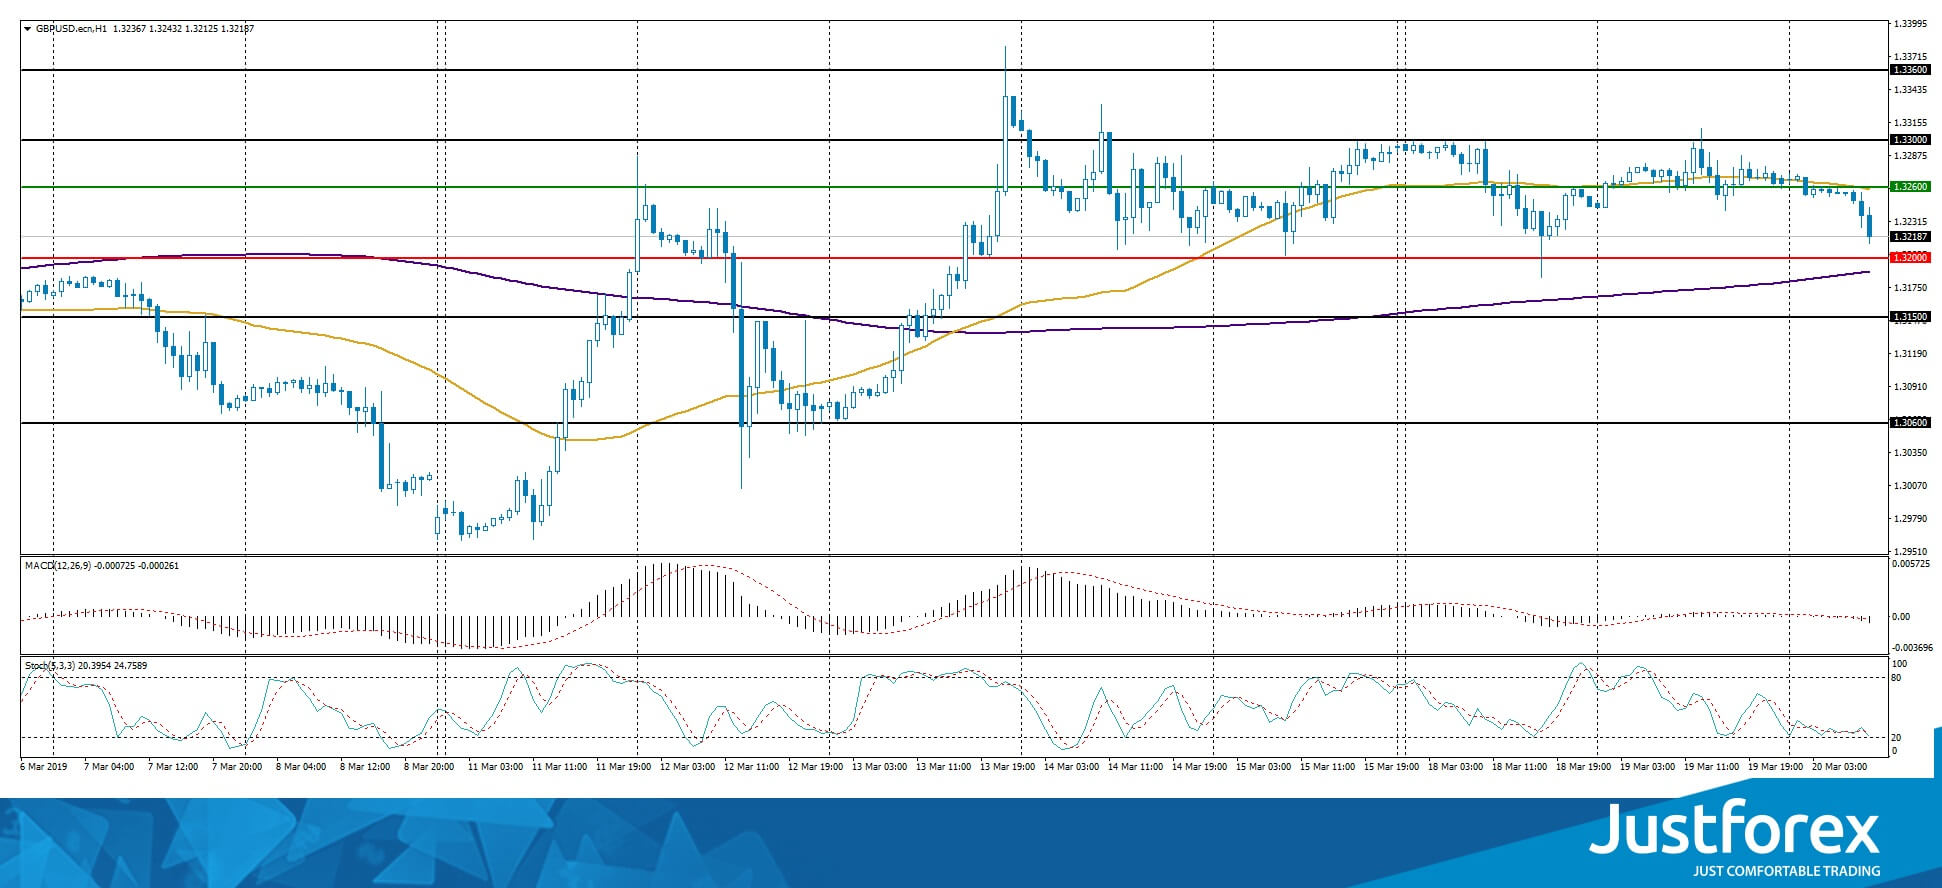
The indicators do not provide precise signals, the price fixed betwee 50 MA and 200 MA.
The MACD histogram started to descend, which points to the power of the sellers.
The Stochastic Oscillator is close to the oversold zone, the %K line is crossing the %D line. There are no signals at the moment.
Trading recommendations
Support levels: 1.32000,1.31500, 1.30600
Resistance levels: 1.32600, 1.33000, 1.33600
If the price fixes below the 1.32000, expect the quotes to fall toward 1.31500-1.31300.
Alternatively, the quotes can rise toward 1.33000-1.33500.
This article reflects a personal opinion and should not be interpreted as an investment advice, and/or offer, and/or a persistent request for carrying out financial transactions, and/or a guarantee, and/or a forecast of future events.
The USD/CAD currency pair
Technical indicators of the currency pair:
Prev Open: 1.33375
Open: 1.33246
% chg. over the last day: -0.10
Day's range: 1.33193 – 1.33455
52 wk range: 1.2248 – 1.3664
USD/CAD was very active yesterday but didn't have a definitive trend. Right now the quotes are testing the local resistance at 1.33450. The nearest support is at 1.33150. The financial market participants are waiting for the Federal Reserve's meeting. You should keep an eye on the oil quotes dynamics and open positions from the key levels.
The Economic News Feed for 20.03.2019 is calm.
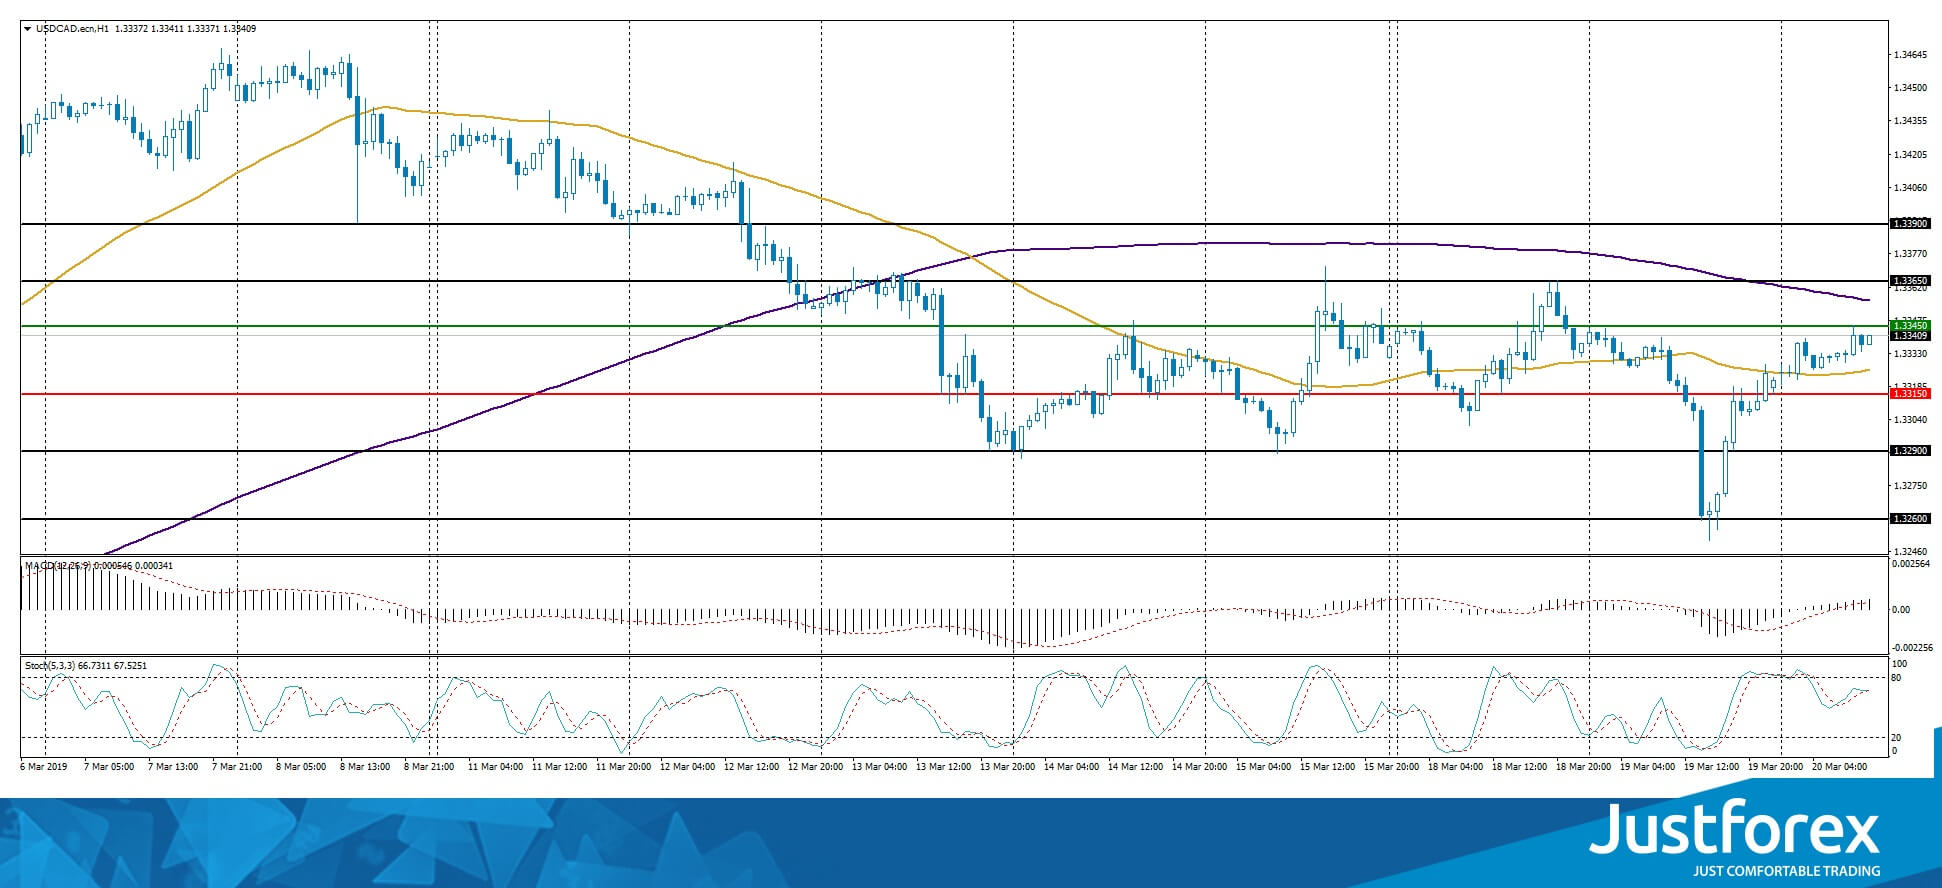
The indicators do not provide precise signals, the price fixed between 50 MA and 200 MA.
The MACD histogram is in the positive zone, which points towards the bullish mood.
The Stochastic Oscillator is in the neutral zone, the %K line is crossing the %D line. There are no signals at the moment.
Trading recommendations
Support levels: 1.33150, 1.32900, 1.32600
Resistance levels: 1.33450, 1.33650, 1.33900
If the price fixes below 1.33150, expect the quotes to fall toward 1.32800-1.32600.
Alternatively, the quotes can grow toward 1.33700-1.34000.
The USD/JPY currency pair
Technical indicators of the currency pair:
Prev Open: 111.443
Open: 111.398
% chg. over the last day: -0.02
Day's range: 111.360 – 111.695
52 wk range: 104.56 – 114.56
USD/JPY shows an ambiguous technical picture. The trading instrument keeps trading in a long flat. Right now the quotes are consolidating. The local support and resistance levels are 111.400 and 111.650. The investors are waiting for the Federal Reserve meeting regarding the key interest rate. You should open positions from the key levels.
The Economic News Feed for 20.03.2019 is calm.
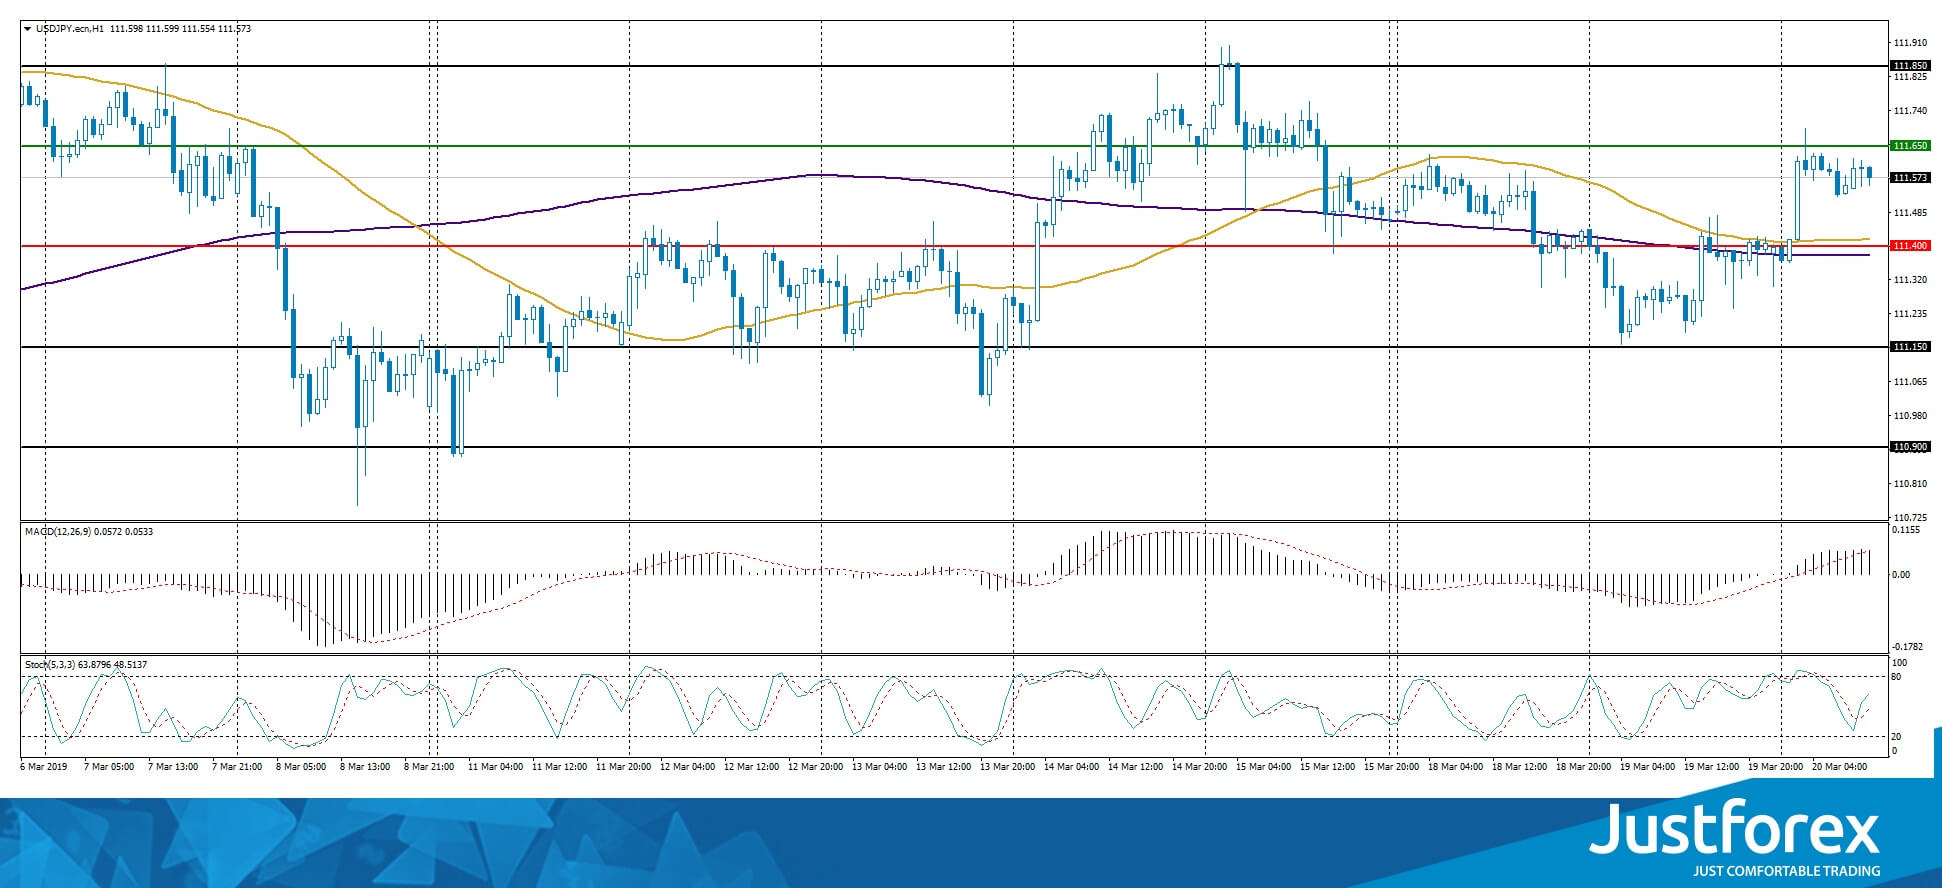
The indicators do not provide precise signals: 50 MA started to cross 200 MA.
The MACD histogram is in the positive zone and above the signal line, which gives a strong signal to buy USD/JPY.
The Stochastic Oscillator is in the neutral zone, the %K line is above the %D line, which points toward the bullish mood.
Trading recommendations
Support levels: 111.400, 111.150, 110.900
Resistance levels: 111.650, 111.850, 112.000
If the price fixes below the 111.400 local support, expect the quotes to fall toward 111.000.
Alternatively, the quotes can frow toward 111.850-112.000.
EURJPY Stretches Higher Within Ascending Channel
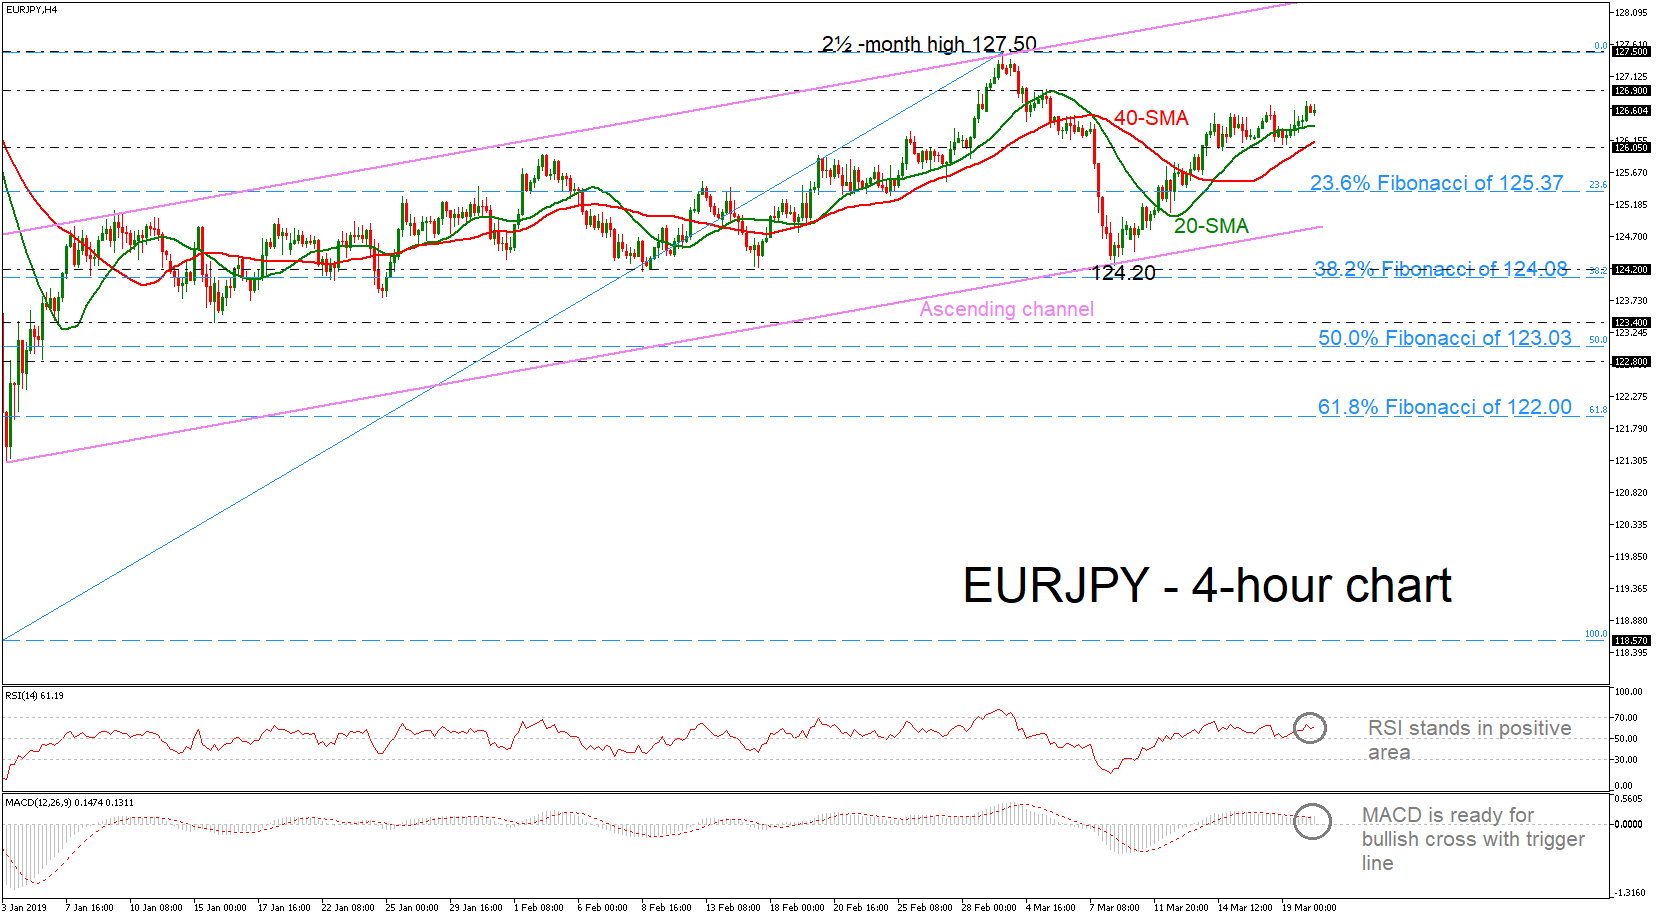
EURJPY is moving higher in the 4-hour chart after finding support at the lower boundary of the ascending channel, which has been holding since January 3. Furthermore, the pair is trading above the 20- and 40-simple moving averages (SMAs) in the 4-hour chart, while the RSI and the MACD are slightly rising in the positive area, suggesting a positive picture for the short term.
If the market pushes the pair higher, the price could re-challenge the immediate resistance of 126.90. More advances could also meet the two-and-a-half-month high of 127.50, identified by the peak on March 1, while an aggressive run above this line and the upper bound of the channel of 128.00 could open the door for the 128.40 barrier.
On the other side, if the market moves lower in the near term, the pair could touch the 126.05 support and the 40-SMA. In case of an extension lower, the 23.6% Fibonacci retracement level of the upleg from 118.57 to 127.50, around 125.37, could come in focus.
Note that in the longer timeframe, the price remains in a bearish structure following the pullback on 133.10, but in the short term, only an advance above the ascending channel could bring the bullish outlook back into play.
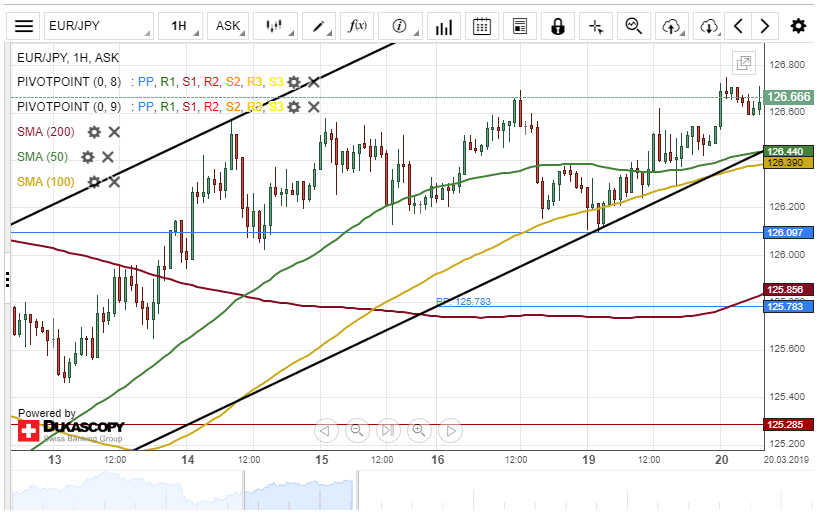
EUR/JPY Supported By 100-Hour SMA
During Tuesday's trading session, the Eurozone single currency was trading near the lower boundary of a medium-term ascending channel pattern. The 100-hour simple moving average provided support for the pair at 126.30.
As for the near future, it is expected that the 50– and 100-hour SMAs will drive the EUR/JPY exchange rate towards a resistance level formed by the weekly R1 at 127.08.
If the resistance level as mentioned above holds, the currency exchange rate will make a brief retracement towards the 126.63 region within this session.
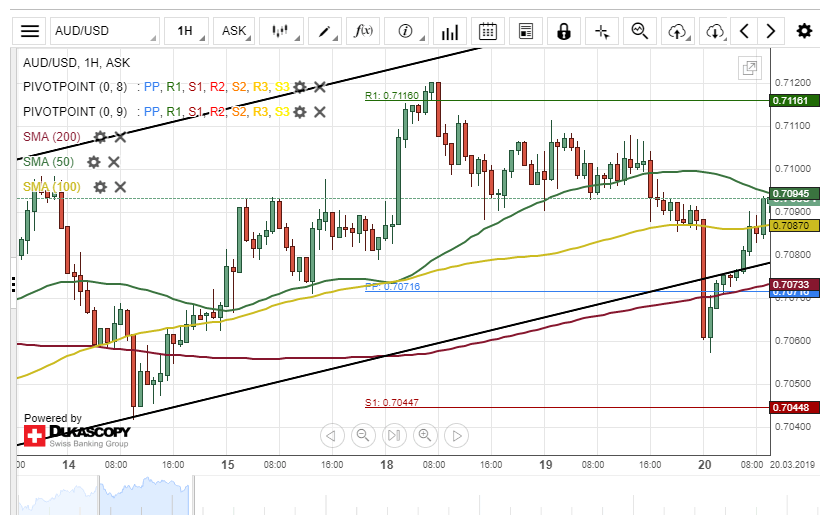
AUD/USD Await US Macroeconomic Data Releases
During the last 48 hours, the Australian Dollar has depreciated about 0.73% in values against the US Dollar. The currency pair breached the 50-, 100– and 200-hour SMAs during Tuesday's trading session.
However, today's trading session began with an upside movement. By the middle of the day, the exchange rate has dashed through the 100– and 200-hour simple moving averages and currently aiming for the 50-hour SMA at 0.7095.
Meanwhile, Wednesday's US macroeconomic data releases might add more pressure to the currency exchange rate.
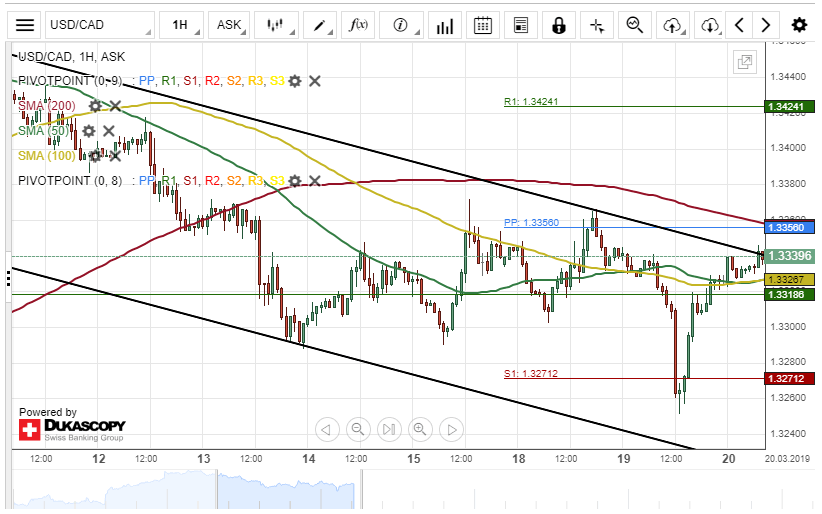
USD/CAD Awaits FOMC Statement
The US Dollar traded with high volatility against the Canadian Dollar on Tuesday. The Greenback lost about 93 base points during the first part of yesterday's trading session. Nevertheless, during the last 24 hours, the currency pair had regained its lost positions.
In regards to the near-term future, most likely, the currency exchange rate will surge towards the weekly pivot point at 1.3424. It is important to note that the 50– and 100-hour SMAs should support the surge within this session.
However, Wednesday's US macroeconomic data releases might add more pressure to the currency exchange rate.
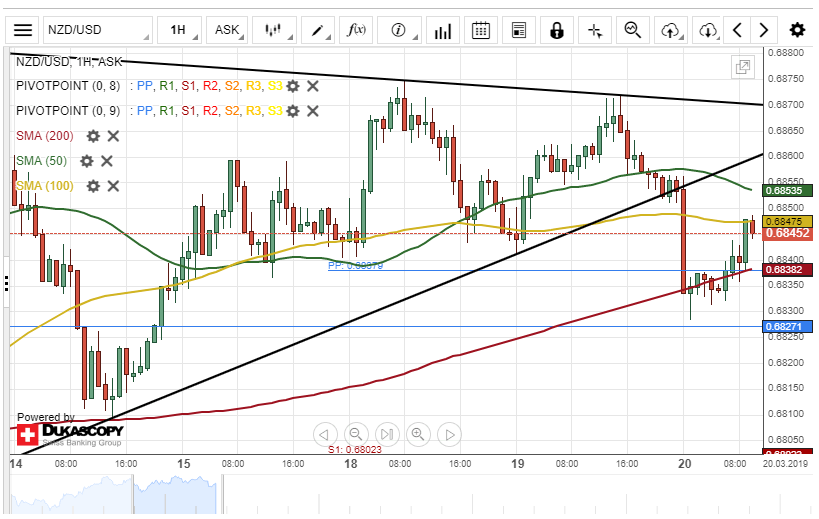
NZD/USD Awaits Federal Fund Rate
The New Zealand Dollar has depreciated about 0.64% in values against the US Dollar. The decline was stop by a support level formed by the 200-hour simple moving average at 0.6830.
Everything being equal, it is likely that the currency exchange rate will regain some of its lost positions within this session. The potential upside target will be near a resistance level formed by the 50-hour SMA at 0.6854.
However, Wednesday's US macroeconomic data releases might add more pressure to the currency exchange rate.
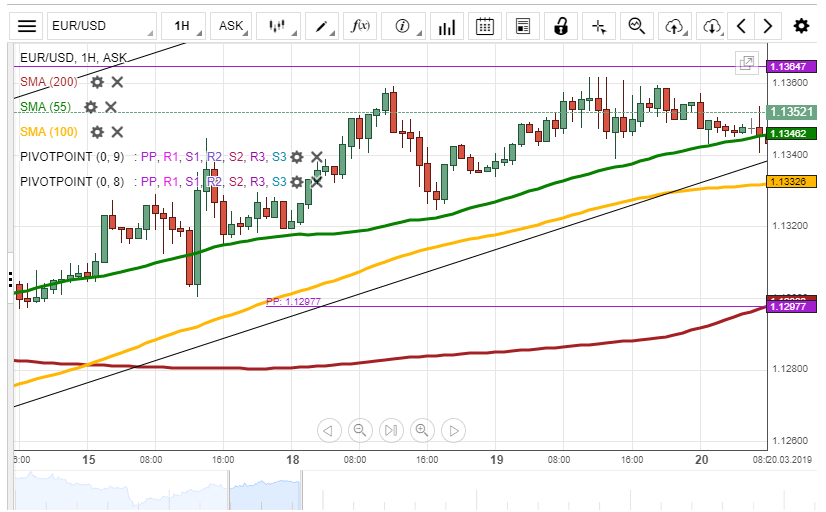
EUR/USD Could Break Monthly PP At 1.1364
During Tuesday's trading session, the currency exchange rate surged to 1.1360 level as it was predicted! On Wednesday morning, the rate was located between the 55-hour and the 100-hour simple moving averages at the 1.3437 mark.
It is expected that the 100-hour simple moving average will support the rate at the 1.1330 mark to push it to the 1.1355 mark.
In addition, today's US Federal Funds Rate, FOMC Statement release at 18:00 GMT, might push the rate to break the resistance level of the monthly pivot point at 1.1364 to trade at the 1.1370 level.
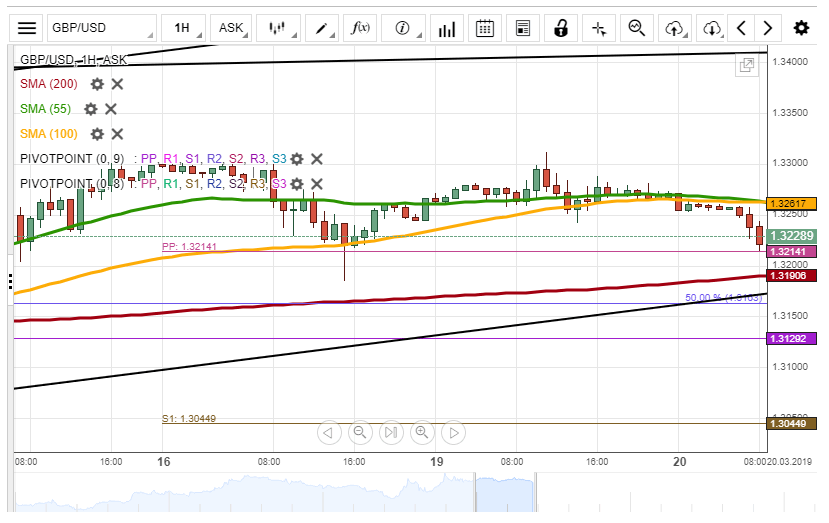
GBP/USD Depreciated To 1.3200
During Tuesday's trading session, the 100-hour simple moving average supported the rate to reach the 1.3300 level. During Wednesday's morning hours, the 55-hour and the 100-hour simple moving averages retraced the rate to the 1.3222 mark.
In regards to the near-term future, most likely, the 200-hour simple moving average will support the currency exchange rate to push it to trade at the 1.3250 level.
On the other hand, today's UK CPI release at 9:30 GMT might push the rate to pass through the support level towards the 50.00% Fibo at the 1.3163 mark.
USD/JPY Is Supported By 100-Hour SMA
During Tuesday's trading session, the support levels of the 55-hour SMA together with the weekly pivot point at 111.42 pushed the currency exchange rate to break the resistance level of the 100-hour SMA. On Wednesday morning, the rate was supported by the 100-hour SMA to be located at the 111.57 mark.
In regards to the near-term future, most likely, the 100-hour SMA will continue to support the rate for the rest of the trading session. It is expected that the rate might end the day at the 111.80 level.
On the other hand, today's US Federal Funds Rate, FOMC Statement release at 18:00 GMT might push the rate to pass through most of the technical indicators to the bottom boundary of the pattern line at 111.30 mark.