Sample Category Title
The Analytical Overview Of The Main Currency Pairs
The EUR/USD currency pair
Technical indicators of the currency pair:
Prev Open: 1.13039
Open: 1.13255
% chg. over the last day: +0.19
Day's range: 1.13190 – 1.13507
52 wk range: 1.1214 – 1.2557
EUR/USD is in a bullish mood. Right now EUR is consolidating around the monthly maximums. The trading instrument is testing the local resistance at 1.13500. 1.13250 acts as a mirror support. The US is publishing weak economic releases, which puts pressure on the American currency. This week, the Federal Reserve will have a meeting regarding new intel on the further increase of interest rates. Earlier the Fed representatives mentioned that the Reserve won`t pursue this increase. You should open positions from the key levels.
The Economic News Feed for 18.03.2019 is calm. At 12:00 (GMT+2:00) the EU will publish the report on the trading balance.
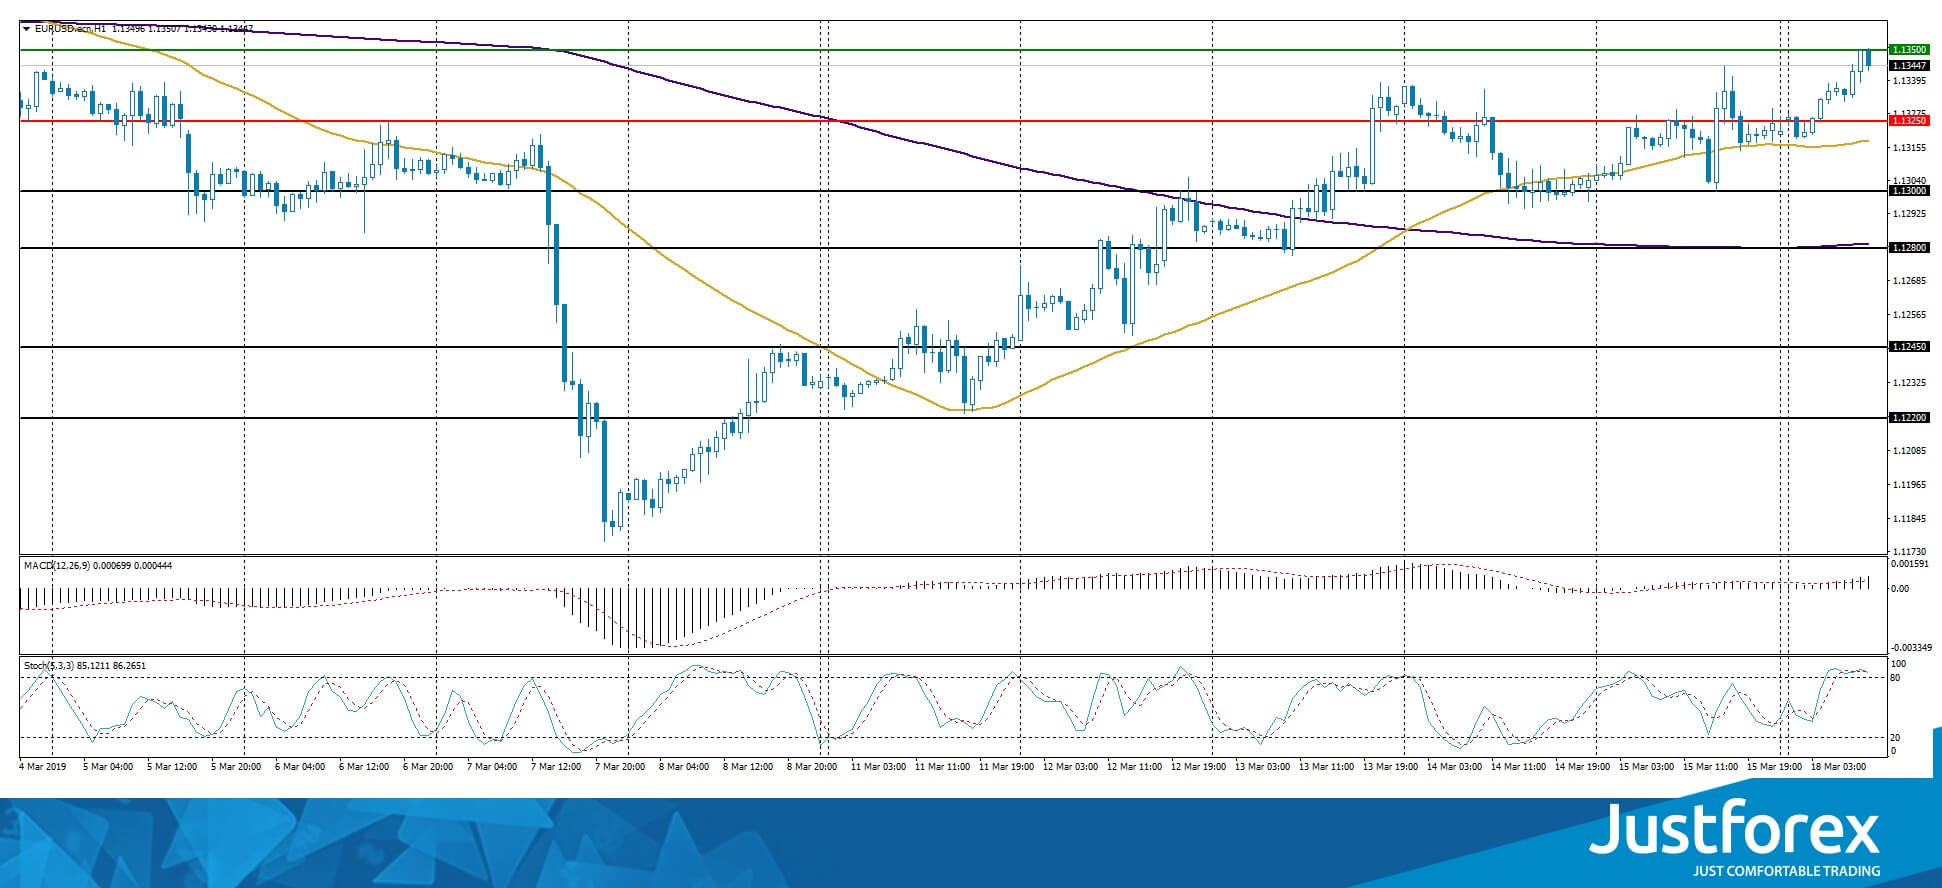
The price fixed above 50 MA and 200 MA which points to the power of the buyers.
The MACD histogram is in the positive zone and keeps rising, which gives a signal to buy EUR/USD.
The Stochastic Oscillator is in the overbought zone, the %K line is crossing the %D line. There are no signals at the moment.
Trading recommendations
Support levels: 1.13250, 1.13000, 1.12800
Resistance levels: 1.13500, 1.14000
If the price fixes above the local resistance of 1.13500, expect the quotes to grow toward 1.14000..
Alternatively, the quotes can descend toward 1.13000-1.12800.
The GBP/USD currency pair
Technical indicators of the currency pair:
Prev Open: 1.32608
Open: 1.32955
% chg. over the last day: +0.38
Day's range: 1.32560 – 1.32997
52 wk range: 1.2438 – 1.4378
GBP/USD stablilized after the surge of volatility last week. The House of Commons did not approve the new deal regarding Brexit and decided to ask for a delay. Right now the key support and resistance lvels are 1.32200 and 1.33000. The financial market participants are waiting for the new intel regarding Brexit. You should open positions from the key levels.
The Economic News Feed for 18.03.2019 is calm.
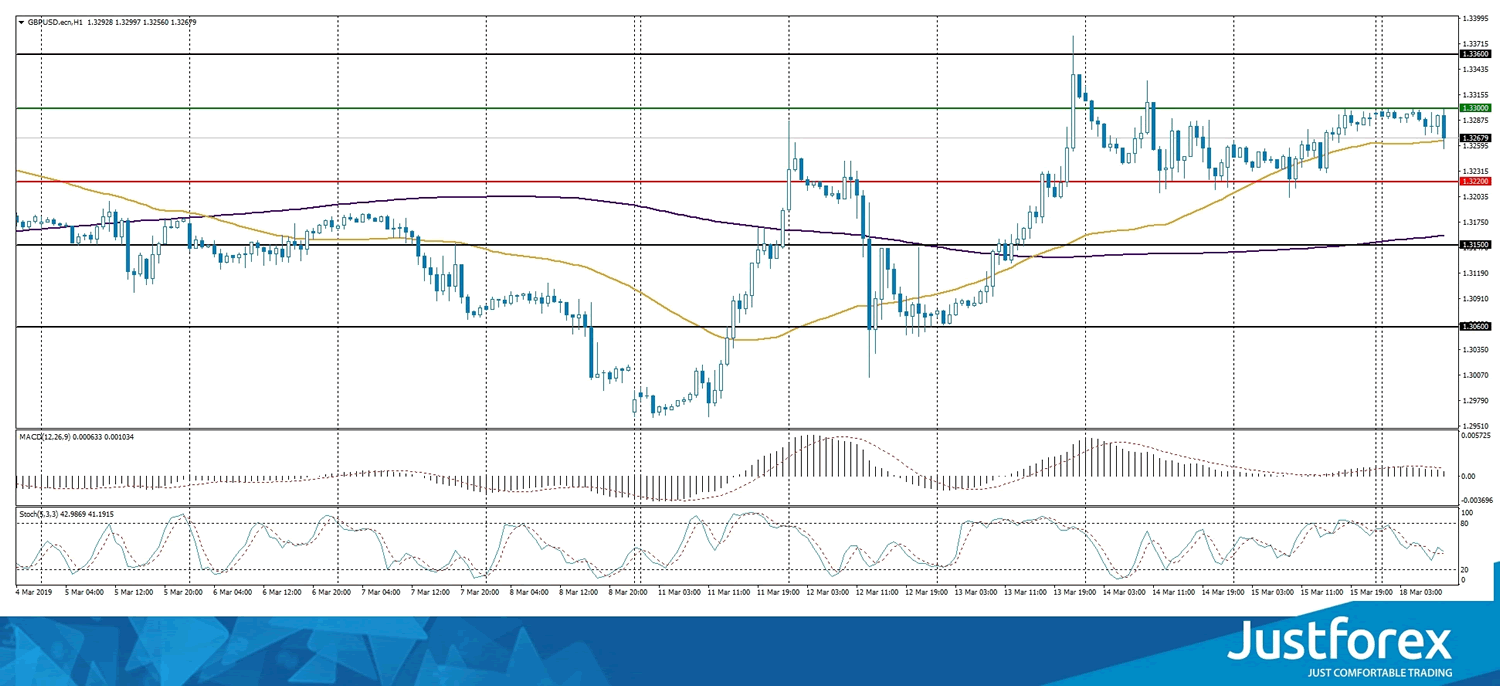
The indicators do not provide precise signals, the price has crossed 50 MA.
The MACD histogram is in the positive zone but below the signal line which gives a weak signal to buy GBP/USD.
The Stochastic Oscillator is in the neutral zone, the %K line is crossing the %D line. There are no signals at the moment.
Trading recommendations
Support levels: 1.32200, 1.31500, 1.30600
Resistance levels: 1.33000, 1.33600
If the price fixes above the round 1.33000, expect the quotes to grow toward 1.33500-1.33750.
Alternatively, the quotes can fall toward 1.32000-1.31500.
This article reflects a personal opinion and should not be interpreted as an investment advice, and/or offer, and/or a persistent request for carrying out financial transactions, and/or a guarantee, and/or a forecast of future events.
The USD/CAD currency pair
Technical indicators of the currency pair:
Prev Open: 1.33305
Open: 1.33316
% chg. over the last day: +0.01
Day's range: 1.33015 – 1.33471
52 wk range: 1.2248 – 1.3664
USD/CAD has an ambiguous technical picture. The CAD is being traded in a flat. Right now the local support and resistance levels are 1.33000 and 1.33300. The quotes have a tendency to descend further. You should keep an eye on the oil quotes dynamic and open positions from the key levels.
The Economic News Feed for 18.03.2019 is calm.
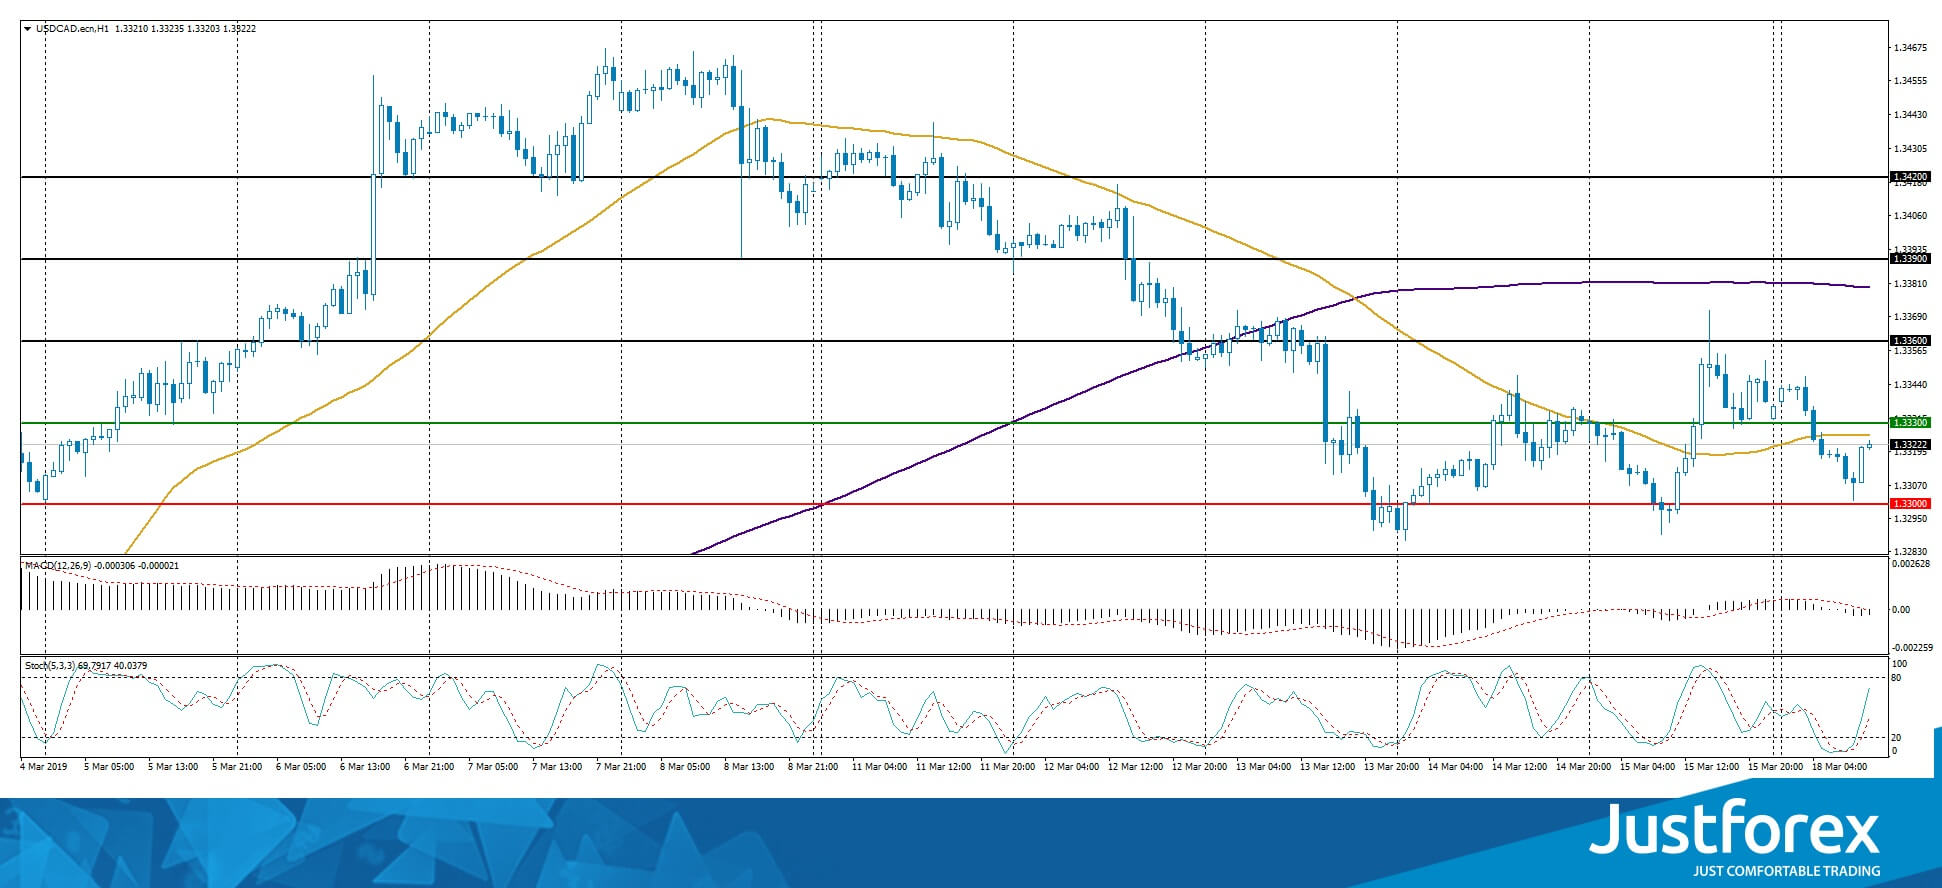
The indicators do not provide precise signals, the price is testing 50 MA.
The MACD histogram is in the negative zone, the %K line is above the %D line which points towards the fall of USD/CAD.
The Stochastic Oscillator is in the neutral zone, the %K line is above the %D line which points toward a bullish mood.
Trading recommendations
Support levels: 1.33000, 1.32750, 1.32500
Resistance levels: 1.33300, 1.33600, 1.33900
If the price fixes below the round 1.33000, expect the quotes to fall toward 1.32700-1.32500.
Alternatively, the quotes can grow toward 1.33500-1.33700.
The USD/JPY currency pair
Technical indicators of the currency pair:
Prev Open: 111.655
Open: 111.466
% chg. over the last day: -0.22
Day's range: 111.450 – 111.629
52 wk range: 104.56 – 114.56
USD/JPY remains ambiguous. The trading instrument keeps consolidating around 111.400-111.650. The USD remains under pressure, the quotes can descend further. Keep an eye on the US Treasury bonds` yield and open positions from the key levels.
During the Asian trading session Japan published mixed trading balance reports.
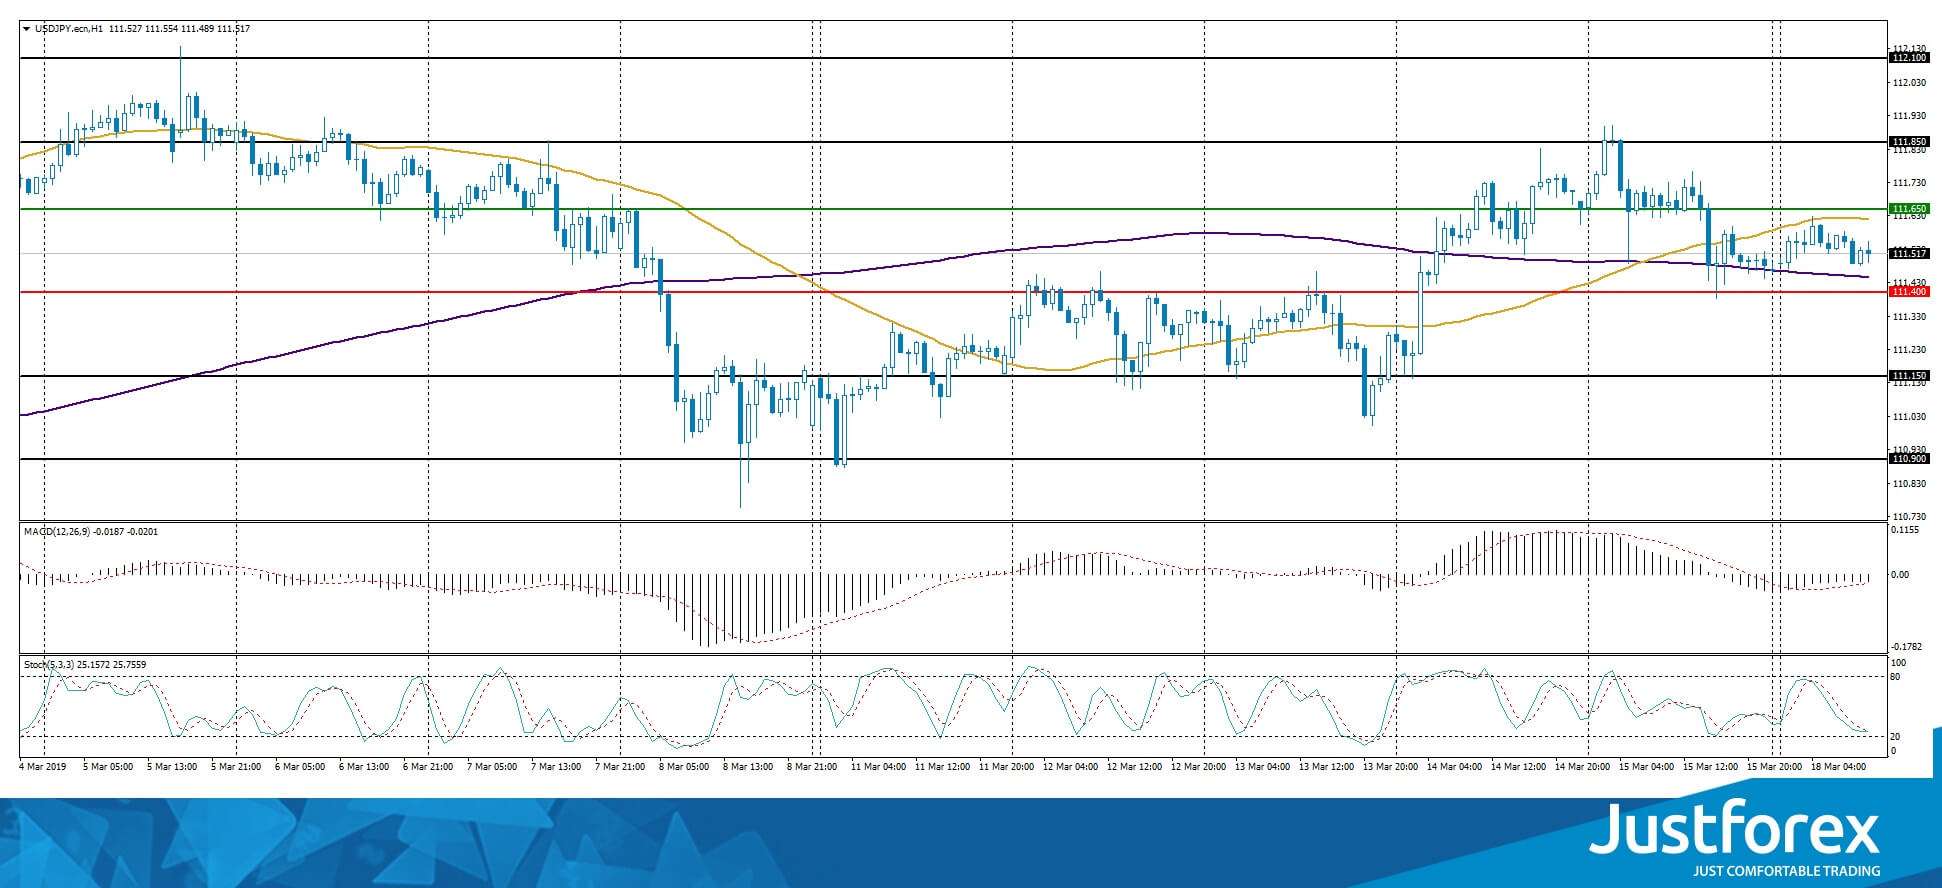
The indicators do not provide precise signals, the price has crossed 50 MA and 200 MA.
The MACD is in the negative zone but above the signal line, which gives a weak signal to sell USD/JPY.
The Stochastic Oscillator is in the neutral zone, the %K line is crossing the %D line. There are no signals at the moment.
Trading recommendations
Support levels: 111.400, 111.150, 110.900
Resistance levels: 111.650, 111.850, 112.100
If the price fixes below 111.400, expect the quotes to fall toward 111.000-110.800.
Alternatively, the quotes can grow toward 111.850-112.000.
USD Down Ahead FOMC Meeting, Brexit In Focus
Brexit's end-game
Tomorrow Tuesday European Union ministers of European affairs will meet to discuss extending Brexit's deadline beyond 29 March. Meanwhile, the UK government will for the third time try to pass its ‘deal' through Parliament. If it passes, the government will ask for an extension to 30 June. If not, a frenzied scramble will start to find acceptable model prior to 29 March. Markets are pricing the deal to pass and the extension to be granted. One month implied volatility on GBP is subdued well off recent highs. EUR/GBP is trading just off one-year lows. Gilts continue to track lower as well.
Traders should remain vigilant in an environment politically charged and fluid. EUR/CHF might be a smarter play. EUR/CHF has been the barometer for Euro-centric risk and the pair still brings a Brexit risk premium (with a weak EU economy, Italian budget and dovish ECB risk). As probability for a UK crash-out fades, investors will reallocate from CHF back into Euro. The SNB will provide no barrier to EUR/CHF strength, giving EUR/CHF upside plenty of space.
USD slides further ahead of FOMC meeting
Since March 8th, the greenback has been trading in one direction: downward. The dollar index, which tracks the performance of the US dollar against a basket of its peers, has lost more 1.30% in the days following the ECB meeting – and Draghi's infamous dovish speech. On Monday morning, the modd was no different in the FX market, the back continued to retreat against the single currency with EUR/USD hitting 1.1351, its highest level since March 4th. Only the pound sterling was losing ground, thanks to heightened uncertainty stemming from the Brexit deadlock. GBP/USD slid 0.38% to $ 1.3240 during the early European session.
For now, it looks like investors anticipate the Fed would maintain its dovish stance, something with which we agree, and have therefore continued to load on equities. However, we believe that the market is under-pricing a potential massive downside revision to economic forecast. Indeed, the Fed will released an updated version of its forecast and given the lacklustre economic data that have been publish since the December meeting, there is little doubt it won't be pretty. Therefore, we anticipate that both equities and the buck will suffer this week, as investors will be forced to price in slower economic growth and weaker inflation.
EUR/JPY Bullish Sentiment Today
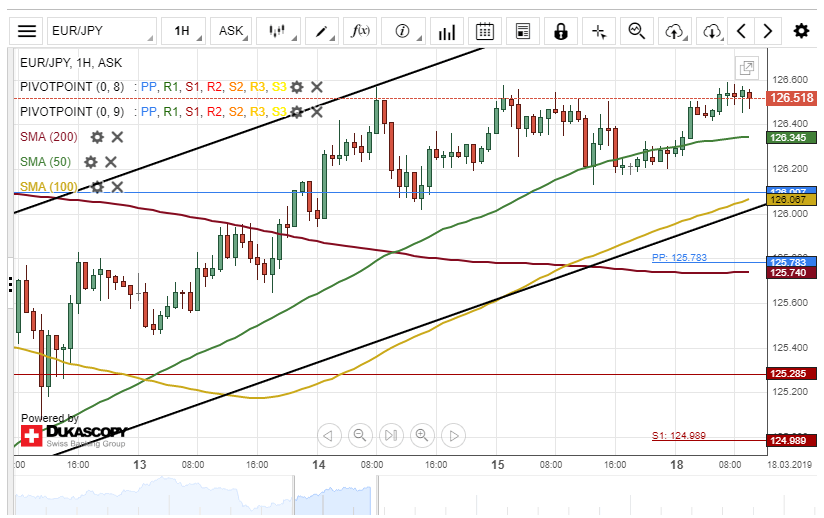
During Friday's trading session, the common European currency depreciated about 42 base points against the Japanese Yen. The decline was stopped by a support level formed by the 50-hour simple moving average at 126.15.
As for the near future, it is likely that the currency exchange rate maintains a junior ascending channel pattern. The potential upside target will be near the upper boundary of the channel at 127.08.
However, the EUR/JPY currency pair could reverse from the current level at 126.54 and aim for the 100-hour SMA at 126.03 during the following trading session.
AUD/USD Moving Towards Target
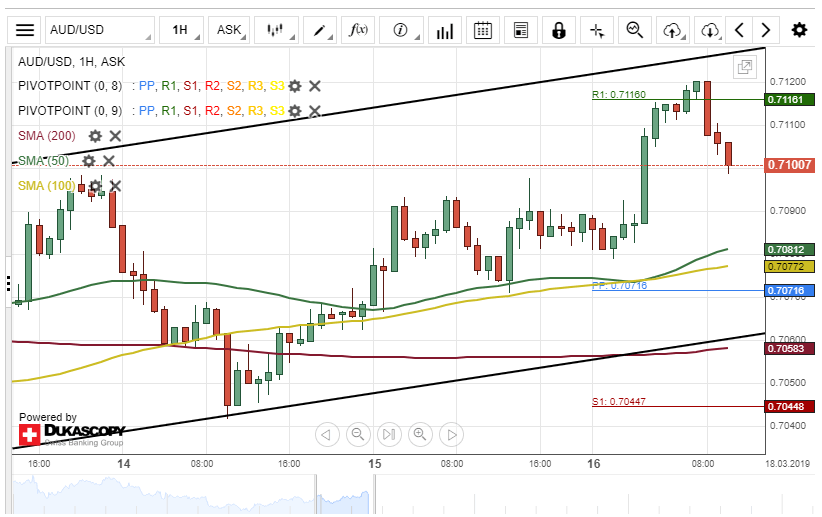
The Australian Dollar has appreciated about 0.70% in values against the US Dollar since Friday's trading session. The currency pair tested a resistance level formed by the weekly R1 at 0.7116 during the morning hours of today's session.
After hitting the weekly resistance level as mentioned above, the exchange rate began to decline. The possible downside target for bearish traders will be near the bottom end of a bullish engulfing candlestick formation at 0.7091.
If the support level at 0.7091 holds, the currency exchange rate will continue its upside movement during the following trading session.
EUR/USD Might Break PP At 1.1364
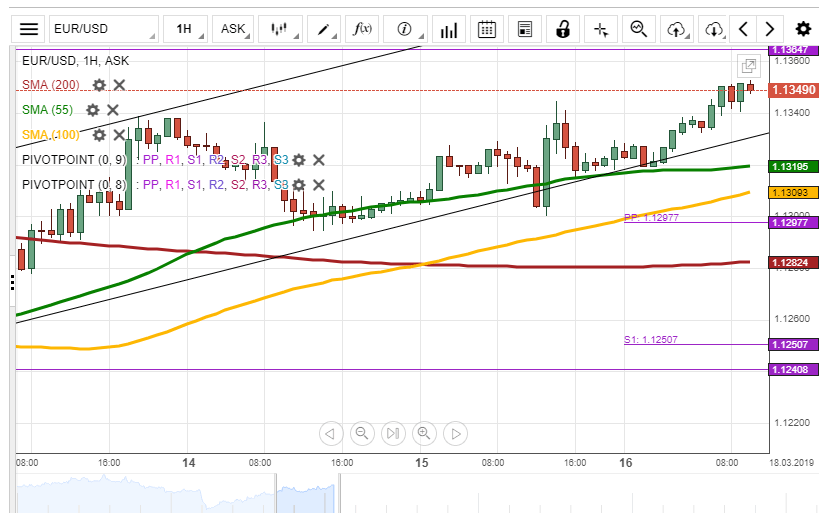
During Friday's trading session, the European Single Currency was supported by the 55-hour simple moving average to trade sideways at 1.1320. On Monday morning, the rate was located at the 1.1344 mark.
In regards to the near-term future, it is expected that the European Single Currency will appreciate against the US Dollar to break the monthly pivot point at the 1.1364 mark. Besides, most likely, the rate will end the trading session at the 1.1360 level.
On the other hand, the resistance level of the monthly pivot point at the 1.1364 mark could retrace the rate to the 1.1340 level.
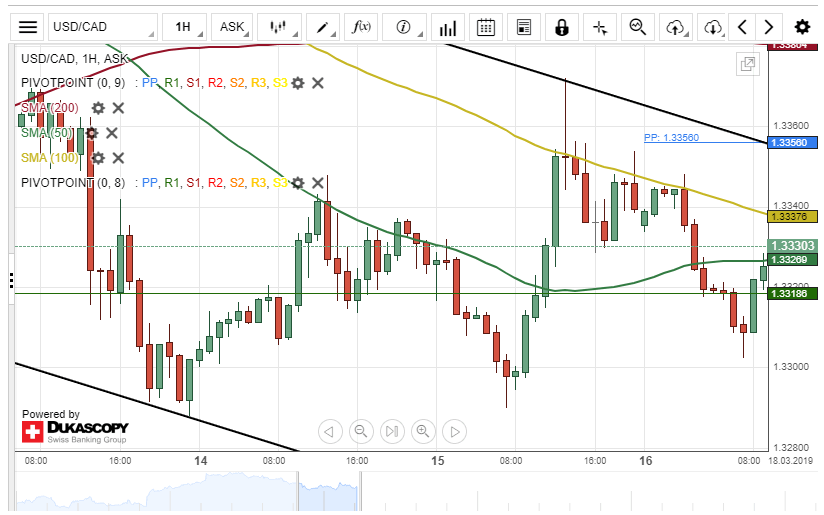
USD/CAD Likely To Maintain Channel
The US Dollar appreciated about 80 base points against the Canadian Dollar on Friday. The currency pair tested the upper boundary of a descending channel pattern during Friday's trading session.
Today's trading session began with a bearish sentiment. By the middle of the European session, the Greenback had depreciated about 0.37% in values against its Canadian counterpart.
By and large, it is likely that the USD/CAD currency exchange rate will maintain its descending channel pattern today. The possible downside target for bearish traders will be near a support level at 1.3271.
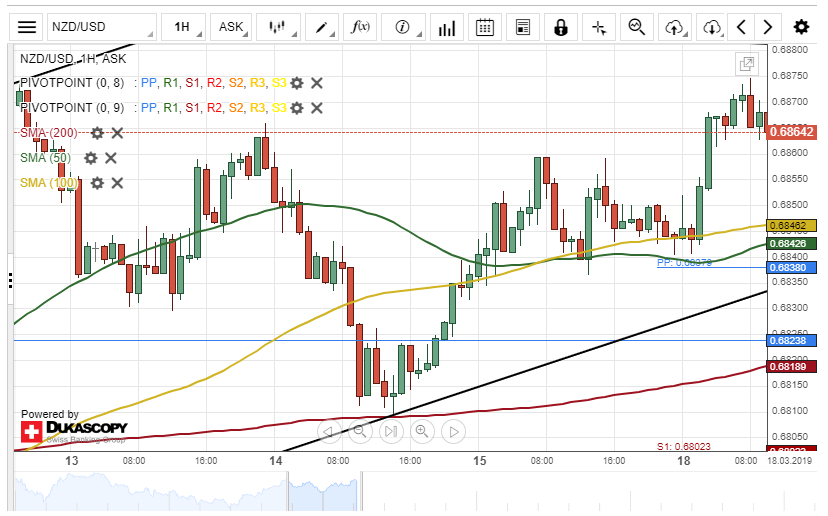
NZD/USD Decline Insight
The New Zealand Dollar is gradually making a new higher highs and lower lows since the currency pair bounced off a support level formed by the 200-hour simple moving average at 0.6809 on March 14.
The exchange rate tested a resistance level formed by the upper boundary of a downtrend line at 0.6874 during the morning hours of Monday's trading session.
Everything being equal, it is likely that the NZD/USD currency exchange rate could aim for a support cluster set by the combination of the 50– and 100-hour SMAs at 0.6845 during the following trading session.
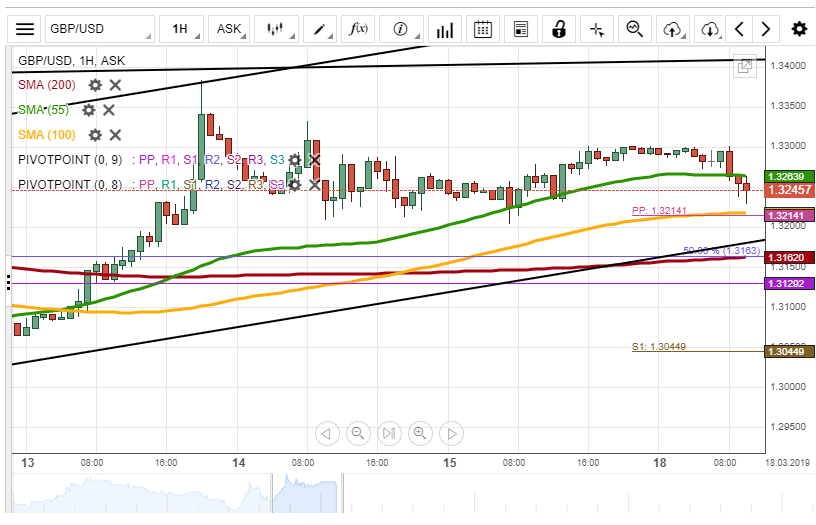
GBP/USD Could Depreciate To 50.00% Fibo
During Friday's trading session, the 55-hour simple moving average supported the British Pound to trade sideways at 1.3250. On Monday morning, the rate passed the support level of the 55-hour SMA to be located at the 1.3240 mark.
In regards to the near-term future, most likely, the support levels of the 100-hour simple moving average and the weekly pivot point at 1.3214 might push the rate to surge towards the 1.3350 level.
On the other hand, the rate could pass through the weekly pivot point at 1.3214 to trade towards the 50.00% Fibonacci retracement level at the 1.3163 mark.
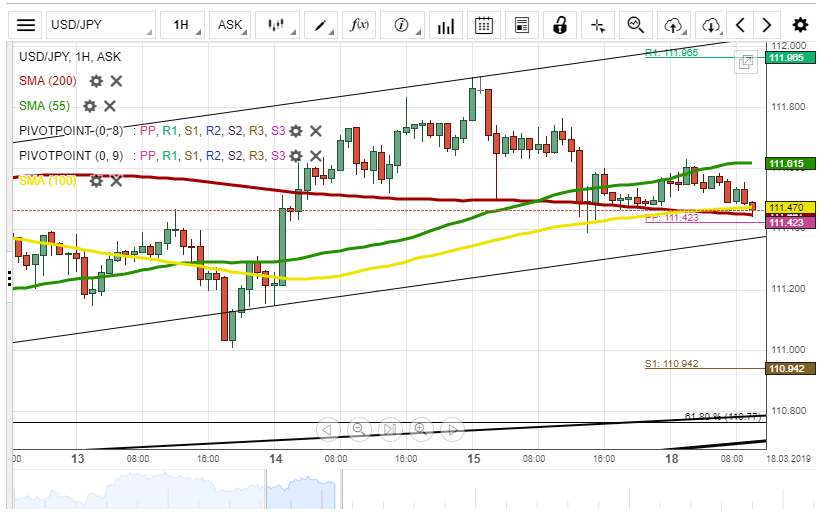
USD/JPY Will Stay At 111.60 Level
During Friday's trading session, the 100-hour simple moving average supported the rate to end the trading session at 111.40. On Monday morning, the rate was trading between the 55-hour and the 100-hour simple moving averages at the 111.51 mark.
It is expected, that the currency exchange rate will be trading sideways to end the trading session at the 111.60 level.
On the other hand, the support levels of the 200-hour and the 100-hour simple moving averages could push the US Dollar to appreciate against the Japanese Yen towards the 111.80 level.
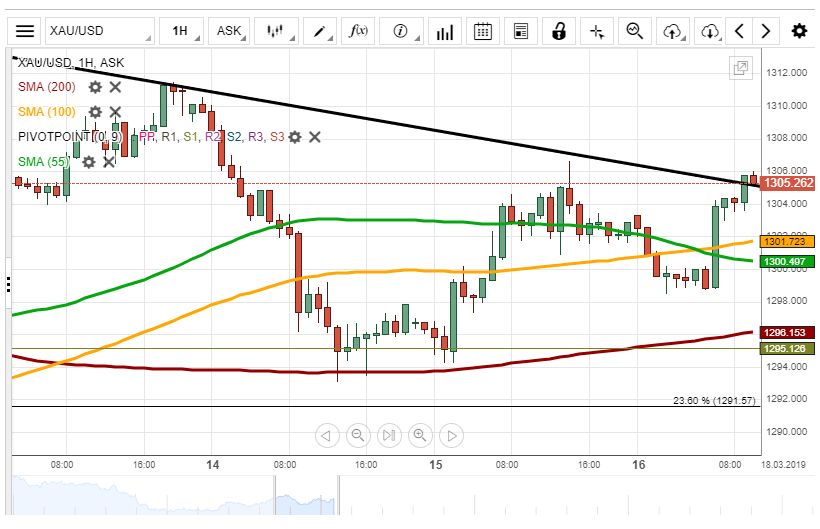
XAU/USD Will Surge To 1,310.00
During Friday's trading session, the yellow metal passed through the support levels of the 55-hour and the 100-hour simple moving averages to end the trading session at 1,298.00. On Monday morning, gold was located at the upper boundary of the medium pattern line at the 1,305.17 mark.
In regards to the near-term future, most likely, the yellow metal will break the medium pattern line to surge to the 1,310.00 level.
On the other hand, the medium, pattern line could retrace the yellow metal to end the trading session at the 1,302.00 level.