

Sample Category Title
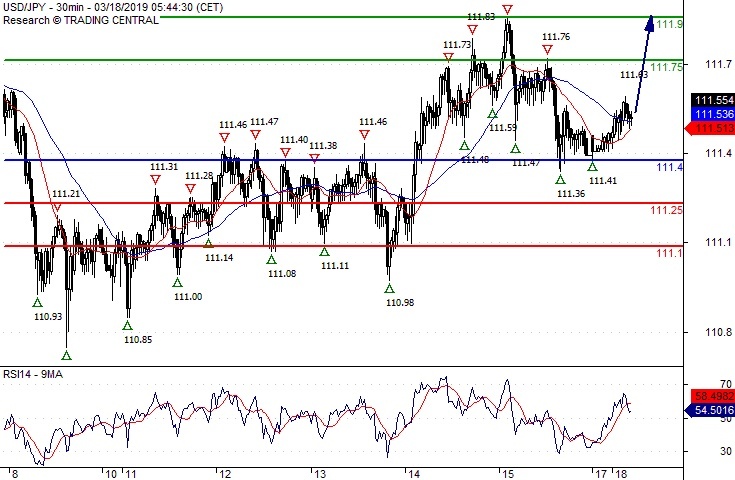
USD/JPY Turning Up
Pivot (invalidation): 111.40
Our preference Long positions above 111.40 with targets at 111.75 & 111.90 in extension.
Alternative scenario Below 111.40 look for further downside with 111.25 & 111.10 as targets.
Comment The RSI calls for a new upleg.
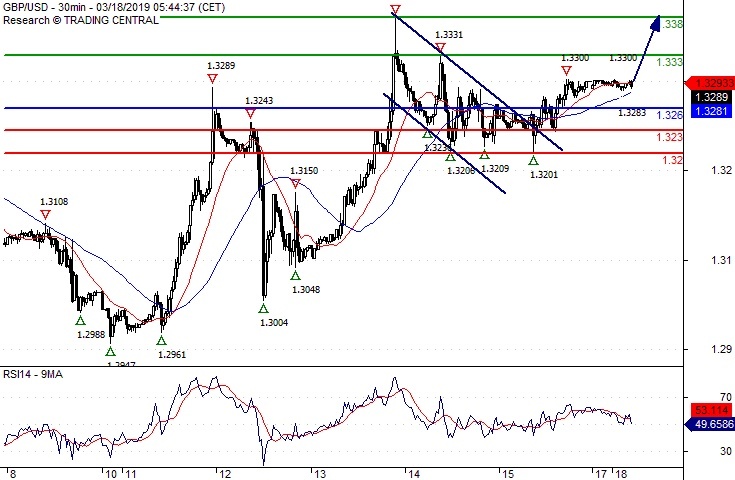
GBP/USD Watch 1.3380
Pivot (invalidation): 1.3260
Our preference Long positions above 1.3260 with targets at 1.3330 & 1.3380 in extension.
Alternative scenario Below 1.3260 look for further downside with 1.3230 & 1.3200 as targets.
Comment The RSI has just landed on its neutrality area at 50% and is turning up.
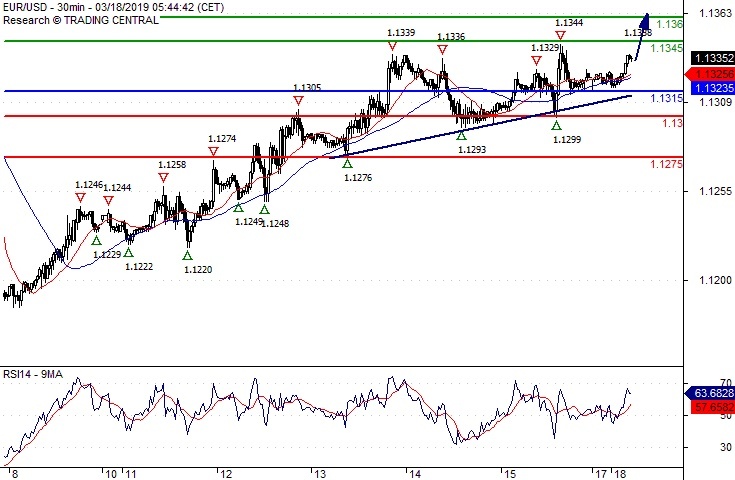
EUR/USD Further Upside
Pivot (invalidation): 1.1315
Our preference Long positions above 1.1315 with targets at 1.1345 & 1.1360 in extension.
Alternative scenario Below 1.1315 look for further downside with 1.1300 & 1.1275 as targets.
Comment The RSI calls for a new upleg.
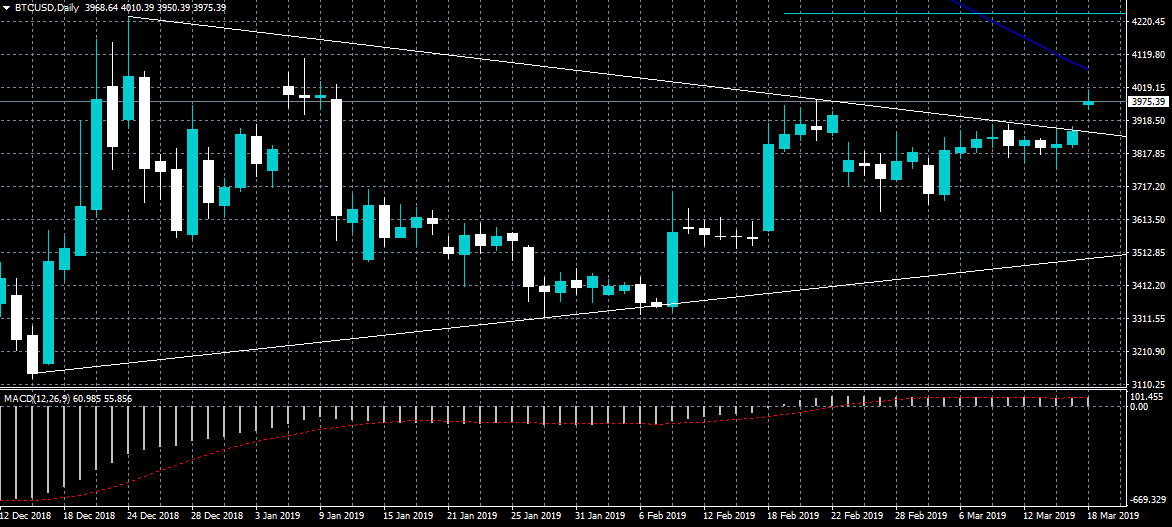
BTCUSD Triangle Break Underway
Bitcoin has performed a bullish breakout above a long-term triangle pattern on the daily time frame, with the number one cryptocurrency test the $4,000 resistance level. The BTCUSD pair had been trapped inside the symmetrical triangle pattern since last December. The overall projection for the upside breakout would take the BTCUSD towards the $5,200 resistance level.
The BTCUSD pair is bullish while trading above the $3,900 level, key technical resistance remains at the $4,100 and $4,240 levels.
If the BTCUSD pair moves under the $3,900 level, sellers may test towards the $3,700 and $3,630 support levels.
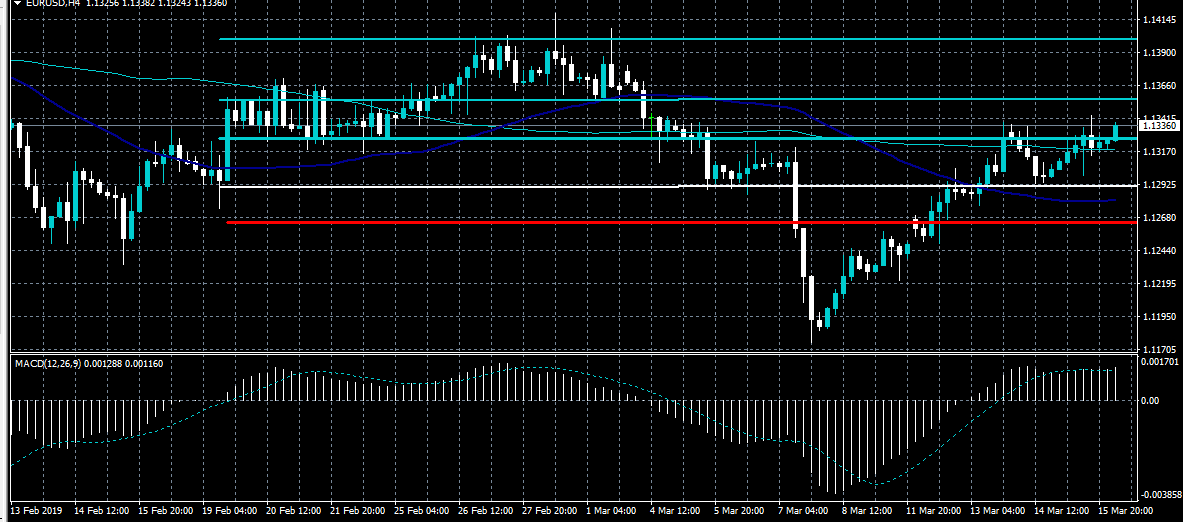
EURUSD 1.1360 Next Key Resistance
The euro as started the new trading week with a renewed bid-tone against the US dollar, with the pair trading close to the best levels of the month so far. If bulls can keep price above the 1.1325 level the next key intraday resistance level is found at the 1.1360 level. If the EURUSD pair falls below the 1.1325 level, sellers may force a technical test of major weekly support, at 1.1290.
The EURUSD pair is strongly bullish while trading above the 1.1360 level, key technical resistance is found at the 1.1410 and 1.1425 levels.
If the EURUSD pair moves under the 1.1325 level, sellers may test towards the 1.1290 and 1.1260 levels.
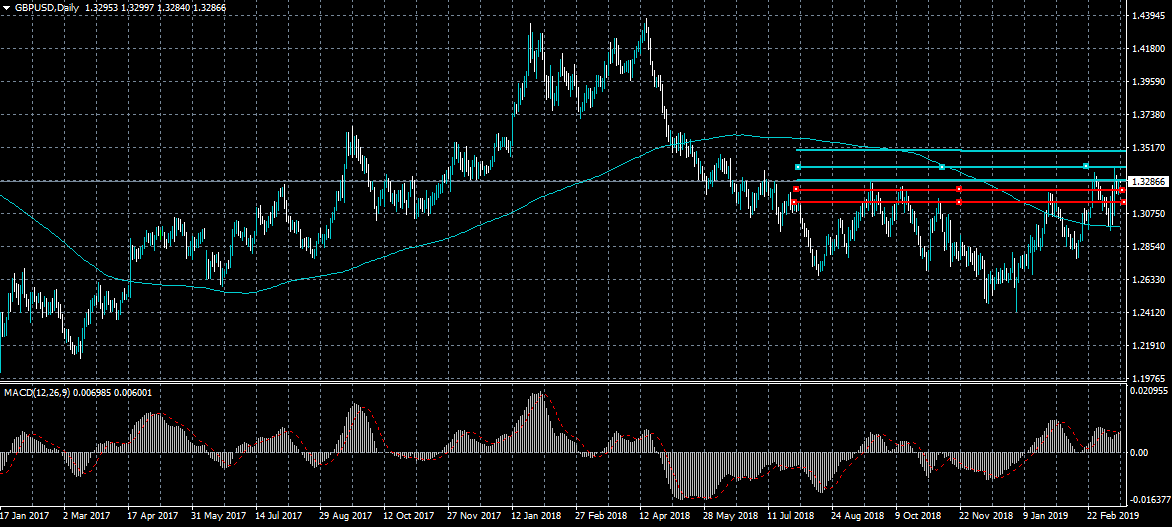
GBPUSD Bullish Bias Above 1.3240
The British pound is trading close to the 1.3300 level against the US dollar in early week trade as the greenback comes under pressure across the board. The GBPUSD pair has a strong intraday bullish bias while trading above the 1.3240 support level. Further gains above the 1.3300 level may lead to an eventual technical test of the current yearly trading high, at 1.3388.
The GBPUSD pair is intraday bullish while trading above the 1.32040 level, key technical resistance is found at the 1.3300 and 1.3388 levels
If the GBPUSD pair trades below the 1.3240 level, sellers may test towards the 1.3200 and 1.3155 support levels.
Yen Falls As Exports Decline For Third Straight Month
The Japanese yen dropped slightly after the country released its trade numbers. The numbers showed that in January, imports contracted by 6.7%. This was lower than the expected decline of 5.8%. It was the first time since December 2016 that imports had declined. Also, it was the third month of declines. On the other hand, exports contracted by 1.2%. This was worse than the expected contraction of minus 0.9%. It was the third straight month that exports contracted also. This was mostly because of poor international demand. As a result, the country’s trade surplus grew by 0.12 trillion yen.
US futures point to a flat open today. Traders will continue to focus on the Dow index, because Boeing is a major component. This is after a report on the Sunday accident showed a close similarity with that of the Lion Air crash. As a result, Boeing will be forced to continue grounding the plane as it works on a fix. This is important because the company makes more than $30 billion a year on the 737-max model and has an order book of more than 5000 planes. Last week, the company was forced to stop shipping the plane and in response, it announced that it will release a software update in a few weeks. Today, it was also announced that federal prosecutors were investigating the development of the 737-max planes.
The sterling rose in the Asian session as traders continued to focus on the continuing Brexit debate. This is after last week’s major votes. On Tuesday, the MPs rejected Theresa May’s deal that she has negotiated for more than three years. On Wednesday, they voted to prevent a no-deal Brexit scenario, and on Thursday, they voted to extend the leaving period. Tomorrow or Wednesday, the premier is expected to table her plan again to parliament for a vote. In this attempt, she is hoping to create a deal with the Democratic Unionist Party (DUP). She has been negotiating with the party, hoping that this will also persuade the Tory Eurosceptics to back the deal. However, the vote is likely to fail because there will be no structural resolutions on the backstop.
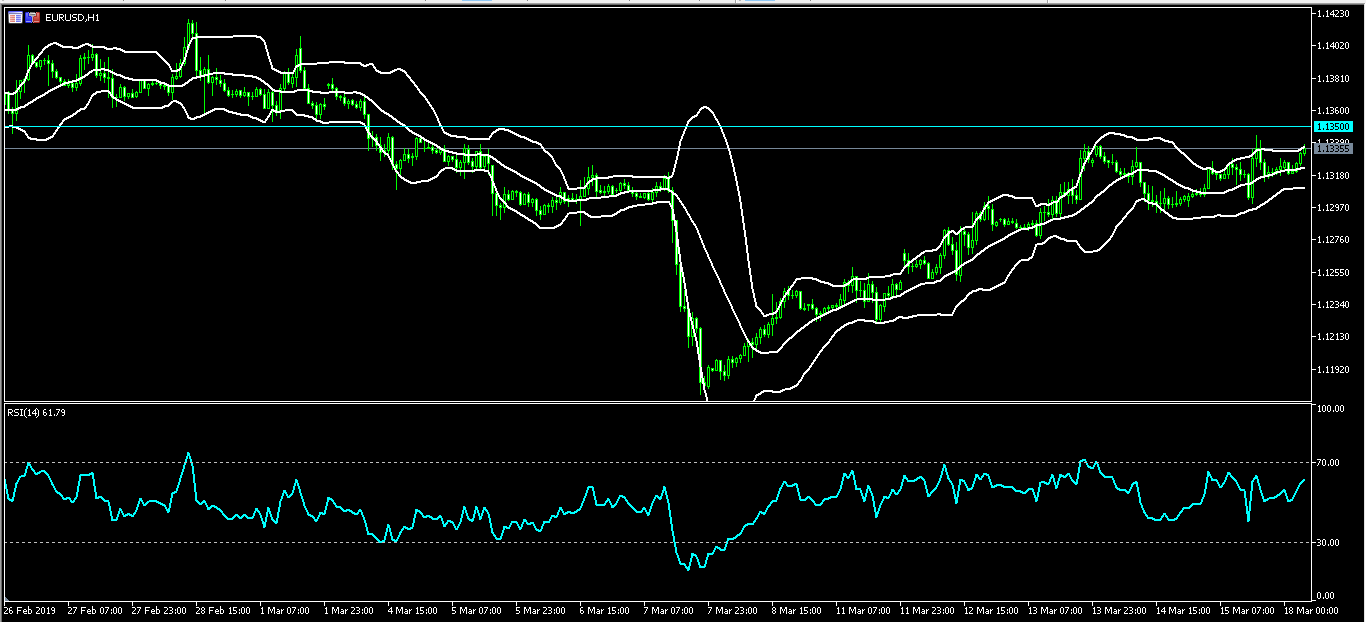
EUR/USD
The EUR/USD pair rose slightly ahead of the EU trade data and the monthly report by the German central bank. The pair reached a high of 1.1337, which was slightly lower than last week’s high of 1.1345. On the hourly chart, the pair is along the upper line of the Bollinger Bands while the RSI has reached almost the overbought level of 70. The pair could continue the upward trend, with the next important level being at 1.1350.
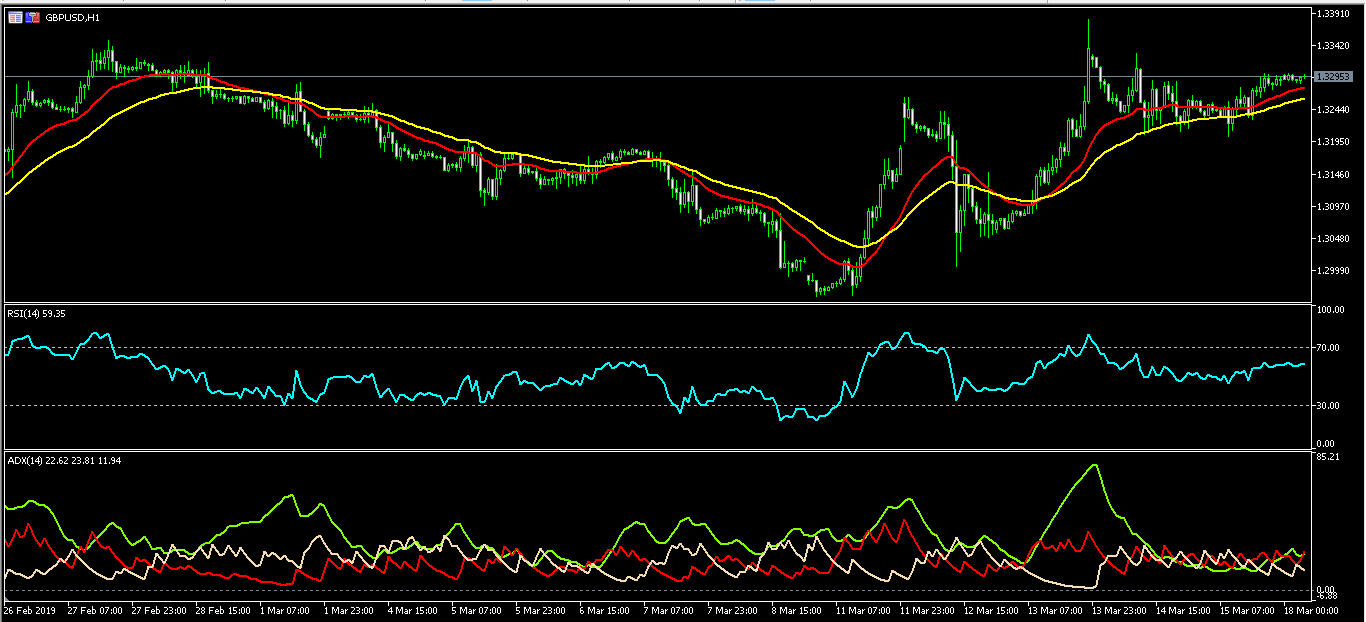
GBP/USD
The GBP/USD pair rose in overnight trading ahead of key developments on Brexit. The pair is now trading at 1.3295. On the hourly chart, the pair is above the 21-day and 42-day moving averages. The Relative Strength Index has flattened at the current level of 60 while the ADX indicator has also flattened at the current 22 level. The pair will likely continue the slow upward trend, although it will still be volatile on Brexit news.
USD/JPY
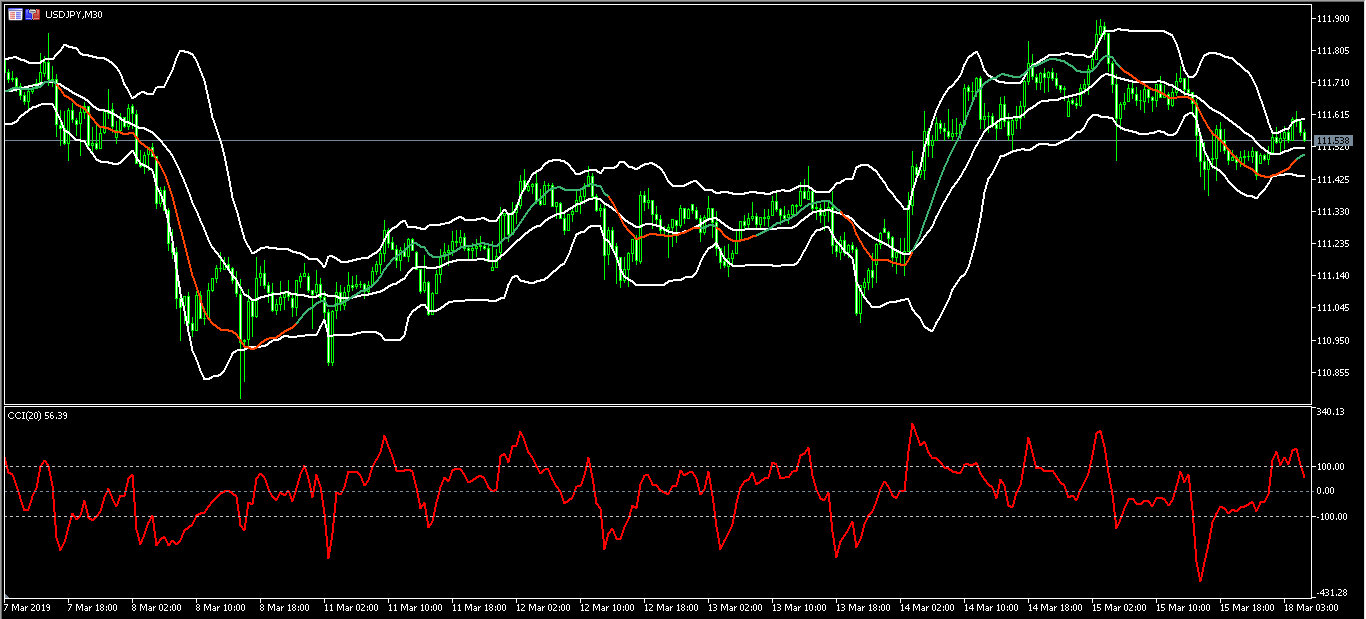
The USD/JPY pair rose as traders reacted to Japan’s trade numbers. The pair reached a high of 111.62 and then pared those gains. On the 30-minute chart, the pair is slightly below the upper band of the Bollinger Bands and below last week’s high of 111.90. The pair’s CCI has moved below the overbought level of 100. There is a likelihood that the pair will resume the upward trend.
Make An Honest Self Appraisal
If you are willing to accept total responsibility for your investment results, you will realize that you are the most important factor in your trading or investment success. If you have done that, you are way ahead of the crowd.
I once had a call from a gentleman in England who had been working with my home study course. He said, "I've been working through the course for over six months. It's helped me realize a lot about myself, but there is one thing it hasn't done. It hasn't given me a positive expectancy system." The ironic thing about that statement is that I had not attempted to give a methodology. There are several reasons for that: 1) If you want to be good, you must design something that fits you. That only is possible if you design the methodology. 2) Psychology is far more important than methodology. In fact, psychology is part of methodology. For example, when we attempt to help people develop a reasonable method that works, they resist it strongly because they have so many biases that keep them focused on the wrong aspect of trading - areas that have nothing to do with success. And it is very difficult to show them the correct direction.
As a result, the best thing you can do for yourself to increase your income from the market is to determine how you are blocking yourself. This should be done at two levels. Whenever you develop a trading business plan a great deal of that plan should have to do with introspection. Take a look at all of your beliefs. Are they useful beliefs or do they hinder you in some way? What are your strengths and weaknesses? What about you can't you see clearly because you are part of it? You should look at doing this sort of assessment at least once each quarter.
The second self-appraisal you need to make is at the beginning of the day - and perhaps even hourly throughout the day. What's going on in your life? Are you ready to face the markets? How are you feeling? Is there some sort of self-sabotage surfacing in you? For example, are you starting to get too confident? Are you starting to get too greedy? Do you in any way want to override your system? The best traders and investors are constantly doing this sort of self-assessment. If you want to make money in the market, then perhaps you should start doing the same.
The Psychological Utility of Technical Analysis
Today I am starting an occasional series on one of the most fascinating and essential topics in currency trading; the interaction between the psychology of the market and the decisions of the individual trader. I hope these observations are useful; reader comments are welcome.
Technical analysis is sometimes studied as if it contains a grain of secret knowledge or portrays an intrinsic truth about currency movements. Often it is said that a specific chart formation will produce a specific price movement.
Technical analysis does nothing of the sort. A chart is a reflection of past prices, nothing more. In itself a graph cannot predict future price movements. A currency does not trade up or down because of a formation on a chart. It moves because market participants make basic assumptions about future price behavior based on the record of past price action. A charted history of price action is the cumulative story of thousands of trading decisions; it is a record of the past behavior of thousands of individual traders.
Price information is meaningful only because trader's decisions give it predictive power. A simple proof of the limited forward intelligence of historical price action is the well attested notion that fundamental developments always trump technical analysis. If the Federal Reserve raises rates unexpectedly or the Chinese Government announces it will no longer buy US Treasuries there is no chart formation that has ever existed that will prevent the dollar from rocketing up in the first instance or plummeting in the second.
Technical analysis does not produce price movement. I state the obvious because in the endless attribution of trading cause and effect to 'the market' it is easy to lose sight of the actual composition of the market--thousands of individual decision makers. The translation mechanism for technical analysis runs from the information contained in a chart, through the assessment of that information by market participants to the trading behavior of those market participants.
Another way to approach this idea is to ask, just who is the 'market' and what is it trying to accomplish every day. It is likely that over 90% of the $3.2 trillion daily volume in the FX market is speculative. That means that everyone in the market from the hedge fund trader with $1 billion under management, to the euro trader on the Deutsche Bank interbank desk to the retail trader in her study, is trying to do exactly the same thing, take home daily trading profits.
Interestingly, the overall worldwide foreign exchange trading volume in 2007, the year of the last survey, increased almost 50% from the prior survey in 2004 of $1.9 trillion daily. The counterparty reporting segment to which retail foreign exchange belongs boosted its share of turnover to 40% from 33% according to Bank for International Settlements in Basel (BIS, 2007) which conducts the tri-annual survey.
To return to my previous point, if every market participant is attempting to do the same thing, namely wring trading profits from the day's activities, how do they all go about it?
The first thing every trader does, in New York, Tokyo, London and in every land in between is to pull up charts and look for trading opportunities. Every trader looking for profit is judging the same charts. Everyone sees the same price history, and everyone identifies the same potentially profitable chart formations. And, in the absence of other factors, the majority of traders will come to the same trading conclusion based on the observed chart formations.
If euro has been in an up channel for two weeks and is approaching the bottom of the channel most traders looking for an opportunity in euro will bet on the continuance of the up trend and the maintenance of the channel. They will place buy orders just above the floor of the channel. And much of the time the charts will have been proven correct, the euro will indeed bounce from the floor of the channel. But it bounces not because, for instance, the ECB is expected to raise rates at some future date, but because of the fit between the goals, information and assumptions of the market's traders.
Traders need profits, all charts contain the same information and all traders operate with similar assumptions about market behavior based on chart formations. If enough traders place their buy orders above the bottom of the channel it becomes likely that the euro will bounce off the floor of the channel and continue the upward channel formation, barring external events of course.
There is powerful self-fulfilling logic in technical analysis, it works, because everyone trading believes it will work and makes their trading decisions accordingly. For a retail trader this knowledge is the most accessible and effective trading strategy that exists.
From our old partnet Joseph Trevisani Chief Market Analyst at FX Solutions
The Relationship Between Crude Oil And CAD
Historically speaking, crude oil and the Canadian dollar have had a very strong relationship, most of the time, the two assets having a high degree of correlation.
This can be explained by the fact that Canada holds the second biggest oil reserves in the world after Saudi Arabia. Moreover, a large amount of these oil reserves are pumped into the United States, making Canada the biggest energy source for the U.S. economy. Thus, investors focus on crude oil prices to gauge the Cad’s direction of trading.
The correlation between crude oil and Cad was pretty easy to exploit in time, but all this came to an end over the last few weeks as crude oil began to quickly drop while the Canadian dollar declined only a few basis points throughout the same period. Most likely, this happened because of two different fundamental drivers: oil dropped as the market was re-pricing the outlook of the global demand, while Cad traded mostly range-bound, together with the dollar index and the other major currencies, as it seems the financial market saw more dollar than it would ever need (thus the market stayed in risk-aversion mode only for a short period).
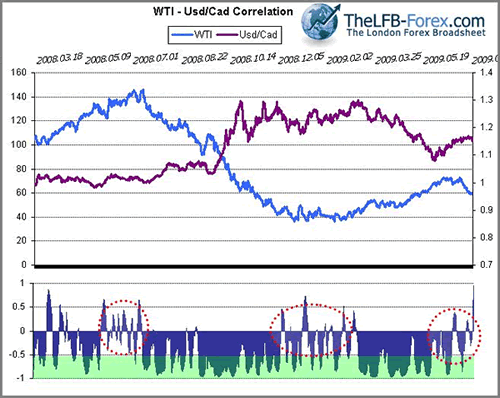
The attached chart shows how the cad and crude oil have behaved over the last 15 months (from 03.01.2008 to 07.14.2009), while the secondary chart shows the weekly correlation between the two. The green area denotes the periods when the implied correlation was between -0.5 and -1.0, which are the phases when crude oil can be used to forecasts Cad’s direction. As a note, the extended periods when Crude oil and Cad had no correlation or moved in the same direction - as the one we have right now, denoted by the fact that the correlation index swings between -0.5 and 1.00- happened only when the market reversed the prior trend.
From our old partner TheLFB Trade Team http://www.TheLFB-Forex.com