Sample Category Title
EURUSD Runs Higher Near Descending Trend Line
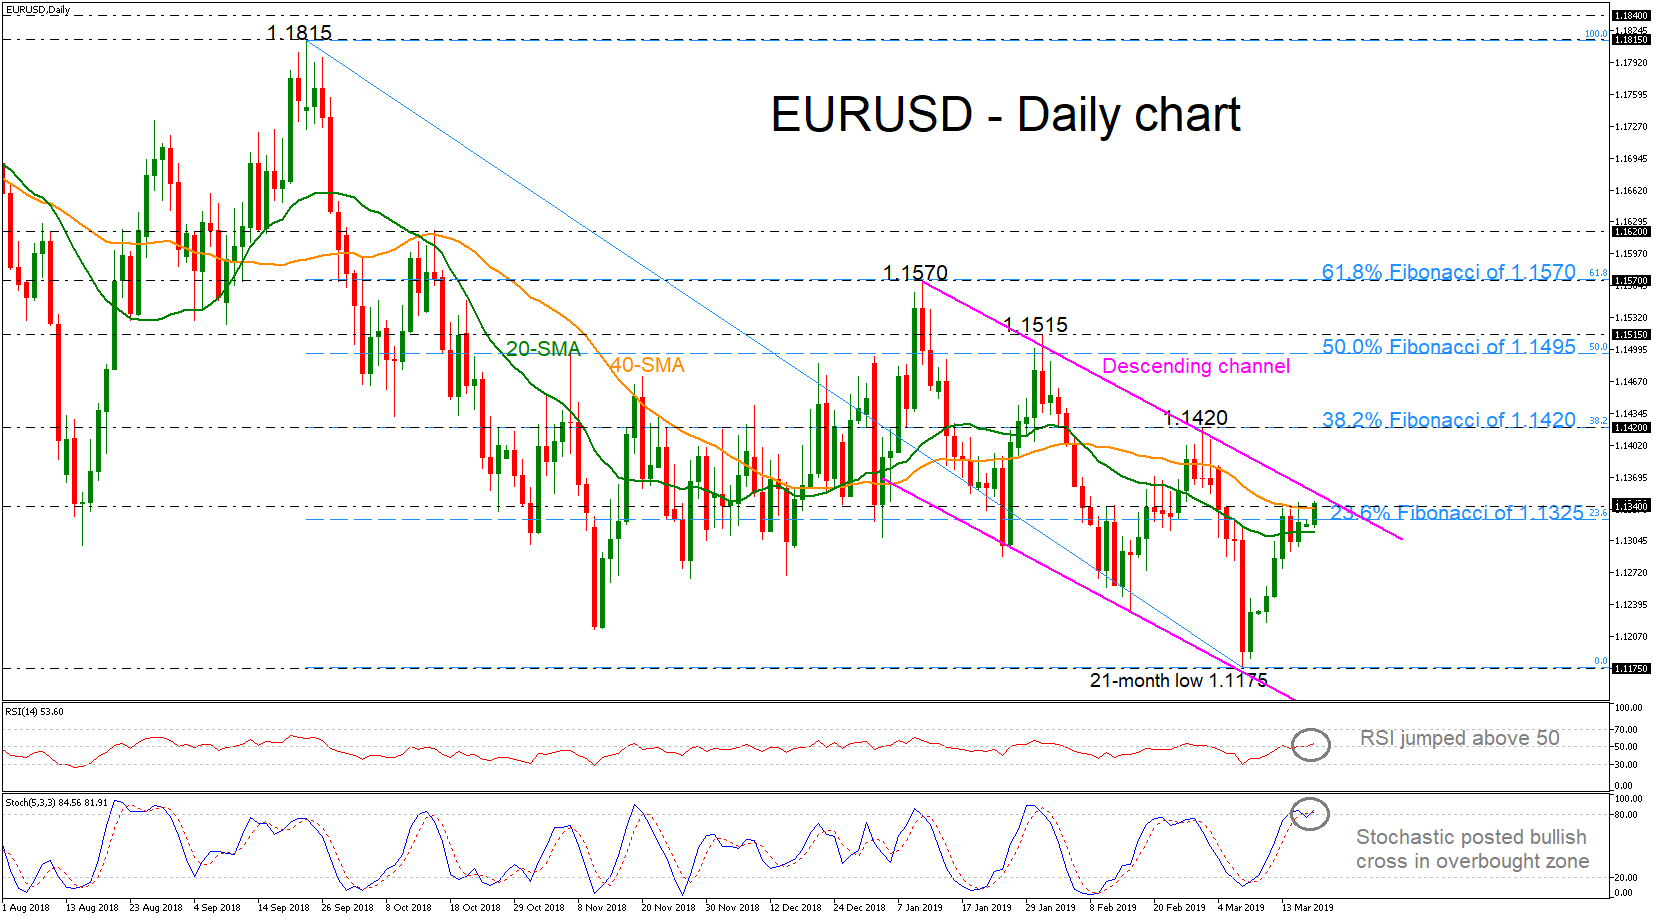
EURUSD has advanced considerably over the preceding week after the rebound on the 21-month low of 1.1175, challenging again its simple moving averages (SMAs) in the daily timeframe. The price surpassed the 23.6% Fibonacci retracement level of the downleg from 1.1570 to 1.1175, near 1.1325, but it continues to trade within a downward sloping channel.
Technically, the RSI indicator is confirming the recent upside movement as it is sloping slightly higher. In Stochastics, the %K and %D lines have posted a bullish crossover in the overbought zone. The latest action may signal the end of the bullish action and the start of a bearish correction.
If the price continues the upside movement, immediate resistance could come from the descending trend line, around 1.1350. A decisive break above the channel, could send prices towards the 1.1420 barrier, which overlaps with the 38.2% Fibonacci mark. Moreover, if the market pushes the pair even higher, the 50.0% Fibonacci around 1.1500 could also act as a significant hurdle.
On the other hand, if the price fails to jump above the downtrend line, it could hit the 1.1175 bottom again, where a possible penetration of this obstacle could drive the pair even lower, probably towards 1.1115 identified by the lows on June 2017. More downside pressure could open the door for the 1.0830 level, taken from the low on May 2017.
Concluding, EURUSD seems to be negative in the short and medium term, posting lower lows and lower highs.
Gold Pares Some Losses, RSI Looks Slightly Bullish In Short Term
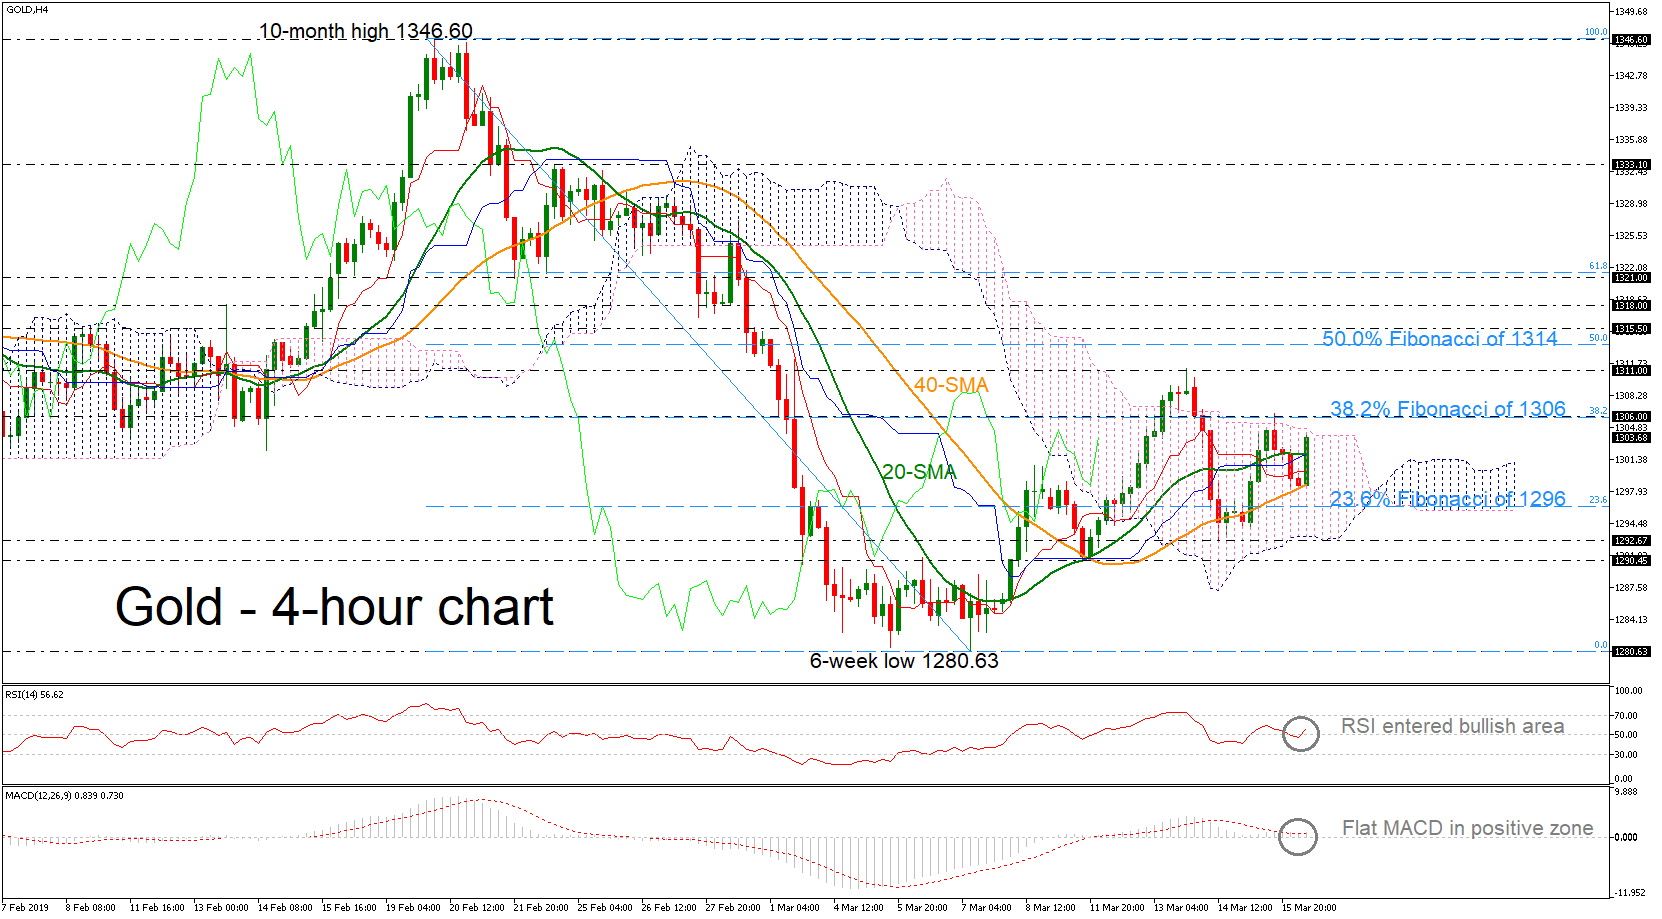
Gold is posting notable gains over the last 4-hour session, successfully surpassing its 20- and 40-simple moving averages (SMAs). While the price continues to trade within the Ichimoku cloud over the last week and the MACD oscillator keeps lacking momentum around its trigger and zero lines, the RSI is trying to frame a more positive picture for the short term as the indicator has started to slope to the upside again above its 50 neutral mark.
Immediate resistance would likely come from the 1306 barrier, which coincides with the 38.2% Fibonacci of the downward movement from 1346.60 to 1280.63. Rising above this area would help shift the focus up to 1311. Breaking this level too, the investors could look next at the 50.0% Fibonacci of 1314 and the 1315.50 resistance.
Should prices reverse lower, immediate support could come from the 40-SMA (1298). Slightly below, the 23.6% Fibonacci of 1296 is another major support, while beneath that, the commodity could fluctuate between 1292.67 and 1290.45, where the lower boundary of the Ichimoku cloud is also placed. More losses could send prices until the six-week low of 1280.63, significantly weakening the bullish short-term structure.
To sum up, gold could follow a neutral to positive path in the short term, while in the medium term, the bullish outlook has somewhat faded as in the daily chart the 20- and 40-SMAs are ready to complete a bearish crossover, suggesting a negative structure.
The Four Letter R-Word
Forex traders hear a lot about Risk; whether the markets are tolerant, averse, or neutral. It is a headline that is bandied about on a regular basis. Quantifying the value of risk, and its forex impact, may be so much harder to do in the trading arena, than reporting each day on whether the herd was charging towards, or away from risk.
In its natural state the financial market has three major attitudes towards risk that models its behavior and actions throughout each of the global trading session. The three are; risk aversion, risk tolerance and risk-neutral. Headlines overplay the four letter Risk word, it should be used sparingly as daily risk levels do not reflect the big picture of fair value on global risk, and its forex implications.
Aversion Phase:
Risk-aversion is characterized by investors selling assets in times of global contraction that are considered risky, and swapping them for the safety of the bond market, mainly U.S. Treasuries. Risk-aversion can be seen relatively easily; commodities decline (global commodities are priced in Usd values, and as such create a short commodity/Long dollar move), as investors consider that consumption will slow, while S&P futures also head lower at a sustainable pace.
In the currency market, risk-aversion strengthens the dollar, as investor sell foreign denominated assets to buy U.S. Treasuries. In this period, higher yielding currencies (those with a higher overnight, or ten year note rate) are the ones being sold the most as the Usd is bought.
Tolerant Phase:
The risk-tolerance phase is seen when Treasuries and bonds are sold as investors look for higher yields in a long-term play that reflects a confidence that the global economy is expanding. In periods of relative calm and positive macroeconomic reports, traders dilute holdings in the safety of the bond market and invest their capital in stocks, commodities and higher yielding foreign currencies. Usually, bull markets are characterized by risk-tolerant phases and in this period S&P futures and global commodities head higher. Therefore in this period the dollar is sold.
Neutral Phase:
In most cases, risk-neutrality happens when the financial market moves side-ways, unable to push to test support or resistance, and when global fair value on risk is accepted. At this stage the global economy will be hitting its peak, or hitting its trough, in the business cycle phase. This will be characterized by a re-distribution period, as investors shift their assets between the various financial instruments in preparation for the next leg of fair value on risk.
The main difference in the Neutral phase being that the shifts are not only session-by-session, they literally happen hour-by-hour as big players try to make their automated moves without detection. Sentiment is seen to change from one to the other, empowered by the relentless flow of global market trades that trigger as a contingency play, as each individual market accepts risk neutrality, or not.
The sideways moving market tends to be the more volatile as the channels are traded, and fair value sought at each regional market open and close. June through August has been risk tolerant enough to move prices in equities. However, the regional market activity has not been strong enough to attract increasing volume levels to be able to make a stance on risk for the next phase of trade to be confidently called, and therefore the currency markets continue to spin their wheels each day as dollar values are fought over.
Transition Phase:
Looking towards the next three months of trade, tenured forex traders understand that fair value on the Usd, and on risk, will be all about the phase that global business cycle are entering. The stages are; Trough> Expansion> Growth> Peak> Contraction. The five cycles take 10-15 years on average to work through and complete. The U.S. economy however has been completing the cycle in half that time, and that is making Usd long-term valuations harder to reliably plan.
Therefore when in Trough-to-Expansion, or Peak-to-Contraction phases, the market runs on risk neutrality and stocks dominate reads on fair value. This leads to a very high correlation (averaging 90%) between equity trade and Usd movement; stocks go up and Usd goes down.
When we get into the Expansion or Contraction, phase, and either one is in full flow (lasting a 5-8 year period globally, or 2-3 years in the US) risk tolerance takes over, interest rate differentials dominate the valuation of currencies, and stock market correlations reduce (averaging 60%). Fair value on risk and on the Usd becomes all about growth and interest rates.
Fed Fund Phase:
In times of Growth the Usd will increase against those currencies not showing inflation, and/or, higher interest rate outlooks. As and when the Federal Reserve raise overnight interest rates, it will be because of an inflation fear coming from economic expansion, and it will very likely be in a drip-fed manner of slow and steady increments as the attempt to keep the speculative interest on the long side of the Usd at bay.
However, the Usd will then be challenged by regional growth that does not carry the weight of massive debt and current account/trade imbalances. The Usd may never get back to 90.00 on the dollar index if global regions expand at the same pace as America. As in 1972 under President Nixon, it looks as though the U.S. in 2009 has set up Usd devaluation with an over-commitment to Treasury debt that now looks challenging, to say the least.
Weak Dollar Phase:
Coming out of a time of global Contraction and into a period of global Growth (possibly) a strong currency is not what is required, by any region. However, the U.S. looks to be the one region that literally cannot afford a stronger dollar. The insurmountable look to the U.S. Treasury debt numbers leave many to believe that the only way forward with sustainable growth, that has any chance at all of creating expansion numbers over and above the forward obligation to pay interest on the debt mountain, is with a lower value dollar.
Forex traders will be looking again at whether the global economy is prepared to welcome a slimmed down version of the greenback, something that seems a 'must-have' for the Federal Reserve. That however can only happen in the current environment with an increasing global equity market, and a boisterous oil market arena that maintains a high level of long speculative interest.
We have to go back to the rule book set in 1972-73 when the last major forex rule was torn up and re-set, to a time that the dollar index was born if we are to gauge the potential in a ever-decreasing Usd value Traders and investors may have to accept that going forward the Usd/Risk link may become eroded as the debt mountain surpasses equity direction as the thing that helps or impedes daily Usd valuations.
Percentage Risk Phase:
If volume hits this market in September, and following the laws of probability the month has a good chance of being negative (Shwartz Stock Market Handbook has it as historically being the worst performing equity month of the year), forex trader eyes will be all about whether the Usd gets bought in the same number as previously seen in the recent Risk Averse periods of trade. If stocks pull back and the Usd does not get bought at a 90% correlated rate, we will have a signal of two things;
Firstly that the market is valuing risk on forward Growth and interest rate differentials. Secondly, that the equity pull-back may be a technical signal that it will find support before making the next leg higher, rather than being the start of an equity collapse.
Risk Tolerance and Interest Rates will be affected by the global business cycle. Whatever the headlines roar about this session being tolerant on risk, or not, we now fully understand that at this pivotal a time, risk will be seen in the percentage correlation between equities and the Usd changing from the current 90% rate.
Forex Trader Phase:
Forex traders will be looking to see that Usd/Chf is moving hard when they place their trades, if not they will be questioning the moves because swissy has become correlated to dollar index moves holding, or not. They will also be looking for oil and S&P futures markets to stay aligned, because in any play in forex, whatever the pair being traded, the Usd does affect the momentum flow.
The Usd affects every major traded cross pair, for example; Eur/Usd x Usd/Jpy = Eur/Jpy. Also, Eur/Usd ÷ Gbp/Usd = Eur/Gbp. The synthetic pairs (no Usd on one side or the other) can only move as a percentage of the change in the major pair moves against the Usd; knowing what the drivers of the Usd are doing allows for targets to be realistically set, and lot size accordingly adjusted.
Getting secondary confirmation from inter-related markets is a must-do for any level forex trader, especially when fair value on risk is so hard to find as global markets transition from Trough to Growth. TheLFB trade team will guide forex traders with updates issued regionally, trade plans that absorb the noise and create stability, signals that track inter-related movements, daily videos that put words into pictures and with constant analysis of sentiment and momentum in the global market.
From our old partner TheLFB Trade Team http://www.TheLFB-Forex.com
Times To Trade
Trading the OTC (over the counter) currency markets offers an opportunity to hedge stock and bond investing, but really is more of a traded market following the ebbs and flows of global commerce than it is an investment arena to plan retirement from. Getting to know six major currency pairs would seem an easy task when compared to the tens of thousands of stock and bond options available for analysis.
Forex trade is not all about how each currency will move against the Usd, just as important is knowing when the market will have momentum, because that is key to not getting caught in reversals and snap-backs whilst leveraged at 100:1.
Setting times to trade really does make a lot of sense with the near-term view that forex valuations carry, and the fact that each 24 hour period has to absorb three regional commercial market's trade, in Asian, Europe and the U.S.
There are three main forex moving times that regularly garner attention, and therefore offer an ability to move prices with momentum. They are the 2am EDT German Dax futures market getting underway, the 6-7am EDT London gold/oil fixings and LIBOR rates being set, and the 11am EDT European market close.
Outside of that, the return from lunch in Japan between 11pm EDT and midnight, and the closing of the NYMEX markets at 2.30 pm EDT really are the only other times that prices move substantially and then hold.
At the end of the U.S. session the pattern is for Asian markets to try and initially reverse U.S. trade direction, although the lack of volume tends to soon allow pairs to find and hold support areas. The European markets tend to move in the same direction as Asian trade, and then Chicago based futures movement will try to reverse things back in the direction of where the U.S. previously closed, and re-set their books as the London fixings are placed between 5-6am EDT.
At 10:30am GMT in London, telephone bids for the gold and oil fixings take place, something that sets the morning clearing prices for bullion and crude dealers that (are then adjust once again at 3.30pm GMT). At 11am GMT each day in London the British Bankers Association set the inter-bank LIBOR rates, something that sets the tone for lending rates between financial market participants.
The London fixings tend to force Chicago based futures markets into a re-alignment program at 06:00 EDT that replicates the newly set fair values on oil, gold, and lending rates, and by default tends to then impact Usd based currency values. It is rare for the U.S. not to push back each morning and reverse the pattern of forex trade that came before, especially if a sizeable move has happened in overnight forex trade.
Forex traders really need to know what is going to trigger the technical set-ups, and therefore be prepared to ride momentum while it lasts, and to cap expectancy and exposure in things are moving against the near-term trend. In the trading forex arena there are different things to look for than in the equity and bond investment world; a week in forex absorb fifteen regional equity market moves, and all of which are movinmg for varying commercial regions, and using foreign exchange to hedge commitments, repatriate overseas profits, align reserve values, and garner swap interest.
The European and NYMEX close (11am EDT and 2.30 pm EDT are the U.S. based things to get out of the way, because then, maybe, the equity markets can reveal where they really want to go, and by default send the Usd in the opposite direction. Traders looking for moves outside of 2am, 6am, 11am, and maybe 2:30 EDT, may just find themselves sitting and waiting, wondering why they just bought the high of the day that then reversed.
Try it out, take a look at a volume study in forex futures, or look at the longest daily 30 minute candles, and see on average what time they hit. Then look at the times that nothing happens. That is not luck, it is the forex market tagging along, following the ebbs and flows of global commercial trade.
As the global economy travels trades its way out of the business cycle trough phase, the leaning is towards looking at S&P futures trade to confirm near-term sentiment, and risk tolerance. The speculators are never too far away from the S&P in times of fear; either selling into the fear of loss, or buying into the fear of missing profits. That is the reason for so much near-term volatility, and that is how things will stay until signs of GDP expansion are seen globally.
Until then it seems that the 24 hour a day S&P futures trade will set up the eight hour S&P cash market for currency traders to monitor, that will be followed by the S&P futures market tracking the 16 hours of Asian and European activity. Forex will follow that equity trend, at least until interest rates start to rise globally, and economic expansion takes place. At that time interest rate differentials will take over the valuation of forex pairs, to the greater degree.
From our old partner TheLFB Trade Team http://www.TheLFB-Forex.com
USD/JPY Uptrend Needs Break To Confirm Wave-3
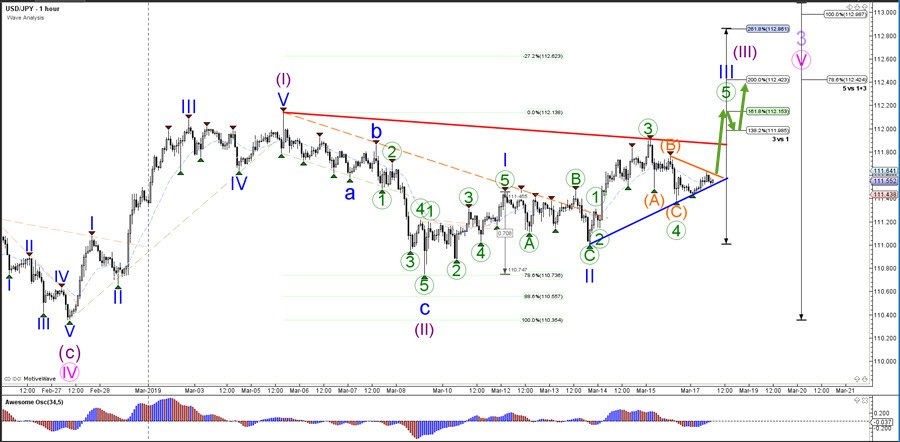
The USD/JPY bullish break could see price move towards the top of the bullish channel and the Fibonacci targets of wave 5 vs 1+3. This breakout could be part of an impulsive third wave (purple) whereas a bearish breakout could indicate a pauze or end of the uptrend.
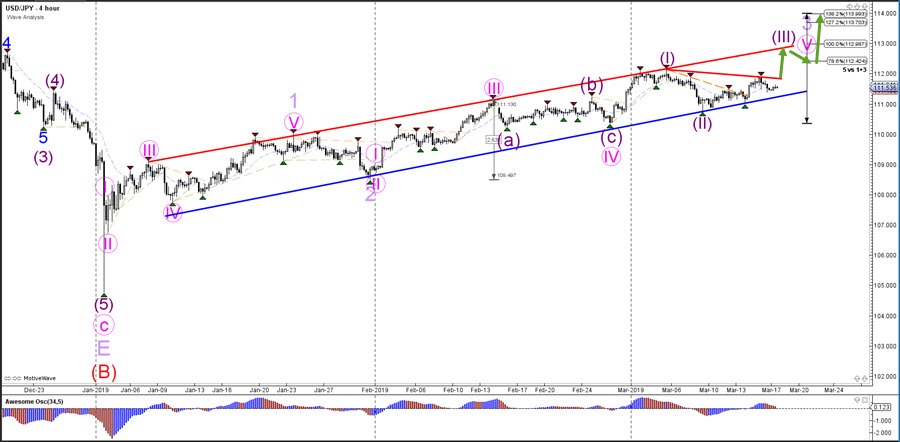
The USD/JPY seems to have completed a bearish ABC (orange) pattern within wave 4 (green). A break above the local resistance level (orange) could start the USD/JPY upside for a wave 5 (green) of wave 3 (blue) and see price move higher towards the Fibonacci targets of wave 3 vs 1.
Trading the Dollar With USDX
The US dollar index (USDX) is an important analytical tool for traders in just about any market. The USDX is actually a futures contract which means that if you have a futures trading account you could trade this instrument like corn, oil, gold or currency futures contracts. However rather than trading the USDX most retail traders use it as way to analyze the relative strength or weakness of the US Dollar in general.
The USDX compares the US dollar (USD) against a basket of other world currencies. This basket represents most of the largest free floating, major currencies in the world on a weighted average basis. The currencies included are the euro, yen, British pound, Canadian dollar, Swedish krona and Swiss franc. Each of these currencies are given a weight within the index with the largest weight given to the euro.
The euro is typically half the total weight included in the average the chart for the USDX and will often look like a chart of the USD/EUR futures contract. Spot forex traders will notice that the USDX is very similar to an inverse of the EUR/USD spot forex pair. However, because the USDX includes 6 different currencies it is a better measure of USD strength than any single currency pair including the EUR/USD.
The USDX was established in 1973 with a starting value of 100. That means that if the USDX is measuring less than 100 the USD has lost relative value compared to what it was worth in 1973 and if it is above 100 then the USD is stronger than it was in 1973. Currently the USDX is hovering around 82, which means that it is 18% weaker than its starting value. The dollar has not always been weaker than it was in 1973, the USDX showed a 20% improvement in value in the USD in 2001 and 2002.
The USDX is particularly useful for traders in the bond, currency and gold markets. For example, a strong USD is usually correlated with falling gold prices, which means that gold traders are very interested in a break out on the USDX even though they may not be trading the USD directly. Similarly, global crises often increase demand for the USD as investors seek a shelter from uncertainty. This will drive the value of the USD up and often bond yields will drop. These are just two examples of how the USDX is one more inter-market tool you can use for evaluating capital flows and finding new trading opportunities.
Charts for the USDX on the pairs analysis pages in the forex section of the Learning Markets website but if you are interested in trading the USDX you have two attractive alternatives. First, you can open a futures account. There are futures and options on futures available on the USDX that trade on the New York Board of Trade.
Second you can trade ETFs that track the USDX itself. PowerShares offers two ETF alternatives for trading the index. The first is UUP which invests in long futures contracts on the USDX, which means it will move the same direction as the dollar index. The second is UDN which invests in short futures contracts on the USDX, which means that it will rise in value when the dollar index weakens. If you are bullish the dollar you could buy UUP and if you are bearish the dollar you could buy UDN.
From our old partner TheLFB Trade Team http://www.TheLFB-Forex.com
Will The Fed Provide A Further Boost To Equities?
U.S. stocks posted their best weekly performance last week, sending the S&P 500 above the critical resistance level of 2,815. Equity bulls may see the break of the technical resistance as an indicator of further expected gains, especially given the CBOE's Volatility Index “VIX” has fallen to its lowest level since October 2018. Two factors have driven equity investors' optimism: hopes of a resolution in ongoing U.S.-China trade discussions and central banks' pledge to keep supporting waning economies.
Bonds markets however, seem to disagree. If the outlook is as rosy as equity investors suggest, yields on the longer run of the Treasury Curve should have been climbing. Instead, U.S. 10-year yields have fallen below 2.6% for the first time since early January, suggesting that growth and inflation expectations will remain weak for the foreseeable future.
Another concern for the 3-month bull market is liquidity. The recent rally has not been supported by strong inflows, indicating that fewer investors are participating in this bull market. It remains to be seen whether equity or bond markets are right; however, it doesn't seem this is the most loved bull market.
Will the Fed's patience reflect in the dot plot?
The Federal Reserve's monetary policy meeting is likely to be the most significant risk event for the week.
While it is not expected to see changes ininterest rates, investors are hoping for an announcement to end the central bank's balance sheet reduction. Such a move could prolong the recovery in equity markets.
According to Fed Fund Futures, markets do not just expect a zero chance of rising interest rates on Wednesday, but are indicating a 26% chance of a rate cut by year-end. It will be interesting to see if the Fed agrees with current market views. If the dots on the dot plot are going to be dragged lower, this could attract new selling opportunities for the USD, but Powell's tone and his assessment of the U.S. economy will also drive the currency.
Deal or no Deal?
The Bank of England is also meeting this week, but this sessionis likely to be a non-event, with the central bank not expected to make any changes to policy. In fact, it's the E.U. summit on March 21 – 22 that traders will need to keep an eye on. Will E.U. leaders agree on extending the Brexit deadline, or will they provide some further compromise before the March 29 deadline? If no agreement is reached at this summit, the U.K. will be left with one option. A no-deal Brexit!
Markets Waiting For The Fed To Adjust Their Policy Expectations Downwards
Market movers today
The week starts out on a fairly quiet note with regards to economic releases. Instead markets will be looking for new signals from Brussels with regard to the extension of the triggering of Article 50 in relation to Brexit.
Later in the week, central banks will dominate the agenda with the BOE, Fed and Norges Bank concluding their policy meetings.
On Wednesday, the Fed is on hold while lowering the 'dot' signal for 2019 to one hike (from two), and hence we think the most interesting meeting will be the Norges Bank meeting on Thursday, where we expect a rise in its policy rate by 25bp to 1.00% and to signal one further rate hike this year.
Selected market news
The Asian equity markets have been grinding higher this morning, while bond yields have remained range-bound as the market are looking for support from the Federal Reserve meeting on Wednesday. Here, the Federal Reserve is likely to revise its forecast for rate hikes down to one rather than two. This will continue to suppress volatility in the markets and support a flat yield curve going forward.
In the UK, PM May has been trying to get more support from the Eurosceptics in her party for her deal, which is expected to be put to a vote on Tuesday. However, if she does not have strong chance of getting the deal accepted, then she is not likely to put it to a third vote according to media reports quoting ministers in her government. Otherwise, PM May will go the EU summit on Thursday to seek an extension on the Brexit process. Hence, there will be plenty of uncertainty regarding the Brexit process during the week. GBP has remained fairly range-bound versus both the USD and EUR this morning.
Gold recovered ahead of 1275/6 support zone, maintains bullishness
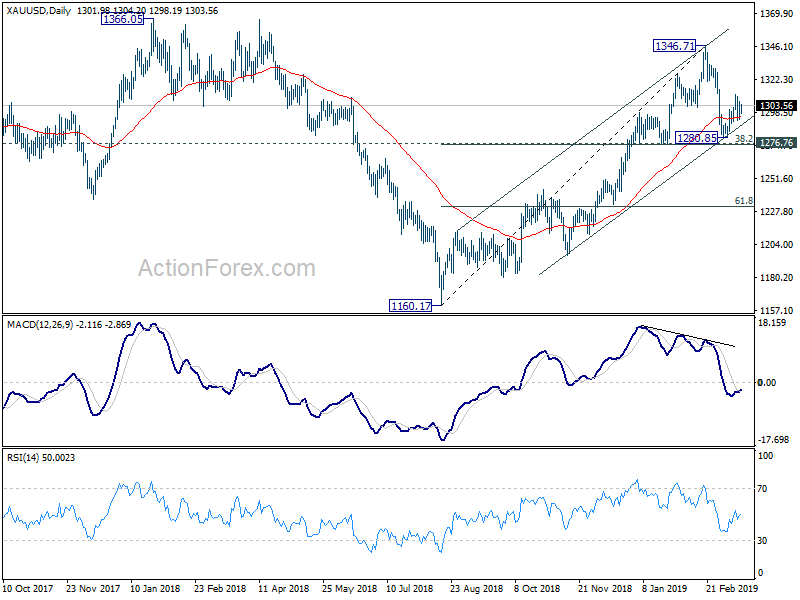
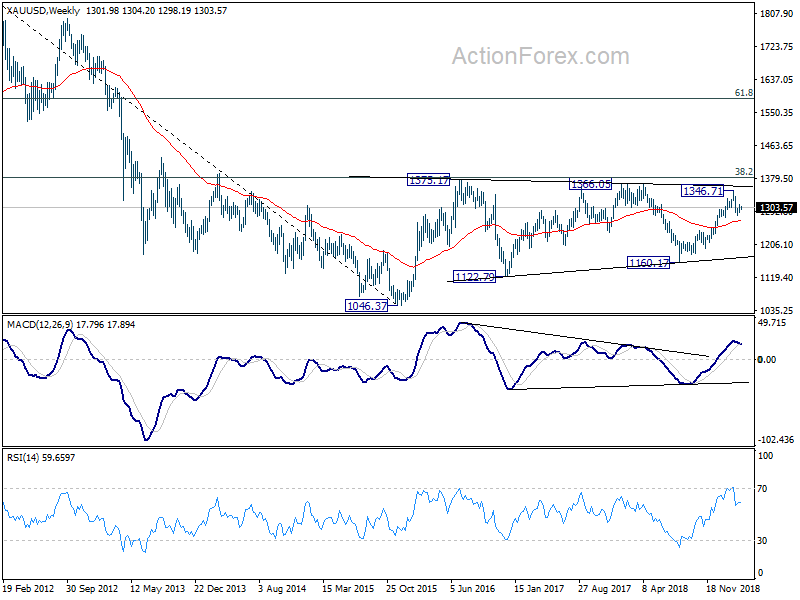
Gold drew support from rising channel line and recovered after hitting 1280.85. So far, it's held above 1276.76 cluster support (38.1% retracement of 1160.17 to 1346.17 at 1275.45). Thus, there is no indication of trend reversal yet. Rise from 1160.17 could extend further. Break of 1346.71 will target key fibonacci level of 38.2% retracement of 192.070 to 1046.37 at 1380.36. For now, we don't see enough momentum to break through this 1380.36 key fibonacci level yet.
On the downside, decisive break of 1275.45/1276.76 should confirm completion of whole rise from 1160.17. In that case, gold should have started another falling leg inside the long term range pattern. Deeper fall should then be seen back towards 1160.17 support.
GBP/JPY Daily Outlook
Daily Pivots: (S1) 147.61; (P) 148.00; (R1) 148.56; More...
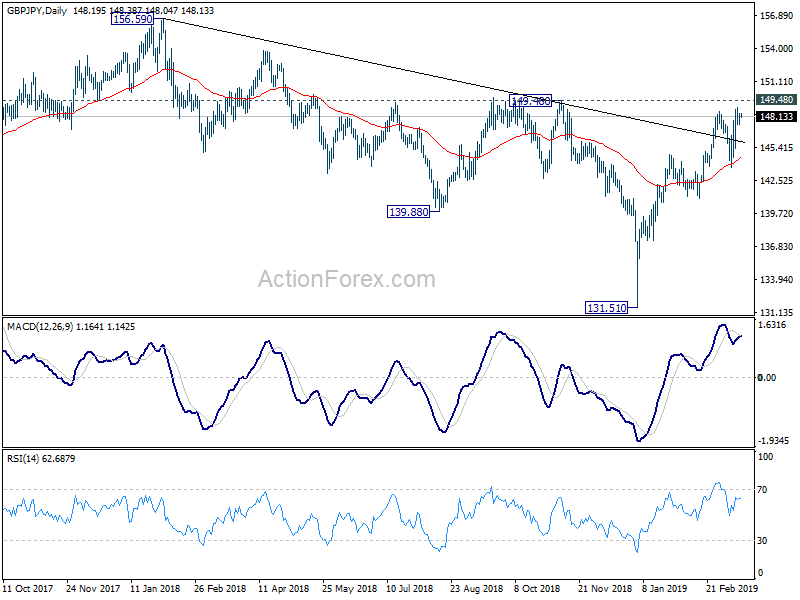
Intraday bias in GBP/JPY remains neutral for the moment. On the upside, decisive break of 149.48 key resistance will carry larger bullish implication and target 156.58 resistance next. On the downside, though, break of 143.72 support will indicate near term reversal and turn outlook bearish for 141.00 support.
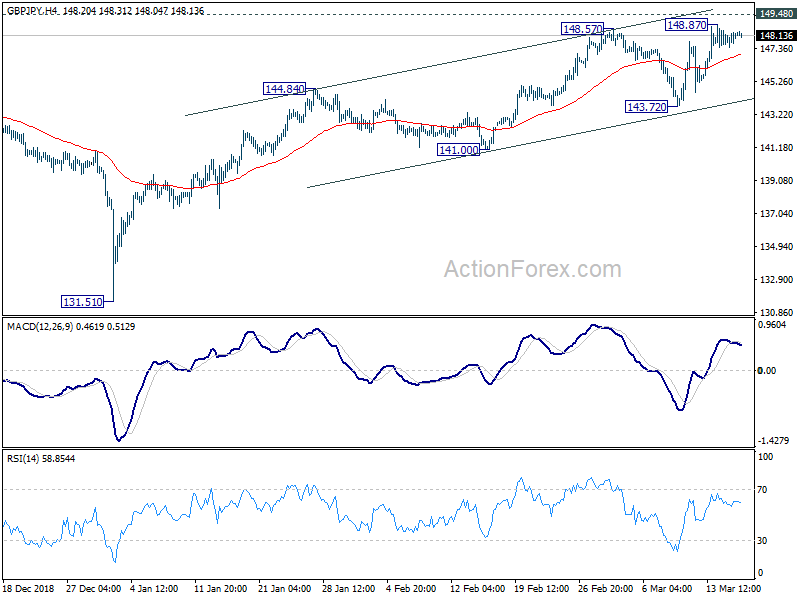
In the bigger picture, the strong rebound from 131.51 suggests that medium term fall from 156.59 (2018 high) has completed already. The corrective structure of such decline in turn argues that it's the second leg of the corrective pattern from 122.36 (2016 low). And this pattern is starting the third leg. On the upside, decisive break of 149.48 will pave the way to 156.59 resistance and above. However, firm break of 141.00 support will dampen this view and turn focus back to 131.51 low instead.