Sample Category Title
CFTC Commitments of Traders – Bets for Higher Crude Oil Price Increased as Shorts Trimmed Sharply
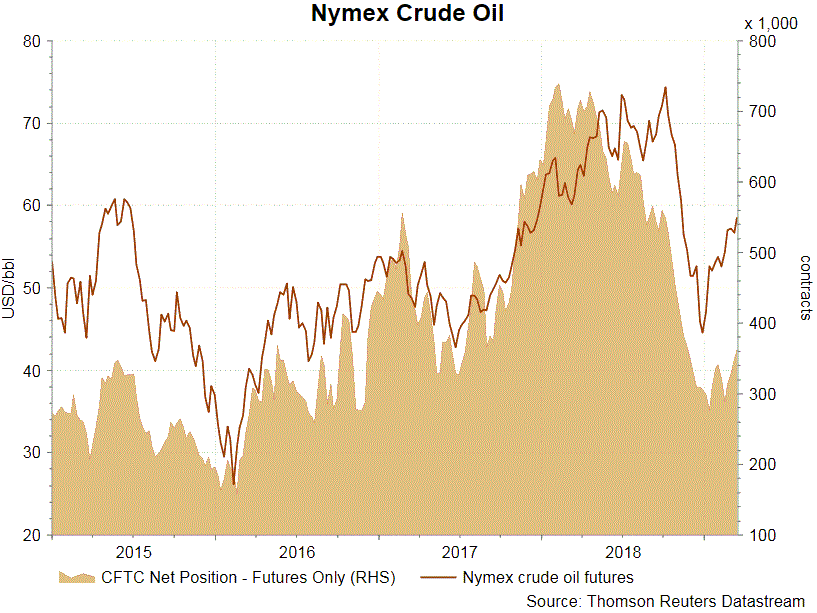
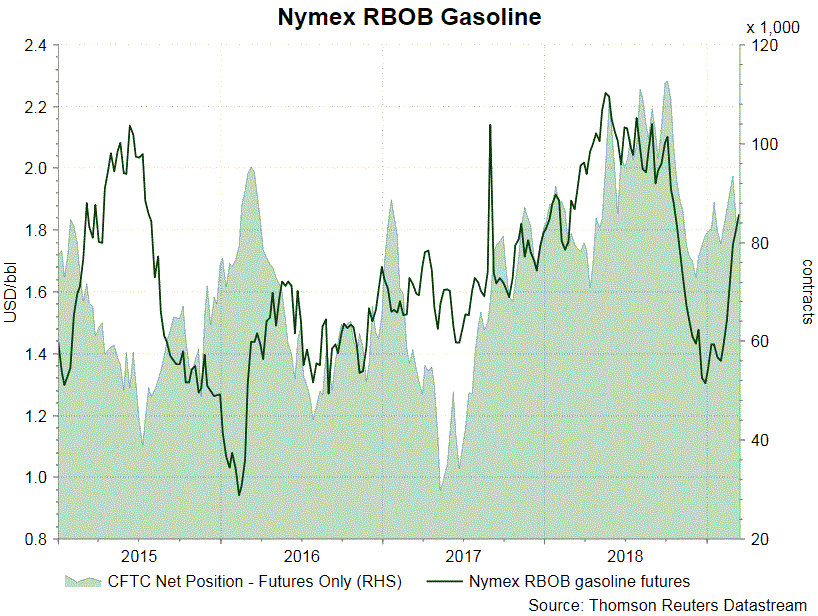
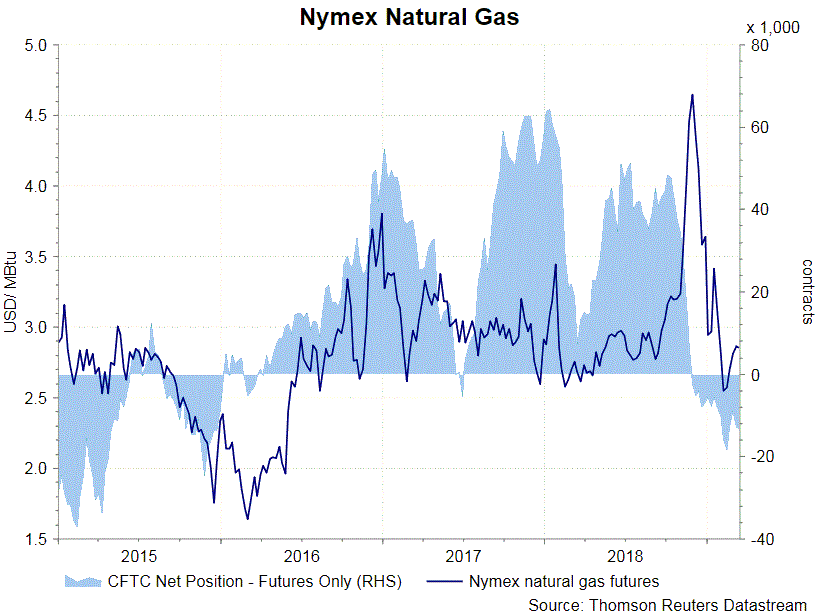
According to the CFTC Commitments of Traders report for the week ended March 12, NET LENGTH for crude oil futures gained +13 464 contracts to 362 265 for the week. Speculative long positions added +2 513 contracts while shorts slumped -10 951. Crude oil prices strengthened last week. Yet, the outlook remains uncertain as the global economy continues to slow. Meanwhile, the OPEC meeting during the weekend might affect the supply outlook. For refined oil products, NET LENGTH for gasoline added +425 contracts to 84 291, while NET SHORT for heating oil added +399 contracts to 13 169 contracts for the week. NET SHORT for natural gas futures plunged -23 771 contracts to 25 581 contracts for the week. 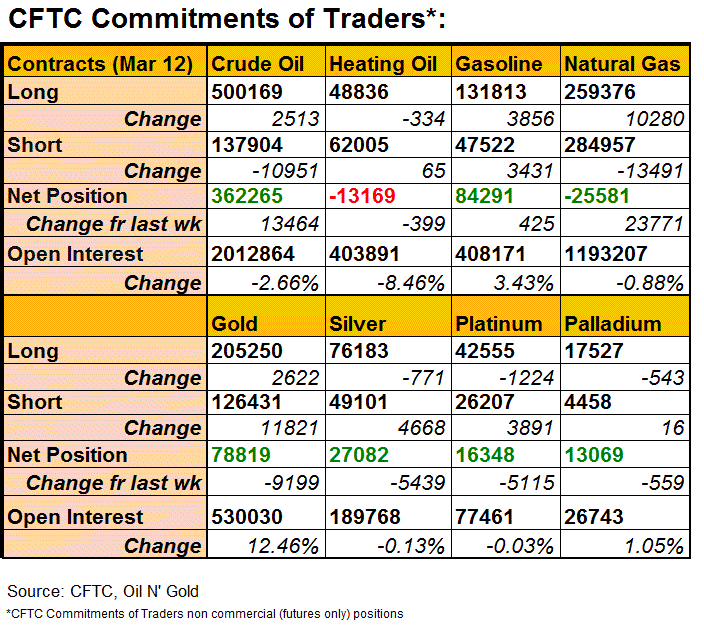
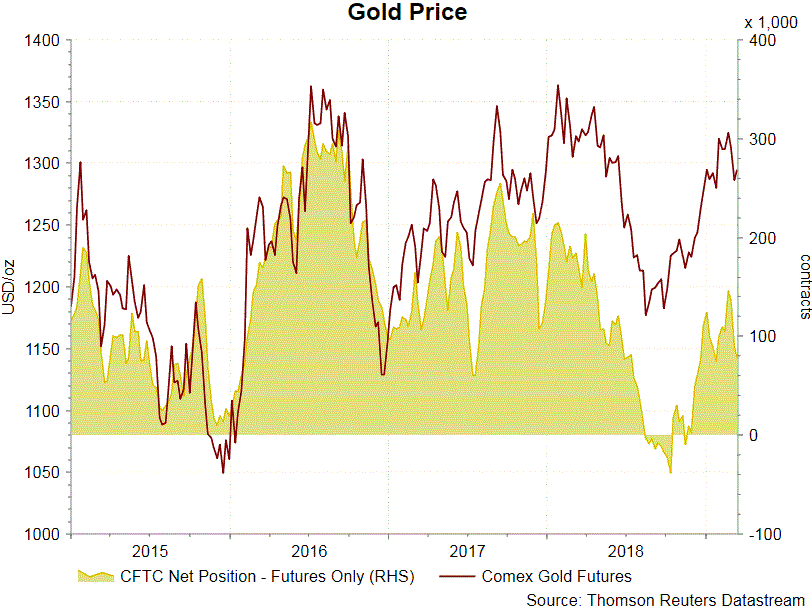
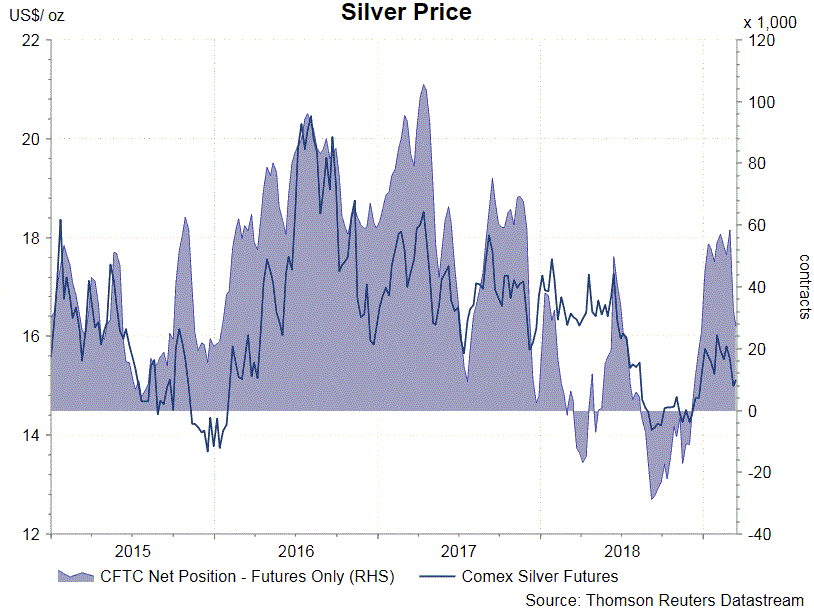
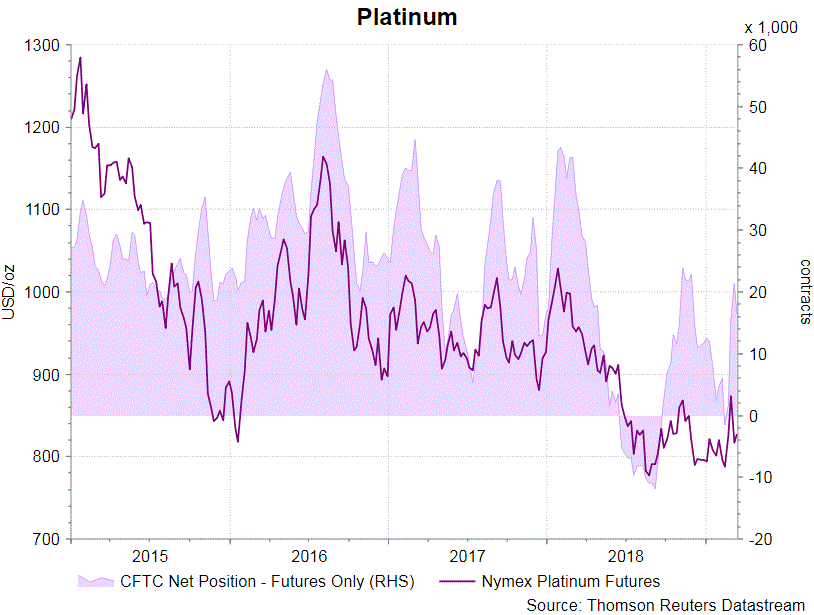
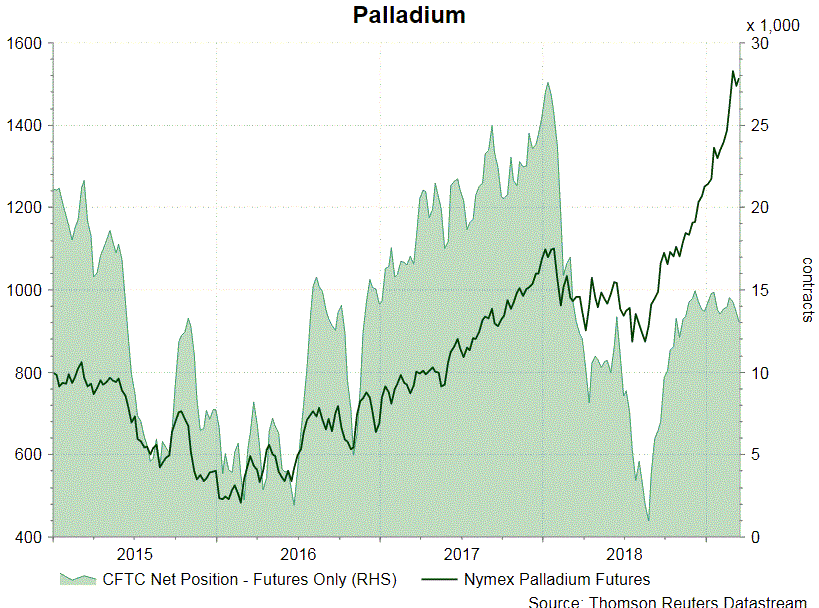
On the precious metal complex, NET LENGTH for both gold and silver futures declined last week. For the former, speculative long positions rose +2 622 contracts, while shorts jumped +11 821, resulting in an fall in NET LENGTH, by -9 199 contracts, to 78 819 contracts. For silver futures, speculative long positions dipped -771 contracts while shorts gained +4 668. These resulted in a fall in NET LENGTH, by -5 439 contracts, to 27 082 contracts. For PGMs, NET LENGTH of Nymex platinum futures decreased -5 115 contracts to 16 348 while that for palladium slid -559 contracts to 13 069.
Forex Forecast and Cryptocurrencies Forecast
First, a review of last week’s events:
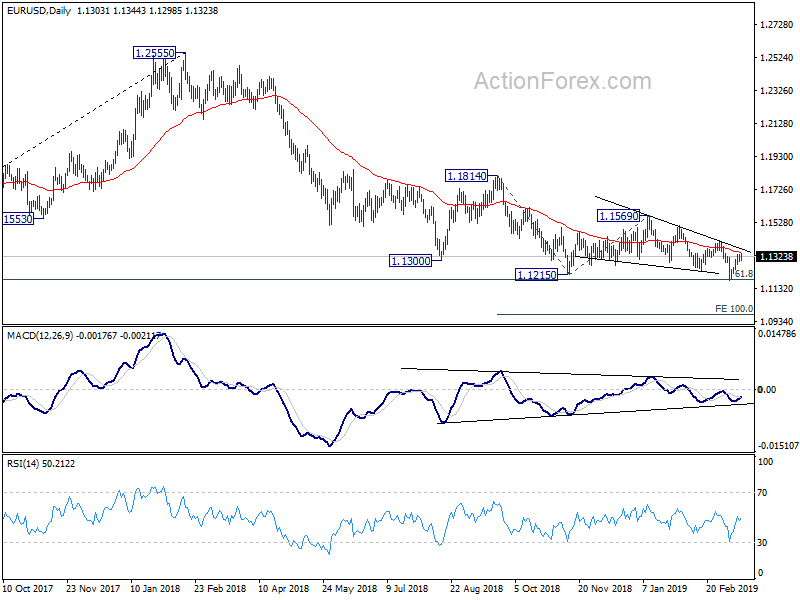
EUR/USD. During the whole week, the European currency was pushed up not only by the growth of the Euro Stoxx 600 index, accompanied by the pigeon rhetoric of the ECB Head Mario Draghi, but also, above all, by an optimistic attitude regarding the exit conditions (and perhaps not the exit) of the UK from the EU. As a result, the pair re-consolidated within the medium-term corridor 1.1215-1.1570, in which it has been moving since end October 2018, and even approached its central line, reaching a height of 1.1338 on Wednesday, March 13.
Thursday, March 14, turned out to be the only bad day for the European currency. It became known on this day that there would be no meeting of the leaders of the United States and China, Donald Trump and Xi Jinping, in March, and it may happen only in April. This news again aroused investors' interest in the dollar, though not for long, and the pair could be seen at 1.1345 on Friday. As for the end of the trading session, thanks to a strong University of Michigan Consumer Sentiment Index, the pair met it 20 points lower, at the level of 1.1325;
GBP/USD. Most experts expected strengthening of the British currency and its growth in March first to the February high (1.3350), and then 200 points higher. This forecast starts to come true: last week's high was fixed at the height of 1.3380, and the pair completed the five-day marathon in the area of a very strong resistance level of 1.3300.
The weekly amplitude of oscillations reached 420 points. And if you look at the pair’s chart, it somehow resembles a cardiogram, whose jumps and falls are related to what was happening these days in London. The Parliament of Great Britain voted against a repeated referendum and spoke in favor of postponing Brexit's deadline to June 30. At the same time, the “hard” exit scenario, without a deal with the EU, was rejected. Now, Prime Minister Theresa May will have to bow to the European Union with a request to postpone Brexit. But the EU {0reaction to this is another question, since all 27 countries of this community should give their consent to this. And what will happen with the new agreement is also unclear. If the parties could not agree for more than two years, what can they do in the next three months?
USD/JPY. As most analysts predicted, the pair remained within the ascending channel, which began at the very beginning of January 2019, and almost reached the bar at 112.00. It stayed only 10 points below this height, but the head of the Bank of Japan, Haruhiko Kuroda, managed to halt the fall of his national currency.
Economic performance of Japan does not look best. The trade deficit is the largest in 6 years, and the reduction in exports to China is the highest in 2 years. This is partly due to the celebration of the New Year in China, but the fact remains that Japan has suffered greatly from the slowdown in global economic growth. The planned increase in sales tax for 2019 does not add optimism either.
However, according to Kuroda, things are not all that bad. “At present,” he said at a press conference on March 15, “our main scenario assumes the recovery of the economies of China and the eurozone in the second half of this year.” “And the Japanese economy itself remains in moderate expansion, and the impulse to achieve the inflation target of 2%, remains unchanged.”
Cryptocurrencies. There is such a famous philosophical paradox, called Buridan's Ass. This is a parable of the ancient Greek philosopher Aristotle, and its meaning lies in the problem of choice. There is a donkey dying of hunger, and it stands exactly in the middle between two absolutely identical heaps of hay. Which one to choose? According to the parable, the donkey could not decide and, in the end, died of hunger.
There are no donkeys in the cryptocurrency community, there are bulls and bears, but even they have been roaming along one line for many weeks, not knowing which way to go in order to get enough profit.
The above is a metaphor. But the fact that the price of Bitcoin has consolidated around $3,900 is a fact. It is for the third week that the maximum volatility does not exceed 200-300 points. Some experts hopefully call this the end of the accumulation phase and the lull before a storm. But what is considered a storm?
As predicted, the BTC/USD pair moved in the $3,850-4,050 corridor last week. Ethereum (ETH/USD) and Litecoin (LTC/USD) demonstrated similar modest volatility. And it was only Ripple (XRP/USD) that showed several spikes, although later everything calmed down and returned to normal.
As for the forecast for the coming week, summarizing the opinions of a number of analysts, as well as forecasts made on the basis of a variety of methods of technical and graphical analysis, we can say the following:
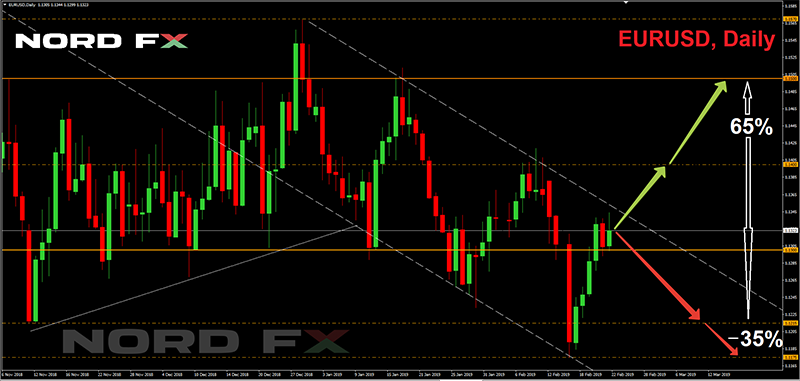
EUR/USD. On the one hand, the slowdown in US GDP and the prospects for economic recovery in the Eurozone play in favor of the European currency. On the other hand, Trump’s threats to launch a new round of economic wars against the EU are causing alarm for the future of the Euro. As a result, most experts (65%) believe that the pair will continue to balance in the range of 1.1215-1.1570. At the same time, positive information on Brexit will contribute to its targeted advancement to the upper boundary of this channel. The nearest strong resistance is in the 1.1400 zone, the next one is 100 points higher.
On Wednesday, March 20, the US Federal Reserve interest rate decision and the traditional press conference of Jerome Powell, the head of this organization, await us. There will most likely be no surprises for the first issue, and the rate will remain unchanged so far. Most of the experts (60%) believe that its next increase will occur only in September or even later. But Powell can make adjustments to these forecasts in his speech, and then the pair may turn down, break down the lower border of the channel 1.1215, and return to the March 7 low, 1.1175. About 15% of experts do not even rule the decline of the pair in March-April to the area of 1.1000-1.1100;
GBP/USD. On Tuesday, March 19 and Wednesday, the 20th a block of macroeconomic data from the UK will be published, and on Thursday the 21st, the decision of the Bank of England on the interest rate. But all these events are fading compared to the next episode of the series called Brexit: there will be another vote in the Parliament on the deal with the EU on March 20, which will certainly cause the pair to increase its volatility.
The pair completed the past week in the zone of a very strong resistance level 1.3300, which it has been trying to overcome since last June. Whether this zone will become a level of support depends on the note on which this meeting of the Parliament ends, and also what signals will come from the Bank of England the next day. 70% of analysts, supported by 90% of trend indicators and oscillators on D1, are optimistic, considering that the pair will be able to rise to the level of 1.3470. The next target is 1.3600.
An alternative point of view is supported by 30% of experts. According to them, the pound has already exhausted its potential, and the pair is facing lateral movement in the channel 1.2960-1.3300. Support/resistance levels are 1.3080 and 1.3200;
USD/JPY. The basic forecast for this pair remains the same: 75% of analysts believe that the uptrend will continue, the pair will overcome the bar at 112.00, after which it is expected to move in the side channel 112.25-113.70, as it was in last November-December.
The forecast that is drawn by graphical analysis on D1 looks more restrained: lateral movement within 111.35-112.70.
As for indicators, 70% of them, both on H4 and D1, are colored green, 20% are gray, neutral, and only 10% are red.
In the case of a trend reversal, support levels are 109.10, 110.25 and 110.75;
Cryptocurrencies. If you look at the Bitcoin chart, you have a bad feeling about another disaster. Look at the segment from mid-July to mid-November 2018: gradual decrease in volatility, consolidation, calm and, as a result ... a drop in quotes by almost 45%, - from $6,500 to $3,660.
And now take a look at the period from mid-November to today. You see absolutely the same picture: a gradual decrease in volatility, consolidation, calm and, as a result ... But what the result will be, is still unknown. The crypto market is known for its unpredictability. Although, 70% of specialists vote for the fall of the pair BTC/USD in spring below $3,000.
As for the forecast for the near future, it remains unchanged: most likely, the pair will continue to move along the horizon of $3,900 with quotes spikes by 200-300 points in one direction or another. It should be noted that the trading conditions offered by the brokerage company NordFX make it possible to profit intraday even on most minor fluctuations of cryptocurrencies. Trading takes place on the MT4 and MT5 platforms familiar to traders, commissions are minimal, and just $100 for MT5 or $300 for MT4 is enough to open a buy or a sell position with a volume of 1 Bitcoin (1 lot).
EUR/USD Weekly Outlook
EUR/USD's rebound from 1.1176 continued last week despite lost of upside momentum. No change in the view that it's a corrective move. Hence, in case of another rise, upside should be limited below 1.1419 resistance to bring down trend resumption. On the downside, below 1.1277 minor support will turn bias to the downside for 1.1176 low first. Break of 1.1176 will target 100% projection of 1.1814 to 1.1215 from 1.1569 at 1.0970 next.
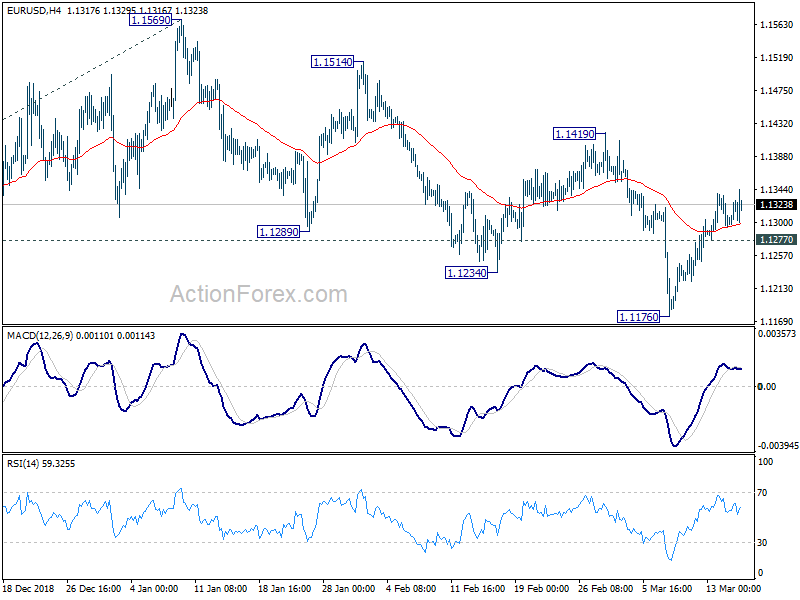
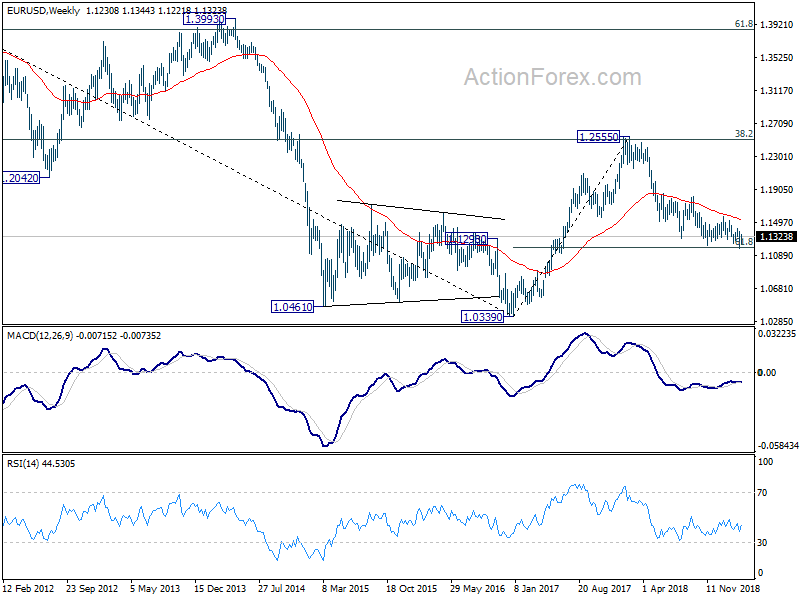
In the bigger picture, down trend from 1.2555 medium term top is still in progress. Bearishness is affirmed by sustained trading below falling 55 week EMA. 61.8% retracement of 1.0339 (2017 low) to 1.2555 at 1.1186 is met. Sustained break there will pave the way to retest 1.0339. On the upside, break of 1.1569 resistance will now indicate completion of such down trend and turn medium term outlook bullish.
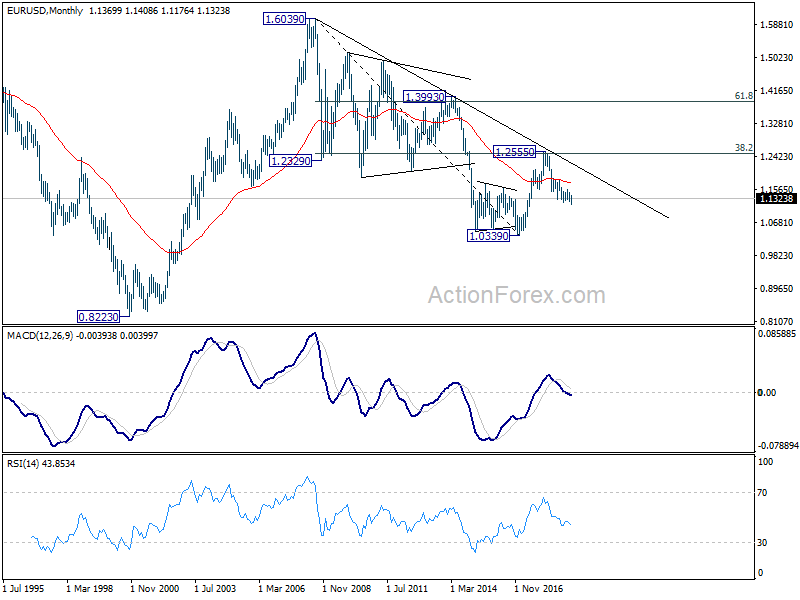
In the long term picture, the rejection from 38.2% retracement of 1.6039 to 1.0339 at 1.2516 argues that long term down trend from 1.6039 (2008 high) might not be over yet. EUR/USD is also held below decade long trend line resistance. Firm break of 61.8% retracement of 1.0339 to 1.2555 at 1.1186 should at least bring a retest on 1.0339 low. This will remain the favored case as long as 1.1569 resistance holds.
USD/JPY Weekly Outlook
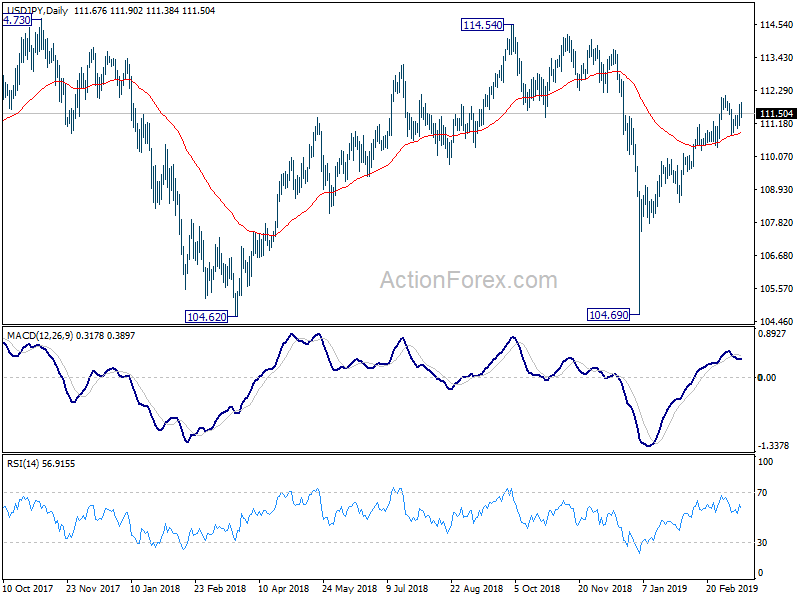
USD/JPY rebounded further last week but was held below 112.13 resistance. Initial bias remains neutral this week for some more consolidation. But still, as long as 110.35 support hold, near term outlook remains bullish. On the upside, break of 112.13 will resume the rally from 104.69 to 114.54 resistance next. However, firm break of 110.35 should confirm near term reversal and turn outlook bearish for 108.49 support and below.
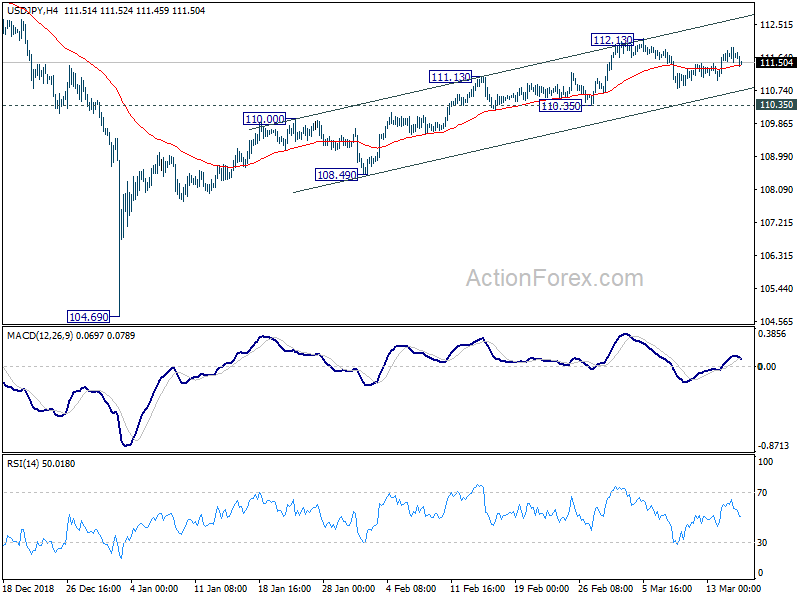
In the bigger picture, strong rebound from 104.69 argues that decline from 118.65 (2016 high) has completed with three waves down to 104.69, after failing 104.62. More importantly, the rise from 98.97 (2016 low) could be resuming. Decisive break of 114.54 resistance will add more credence to this bullish case and target 118.65. This will now be the favored case as long as 110.35 support holds. However, firm break of 110.35 will mix up the medium term outlook again and turn focus back to 104.69 low.
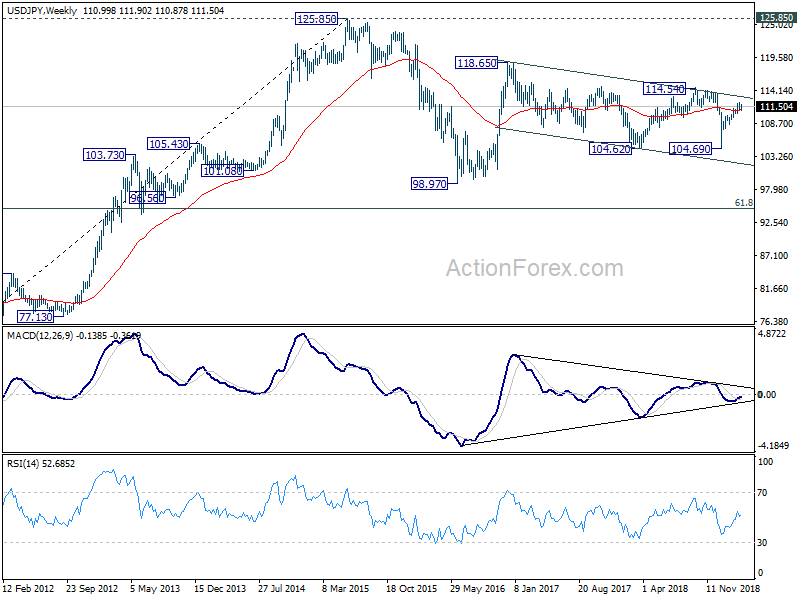
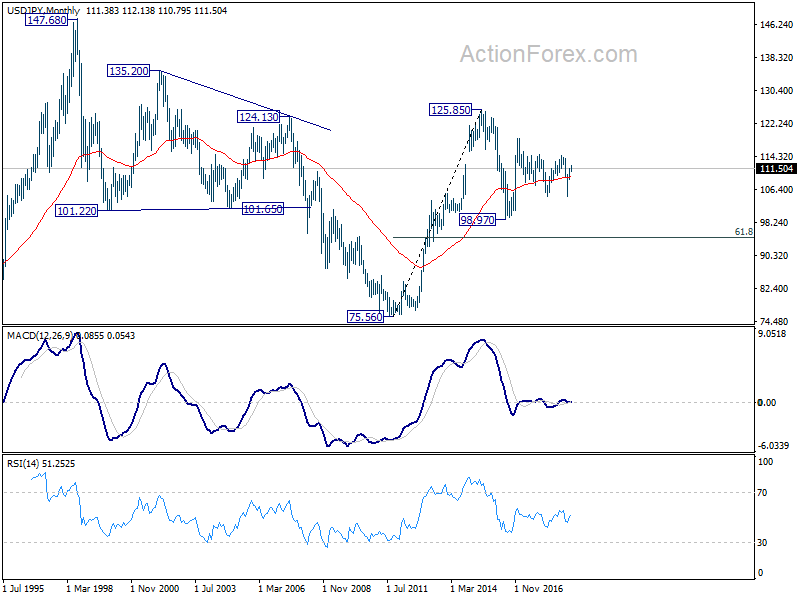
In the long term picture, the rise from 75.56 (2011 low) long term bottom to 125.85 (2015 high) is viewed as an impulsive move, no change in this view. Price actions from 125.85 are seen as a corrective move which could still extend. In case of deeper fall, downside should be contained by 61.8% retracement of 75.56 to 125.85 at 94.77. Up trend from 75.56 is expected to resume at a later stage for above 135.20/147.68 resistance zone.
GBP/USD Weekly Outlook
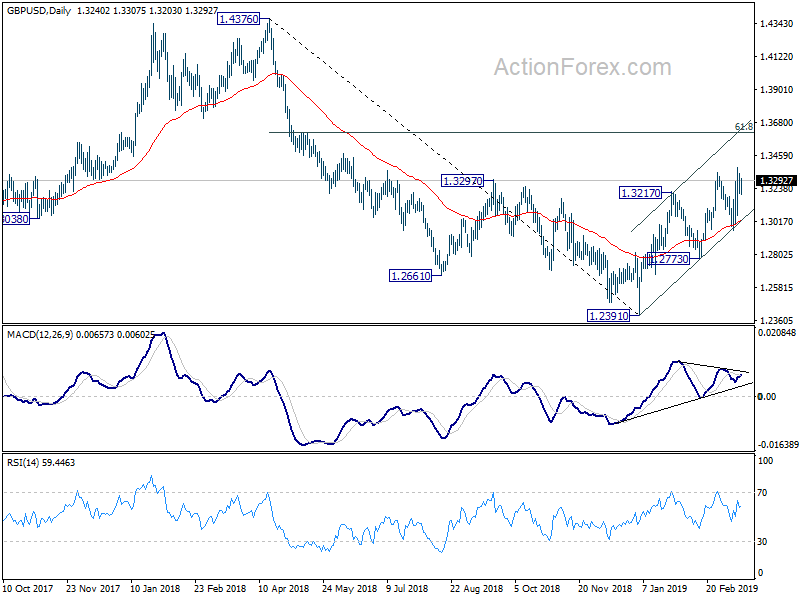
GBP/USD's rise from 1.2391 resumed last week by breaching 1.3350 to 1.3381. But the pair then lost momentum and retreated. Initial bias remains neutral this week first. Further rise is expected as long as 1.2960 support holds. On the upside firm break of 1.3381 will target 61.8% retracement of 1.4376 to 1.2391 at 1.3618 next. However, on the downside, firm break of 1.2960 will indicate that rebound from 1.2391 has completed earlier than expected. Deeper fall would then be seen to 1.2773 support for confirmation.
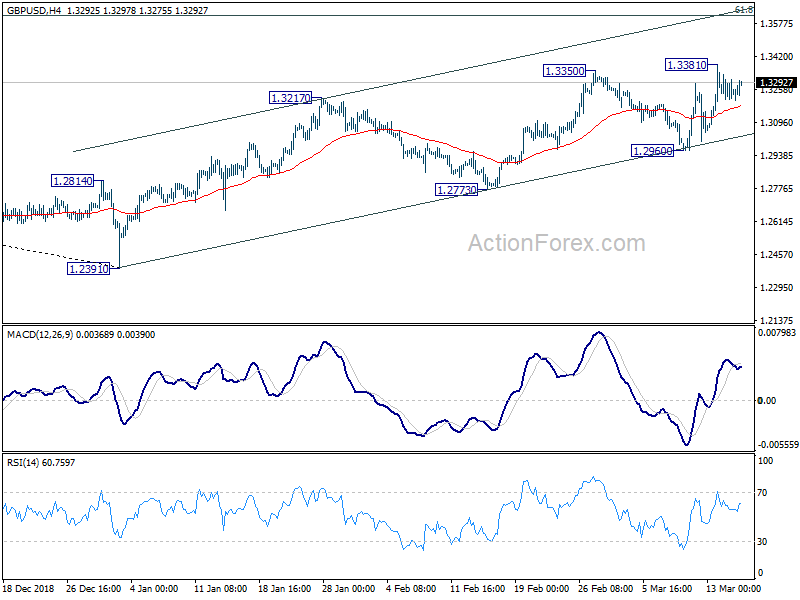
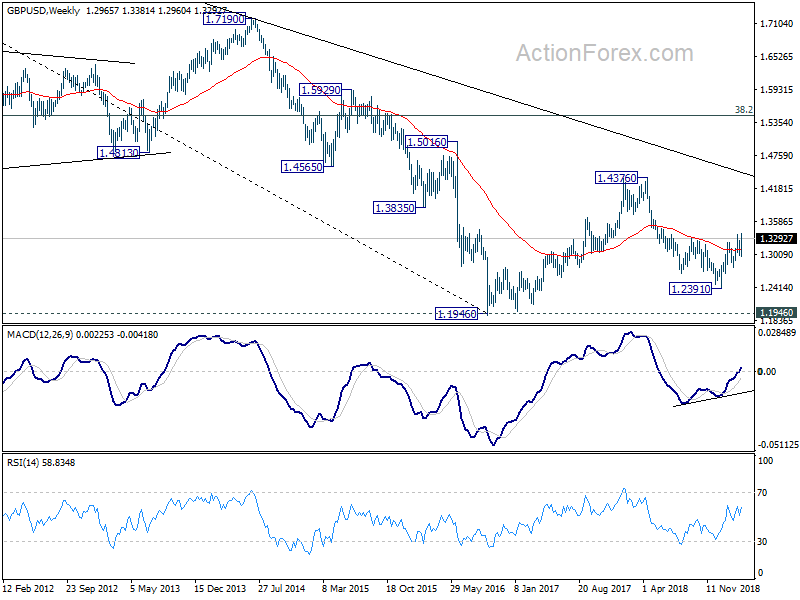
In the bigger picture, medium term decline from 1.4376 (2018 high) should have completed at 1.2391. Rise from 1.2391 is now seen as the third leg of the corrective pattern from 1.1946 (2016 low). Further rise could be seen through 1.4376 in medium term. On the downside, though, break of 1.2773 support will dampen this view. Focus will be turned back to 1.2391 low and break will resume the fall from 1.4376 to 1.1946.
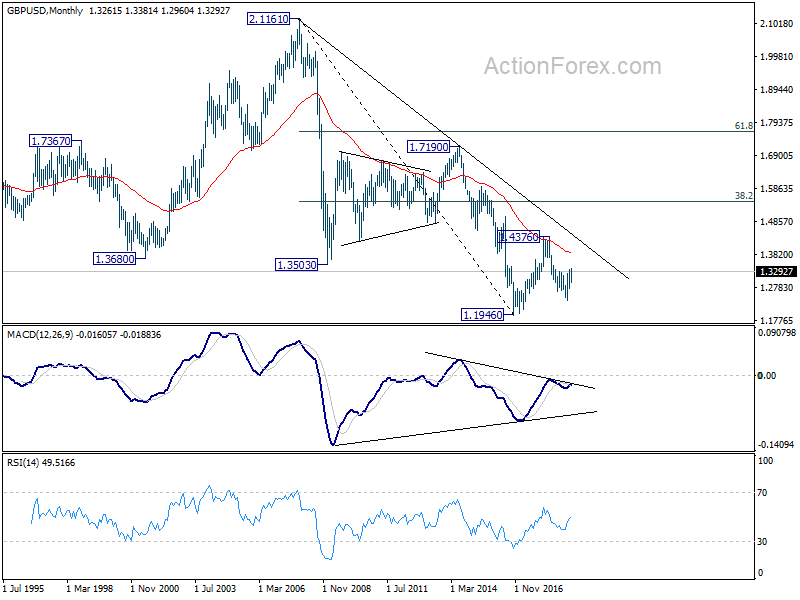
In the longer term picture, current development argues that corrective pattern from 1.1946 (2016 low) is extending with another rise. But there is no change in the long term bearish outlook as long as 38.2% retracement of 2.1161 (2007 high) to 1.1946 at 1.5466 holds. An eventual downside breakout through 1.1946 is still in favor in the long term.
USD/CHF Weekly Outlook
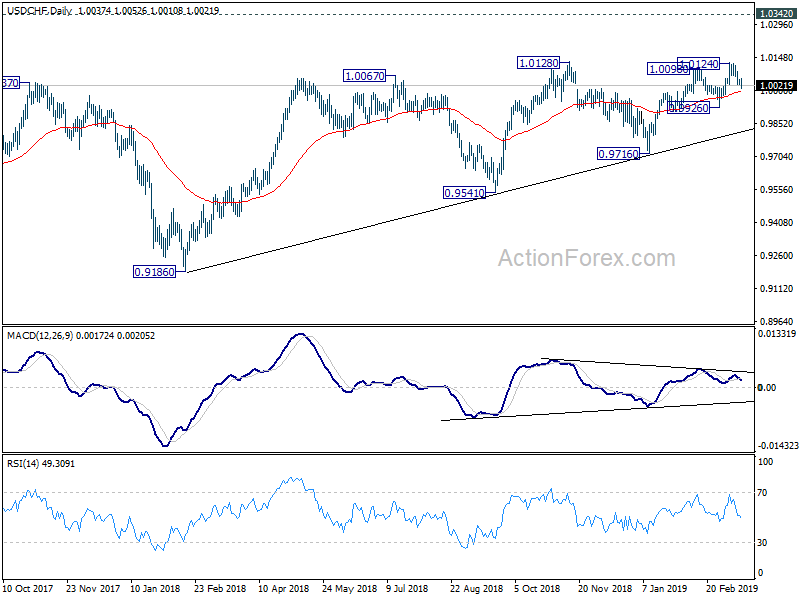
USD/CHF's deeper than expected fall last week suggest that rise from 0.9926 has possibly completed at 1.0124 already, ahead of 1.0128 resistance. Initial bias stays mildly on the downside for 0.9926. Break will carry larger bearish implication. On the upside, though, break of 1.0063 minor resistance will turn bias back to the upside for retesting 1.0124 instead.
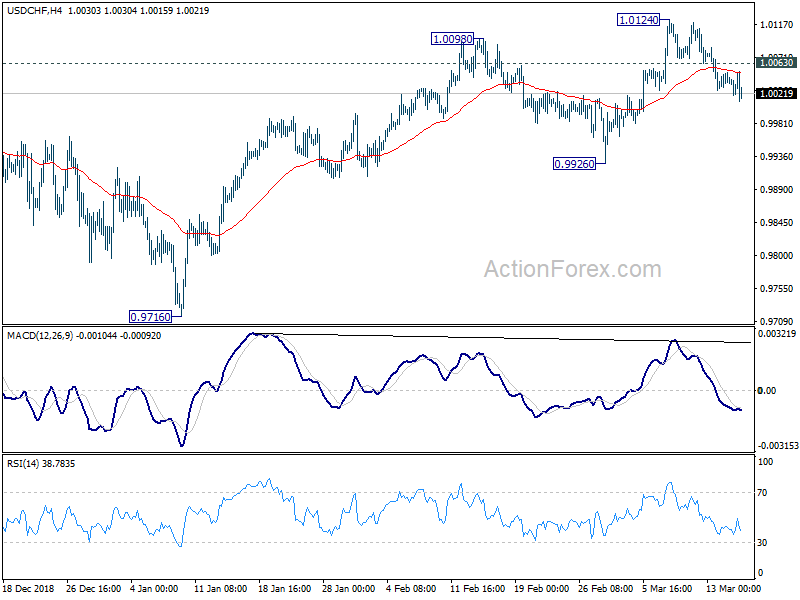
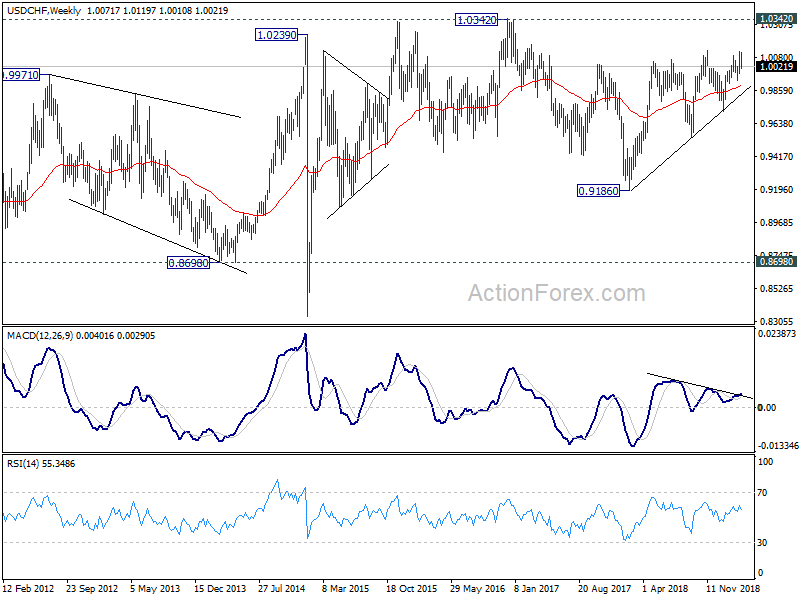
In the bigger picture, USD/CHF drew strong support from medium term trend line and rebounded. That suggests rise from 0.9186 is still in progress. Further break of 1.0128 will confirm up trend resumption and target 1.0342 key resistance. Nevertheless, break of 0.9926 support will be the first signal of medium term reversal and bring another test on the trend line.
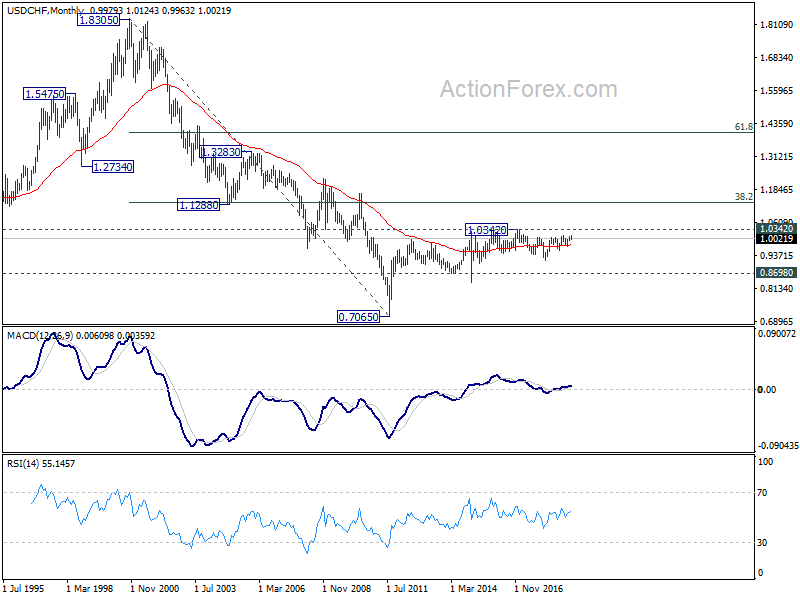
In the long term picture, price actions from 0.7065 (2011 low) are not clearly impulsive yet. Thus, we'll treat it as developing into a corrective pattern, at least, until a firm break of 1.0342 resistance.
AUD/USD Weekly Outlook
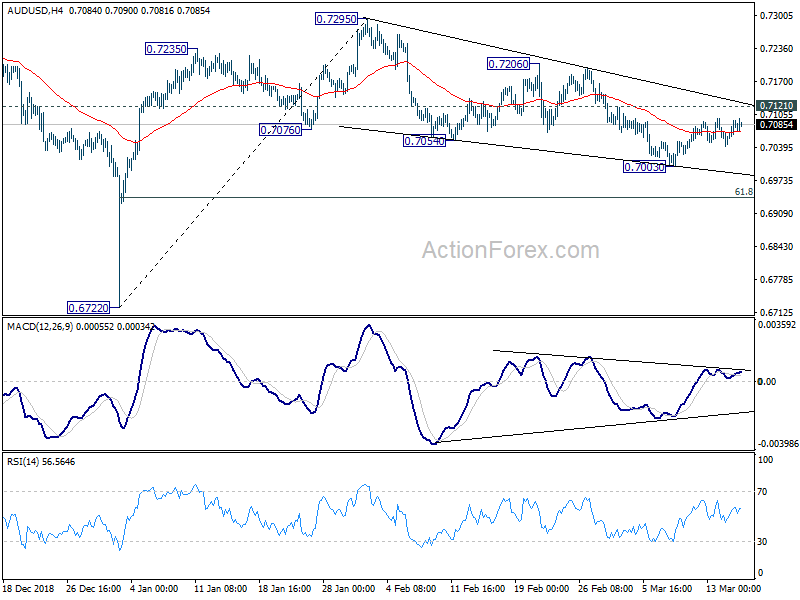
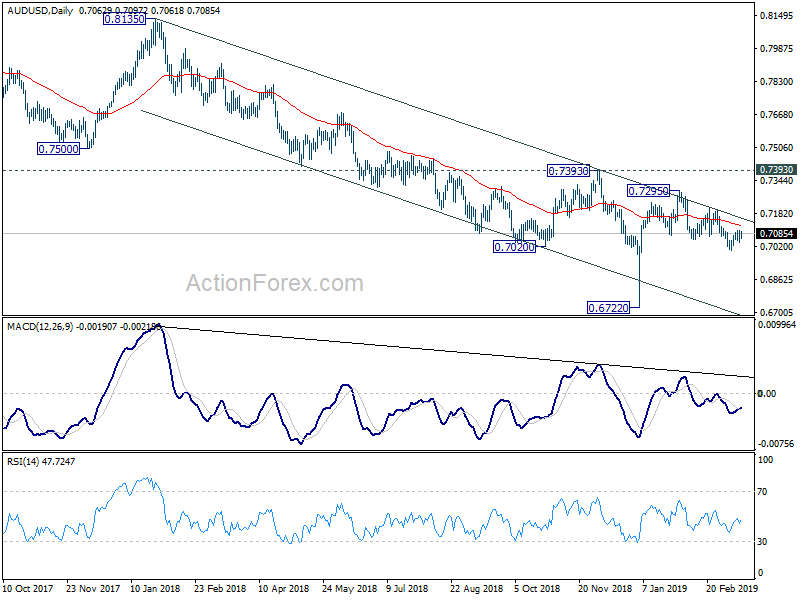
AUD/USD stayed in consolidation above 0.7003 last week and outlook is unchanged. Initial bias remains neutral this week first. In case of another recovery, upside should be limited by 0.7121 minor resistance to bring fall resumption. On the downside, break of 0.7003 will resume the fall from 0.7295 to 61.8% retracement of 0.6722 to 0.7295 at 0.6941 and below. However, sustained break of 0.7121 resistance will dampen this view and bring stronger rise to 0.7206 and above.
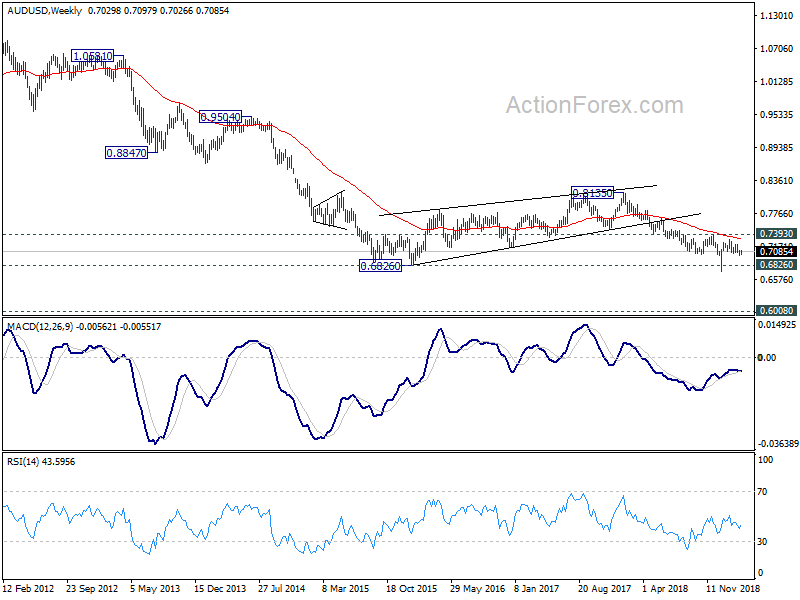
In the bigger picture, as long as 0.7393 resistance holds, we'd treat fall from 0.8135 as resuming long term down trend from 1.1079 (2011 high). Decisive break of 0.6826 (2016 low) will confirm this bearish view and resume the down trend to 0.6008 (2008 low). However, firm break of 0.7393 will argue that fall from 0.8135 has completed. And corrective pattern from 0.6826 has started the third leg, targeting 0.8135 again.
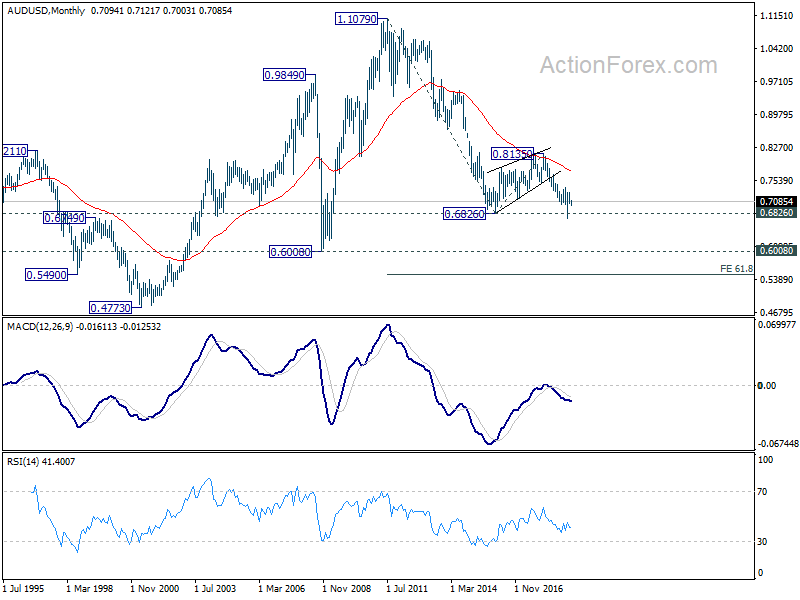
In the longer term picture, prior rejection by 55 month EMA maintained long term bearishness in AUD/USD. That is, down trend from 1.1079 (2011 high) is still in progress. Sustained break of 0.6826 will target 0.6008 low and then 61.8% projection of 1.1079 to 0.6826 from 0.8135 at 0.5507.
USD/CAD Weekly Outlook
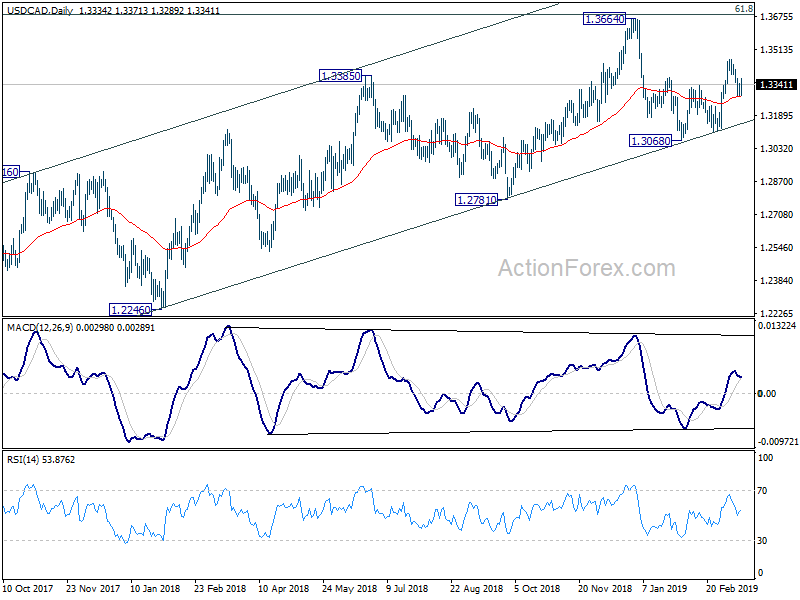
USD/CAD dropped to 1.3289 last week but drew support from 55 day EMA and recovered. Initial bias is neutral this week first. On the upside, break of 1.3371 minor resistance will suggest that pull back from 1.3467 has completed. That will also revive the bullish case that rise from 1.3068 is still in progress. In such case, intraday bias will be turned back to 1.3467 resistance and above. However, break of 1.3289 will extend the decline from 1.3467 to 1.3068/3112 support zone.
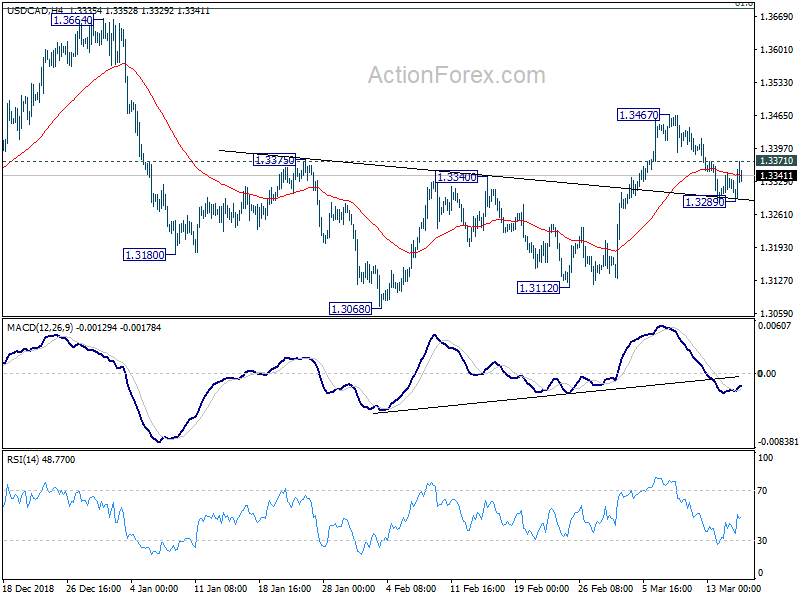
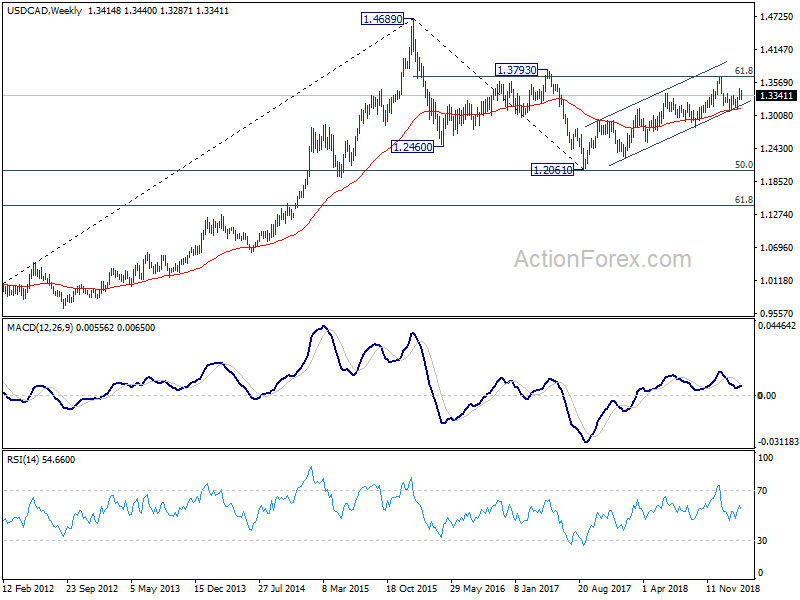
In the bigger picture, structure of the medium term rise from 1.2061 (2017 low) to 1.3664 is not clearly impulsive. Hence, we'd stay cautious on strong resistance from 61.8% retracement of 1.4689 (2016 high) to 1.2061 at 1.3685 and 1.3793 resistance to limit upside, and bring medium term topping. But in any case, medium term outlook will stay bullish as long as channel support (now at 1.3157) holds. Sustained break of 1.3793 will pave the way to retest 1.4689 (2015 high). Firm break of the channel support should confirm reversal target 1.2061 low again.
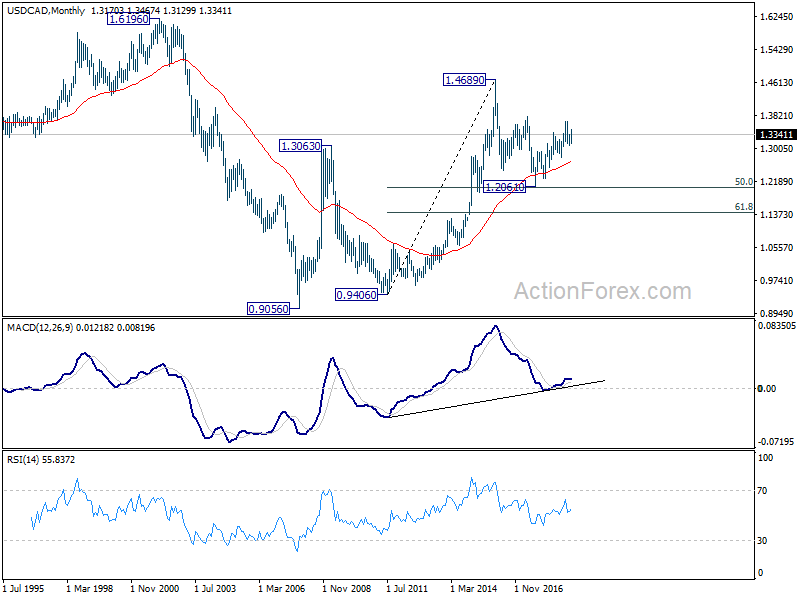
In the longer term picture, corrective fall from 1.4689 (2015 high) should have completed with three waves down to 1.2061, just ahead of 50% retracement of 0.9406 (2011 low) to 1.4689 (2015 high) at 1.2048. The development keeps long term up trend from 0.9406 and that from 0.9056 (2007 low) intact. For now, there is still prospect of extending the long term up trend through 1.4689.
GBP/JPY Weekly Outlook
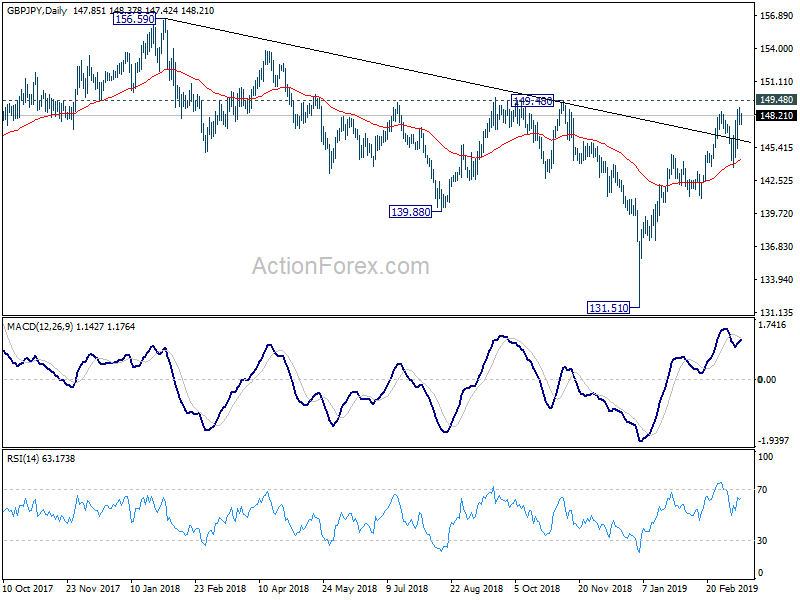
GBP/JPY's strong rebound last week firstly suggests that rise from 131.51 is still in progress. Nevertheless, it failed to extend gains after breaching 148.75 to 148.87. Initial bias is neutral first. On the upside, decisive break of 149.48 key resistance will carry larger bullish implication and target 156.58 resistance next. On the downside, though, break of 143.72 support will indicate near term reversal and turn outlook bearish for 141.00 support.
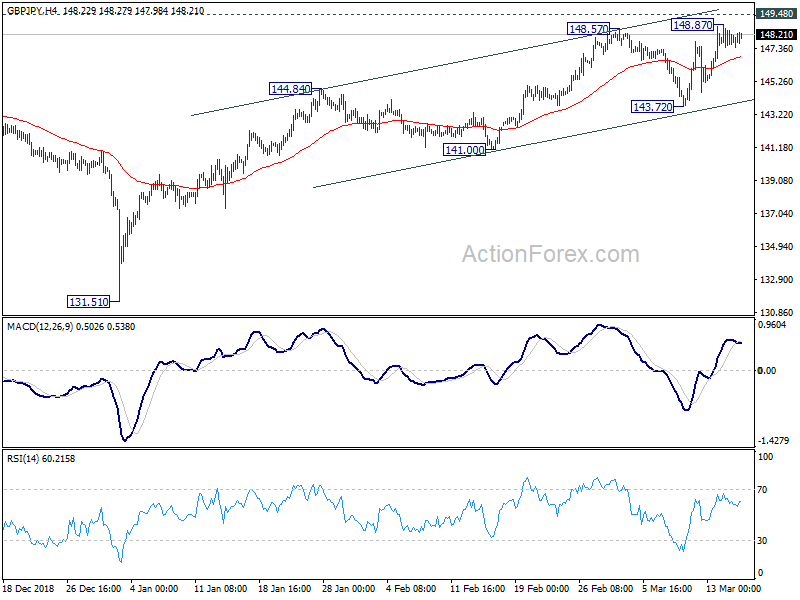
In the bigger picture, the strong rebound from 131.51 suggests that medium term fall from 156.59 (2018 high) has completed already. The corrective structure of such decline in turn argues that it's the second leg of the corrective pattern from 122.36 (2016 low). And this pattern is starting the third leg. On the upside, decisive break of 149.48 will pave the way to 156.59 resistance and above. However, firm break of 141.00 support will dampen this view and turn focus back to 131.51 low instead.
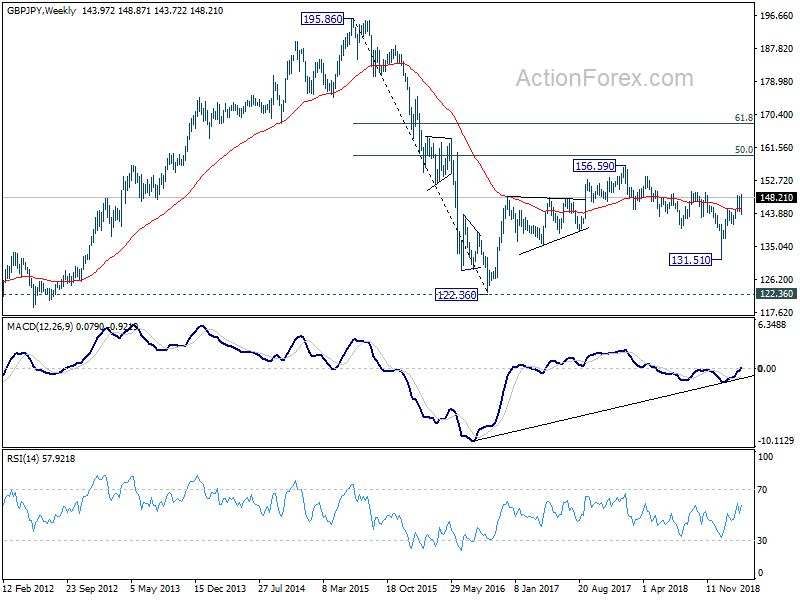
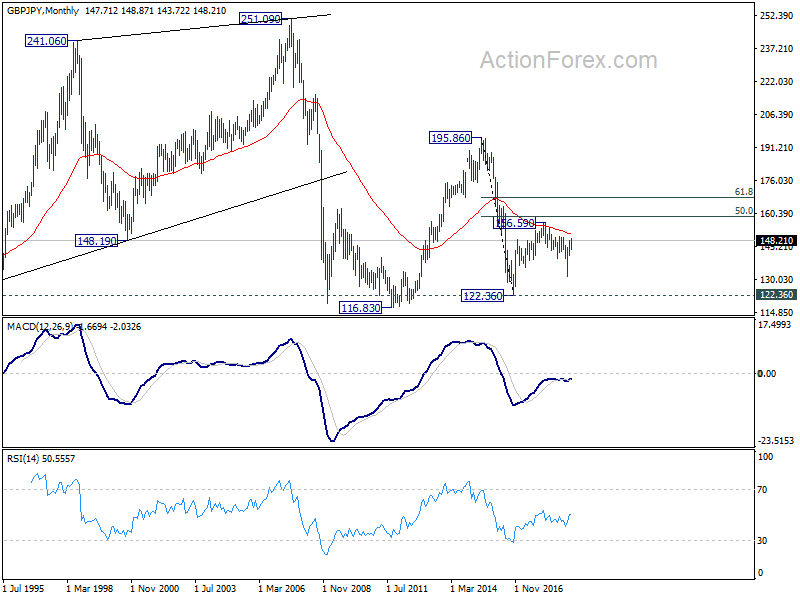
In the longer term picture, the rise from 122.36 (2016 low) to 156.59 (2018 high) doesn't display a clear impulsive structure. Thus, we're treating price actions from 122.36 as a corrective pattern. In case of an extension, strong resistance is likely to be seen at 50% retracement of 195.86 (2015 high) to 122.36 at 159.11 to limit upside. On the downside, break of 131.51 support will bring 122.26 low back into focus.
EUR/JPY Weekly Outlook
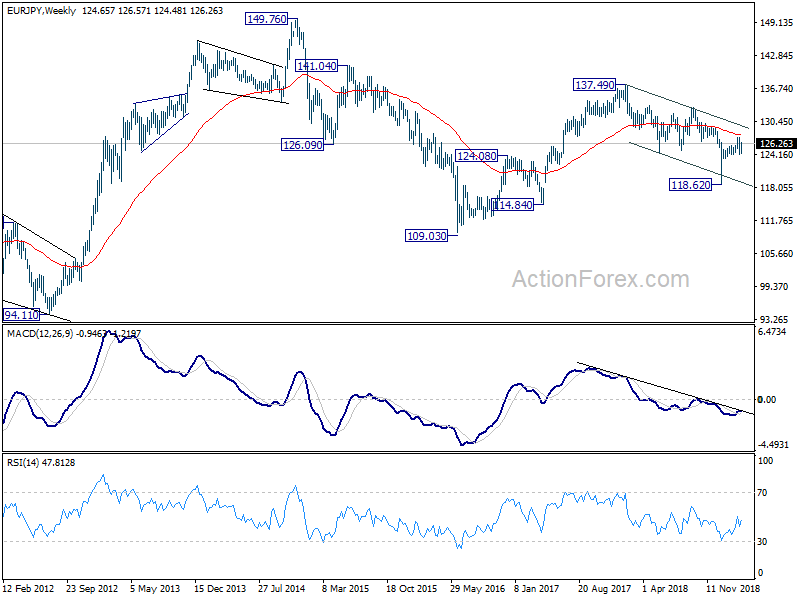
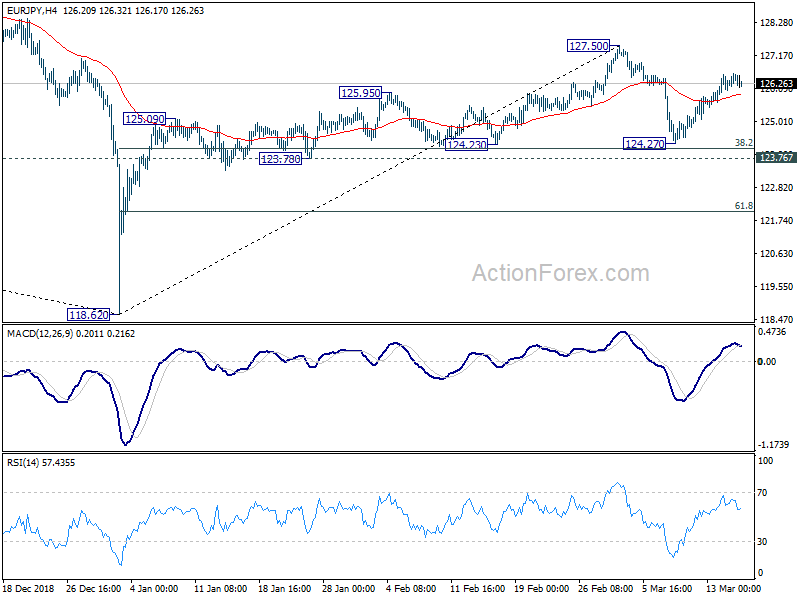
EUR/JPY's strong rebound last suggests that pull back from 127.50 has completed at 124.17. With 124.23 cluster support (38.2% retracement of 118.62 to 127.50 at 124.10) intact, near term bullish ness is retained. Though, as EUR/JPY lost momentum as seen in 4 hour MACD, initial bias is neutral this week first. On the upside, break of 127.50 will target 129.50 resistance next. On the downside, however, decisive break of 124.10/23 should confirm completion of whole rebound from 118.61. Deeper fall should at least be seen to 61.8% retracement at 122.01 and below. In this case, the chance of resuming larger down trend will also increase.
In the bigger picture, current development argues that medium term decline from 137.49 (2018 high) has completed with three waves down to 118.62 already. Decisive break of 133.12 resistance will confirm this bullish case. And whole up trend from 109.03 (2016 low) might resume through 137.49 in that case. On the downside, break of 124.23 support will invalidate this case. And in such case, the down trend from 137.49 could possibly resume through 118.62.
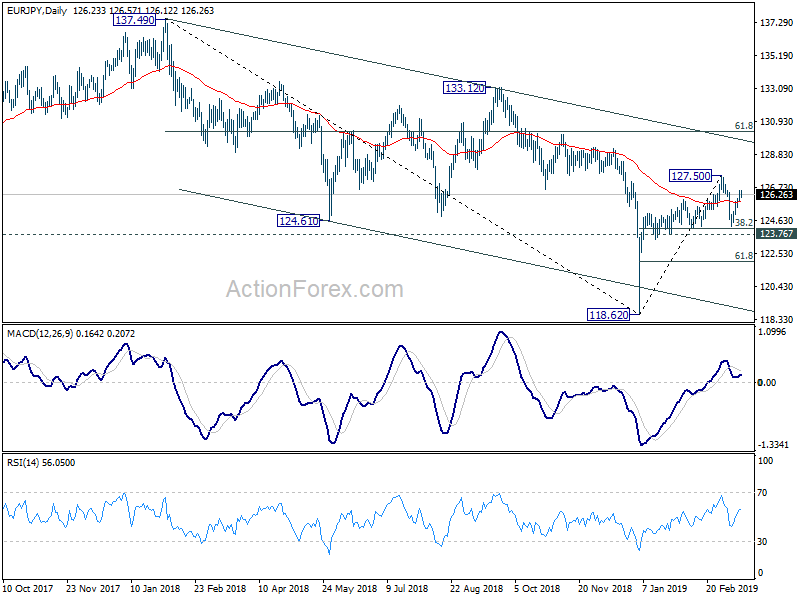
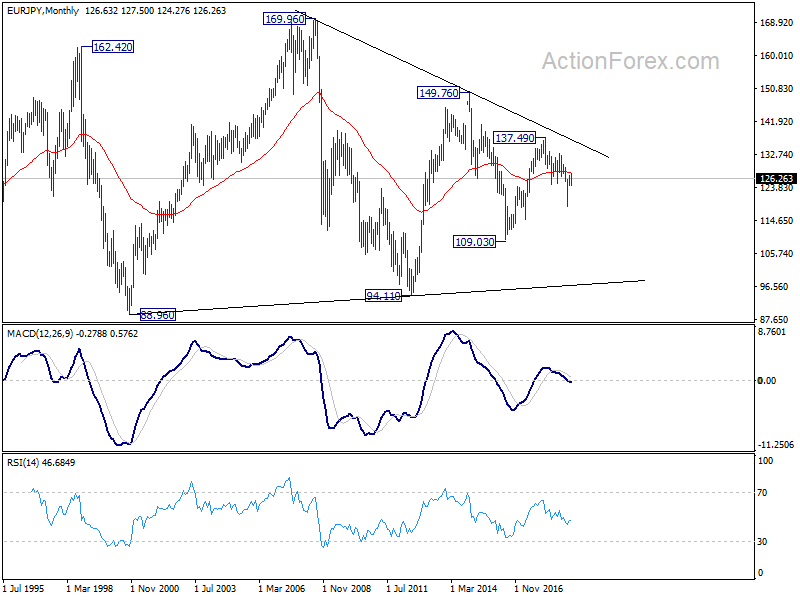
In the long term picture, EUR/JPY is staying in long term sideway pattern, established since 2000. Fall from 137.49 is seen as a falling leg inside the pattern and could have completed. Break of 133.12 resistance will likely send EUR/JPY through 137.49 towards 149.76 (2014 high).