

Sample Category Title
EUR/AUD Weekly Outlook
EUR/AUD stayed in sideway trading last week and outlook is unchanged. Initial bias remains neutral this week first. As price actions from 1.5721 is seen as a consolidation pattern, decline from 1.6765 is likely still in progress. That is, a downside breakout is in favor. On the downside, break of 1.5721 low will resume the decline from 1.6765 and target 1.5346 support. On the upside, above 1.6122 will resume the corrective rise from 1.5721 instead.
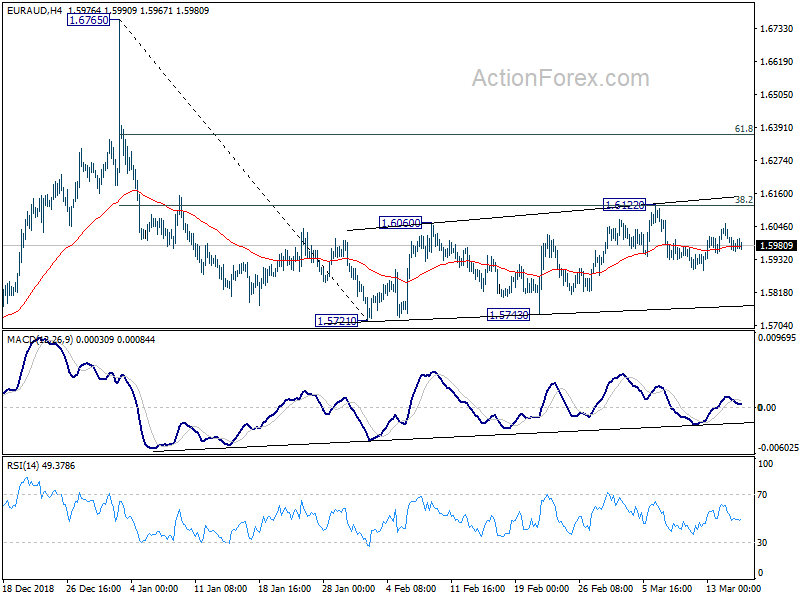
In the bigger picture, as long as 1.5346 support holds, outlook will remain bullish. Uptrend from 1.1602 (2012 low) is expected to resume sooner or later. Break of 1.6765 will target 61.8% retracement of 2.1127 (2008 high) to 1.1602 at 1.7488 next. However, firm break of 1.5346 key support will indicate trend reversal, with bearish divergence condition in weekly MACD, and turn outlook bearish.
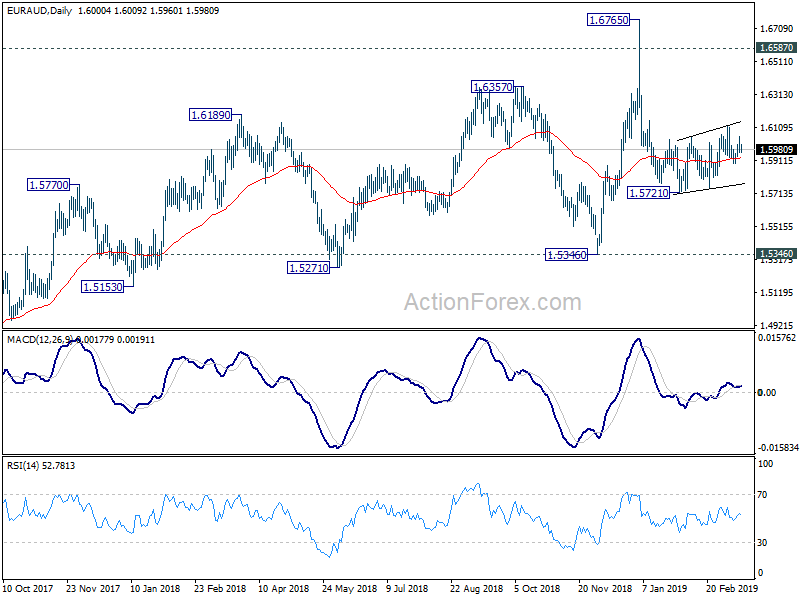
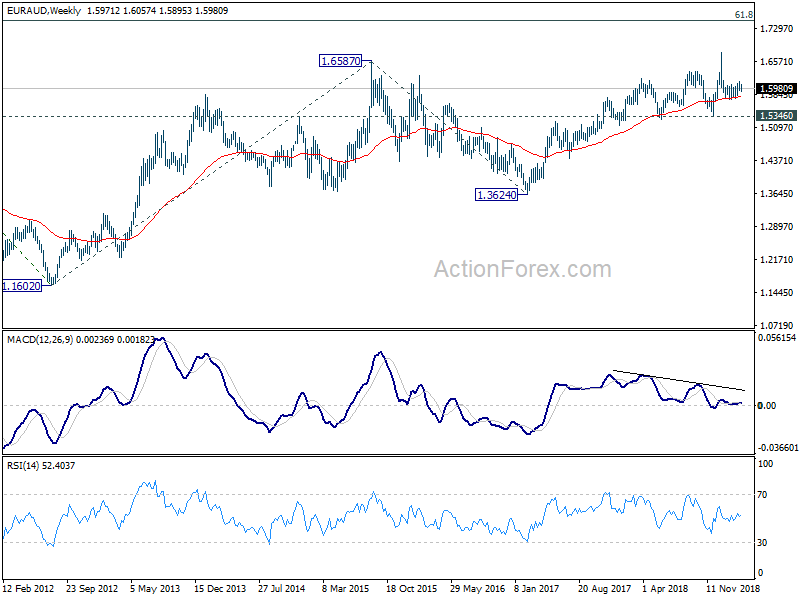
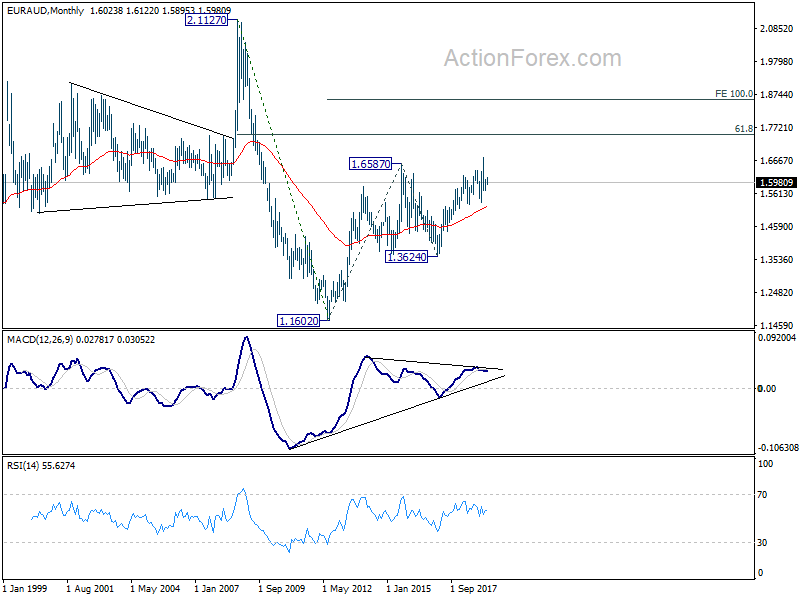
In the longer term picture, the rise from 1.1602 long term bottom (2012 low) is still in progress for 61.8% retracement of 2.1127 to 1.1602 at 1.7488. Firm break there will pave the way to 100% projection of 1.1602 to 1.6587 from 1.3624 at 1.8069. This will remain the favored case as long as 1.5346 remains intact.
EUR/CHF Weekly Outlook
EUR/CHF stayed in consolidation last week and outlook is unchanged. Initial bias remains neutral first and some more sideway trading could be seen. Further rise is expected with 1.1310 support intact. On the upside, firm break of 1.1444 resistance will resume the rebound from 1.1181 and target 1.1501 key resistance next. On the downside, firm break of 1.1310 will indicate completion of the rebound. In that case, intraday bias will be turned back to the downside for 1.1181 low again.
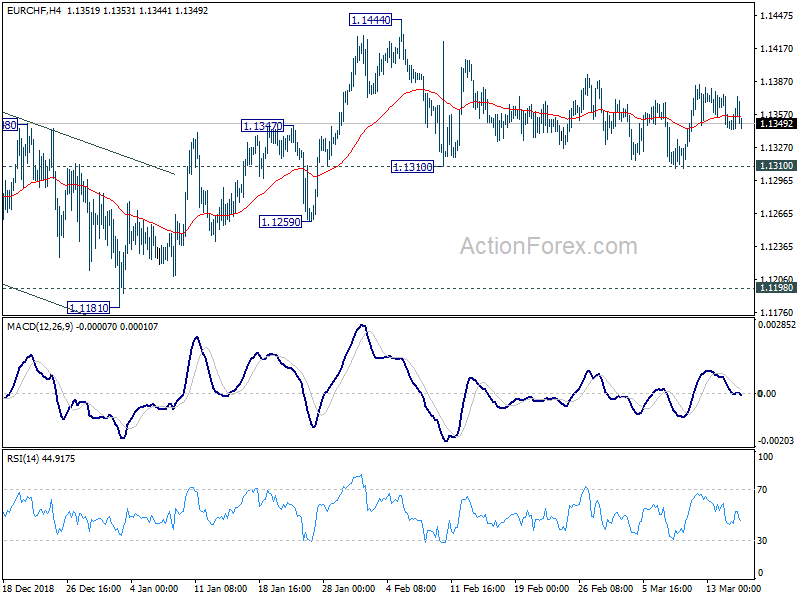
In the bigger picture, price actions from 1.2004 medium term top is seen as a correction only. Downside should be contained by 1.1154/98 support zone to complete it and bring rebound. Decisive break of 1.1501 (38.2% retracement of 1.2004 to 1.1173 at 1.1490) will confirm completion of the correction. Further rise should be seen to 61.8% retracement at 1.1687 and above next.
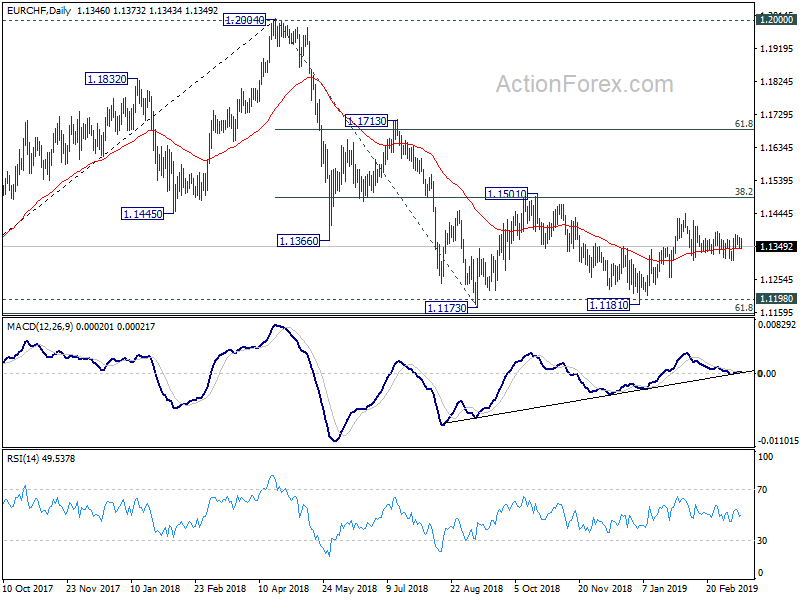
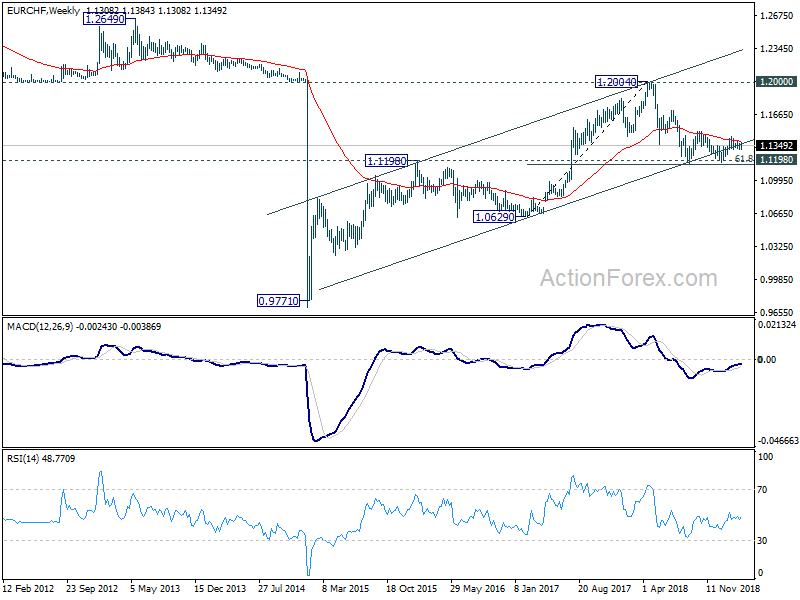
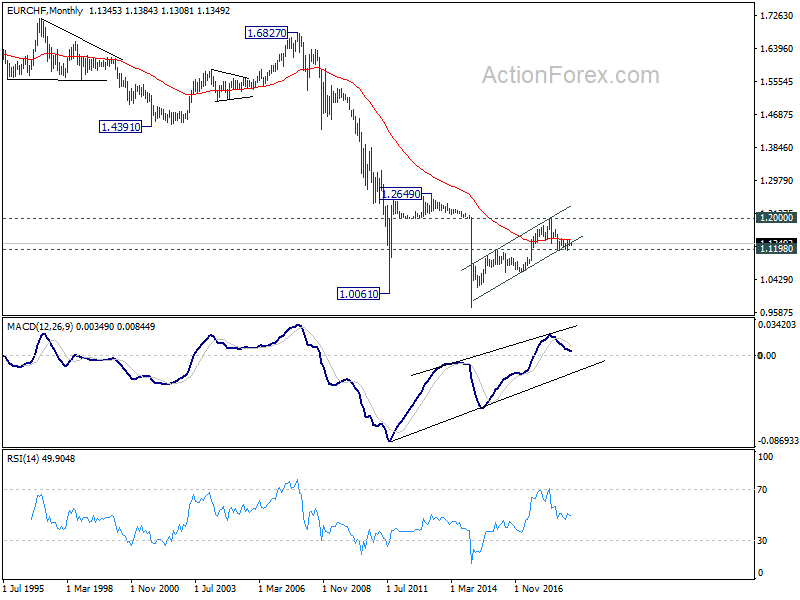
In the long term picture, as long as key support zone of 1.1198 (2016 high) and 61.8% retracement of 1.0629 to 1.2004 at 1.1154 holds, A break of 1.2 key resistance is still expected in the medium to long term. However, sustained break of the mentioned support zone will mark reversal of the long term trend. In that case, 1.0629 key support will be back into focus.
With No Clarity on Brexit and Trade War Yet, Focus Will Turn to FOMC Projections
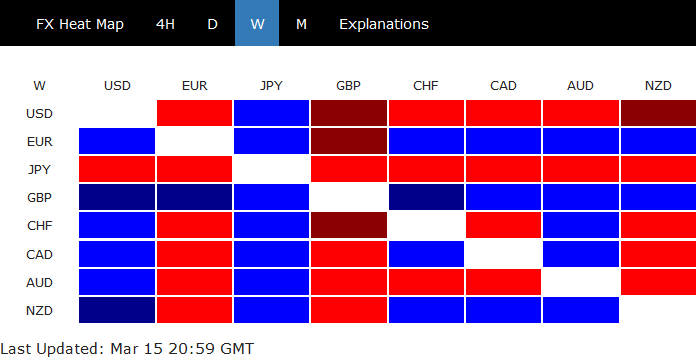
Sterling ended last week as the strongest one as no-deal Brexit is now politically ruled out. But it should be noted that the path forward remains unclear, as least for a few more days. Thus, the upside breakout of Sterling was indecisive. The Pound has indeed closed below recent highs against Dollar and Yen. On the other hand, Euro ended as the second strongest while Yen was the weakest, followed by Dollar. Overall, as the key issues in Brexit and US-China trade negotiations are unresolved, traders hesitated to commit to a firm direction.
Three central banks will meet this week, including Fed, SNB and BoE. All are expected to keep monetary policies unchanged. SNB and BoE are unlikely to provide any fresh inspirations to the market. Fed's new economic projections, however, will finally tell us, in terms of numbers rather than words, what made Fed change to a "patient" stance this year. RBA minutes will also be scrutinized. However, while more economists are now predicting two rate cuts this year, the central could refrain from giving any hints of rate cuts until May meeting.
No clarity on Brexit yet after a string of parliamentary votes
The UK House of Commons voted 391-242 on Tuesday to reject Prime Minister Theresa May's Brexit deal, for the second time. That came despite last minute concessions from the EU that provided a way for UK to exit the Irish backstop unilaterally on one very special occasion. On Wednesday, the Commons passed a non-binding motion to "reject" no-deal Brexit under all circumstances, by 321 to 278 votes. On Thursday, the Commons voted 413 to 202 to seek Brexit delay. If a Brexit deal is approved by March 20, 2019, the extension sought will be three months until June 30. If no deal was approved, the length of the extension will depend on its purpose.
A core issue regarding the extension on the EU side is the European Parliament election on May 23-26. An EU document presented to ambassadors of member states noted that Brexit can't be delayed beyond July 1 unless UK takes part in the election. It's now expected that May will bring her twice-defeated Brexit deal back to the Commons for another meaningful vote on Tuesday March 19, just ahead of EU Council meeting on March 21-22. May is now using a tactic that if her deal isn't approved, the UK would be trapped in the EU much longer than originally expected. But even so, it's still highly unlikely for her deal to get through. The Parliament will have the chance to take over Brexit control on March 25. Clarity on the way forward might be possible only after that.
Trump-Xi trade summit could be pushed further to June in Japan
Another week has passed without any concrete news regarding the so called "substantial progress" in US-China trade negotiations. Trump said there will be news in three to four weeks, "one way or the other". That's consistent with the message that there will be no Trump-Xi summit at the Mar-a-Lago this month. There were talks that the deal could be sealed and signed in April. But later in the week, it's reported that the meeting will be pushed further even to June, when both Presidents might meet in the G20 summit in Japan.
The prolonged negotiations could be a result of US Trade Representative Robert Lighthizer's detail-oriented approach. It could also be because the deliverables of the negotiations are now trade agreements rather than memorandums of understandings. But in any case, it's reported that Lighthizer is highly respected by the Chinese delegation for his professionalism and experience. And the Chinese government believed that working with Lighthizer is the right track to take.
Anyway, the US, Chinese and global economy will continue to endure the tariff "cannons" of the trade war for a while more. For now, no escalation is a positive. But there is no end in sight on the sufferings.
Fed to put words into numbers with new economic projections
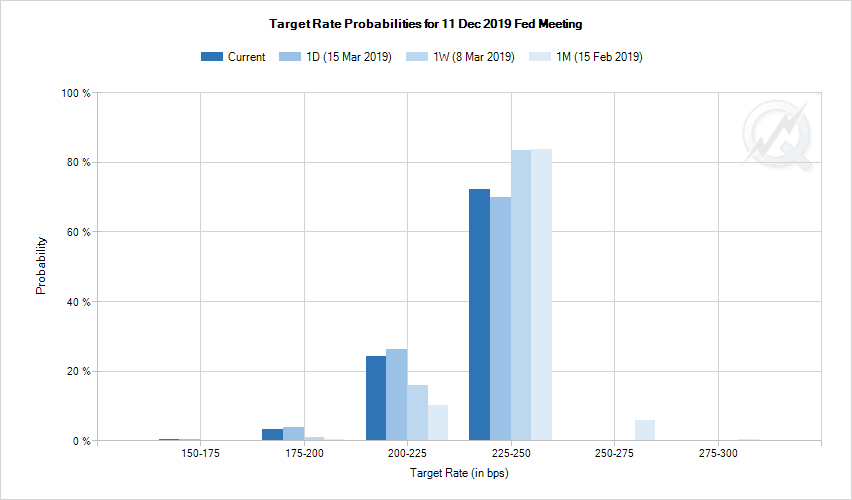
The upcoming FOMC meeting and announce might be the only event that finally provides some clarity to the markets. Back in December, Fed projected the median longer run federal funds rate at 2.8%, or central tendency at 2.50-3.0%. And, the median projection of federal funds rate was 2.9% by the end of 2019, with range at 2.6-3.1%. Fed also maintained tightening bias.
But suddenly, there was a U-turn since the end of last year and Fed now adopts "patient" approach. According Fed chair Jerome Powell, interest rate is now at the lower end of neutral. Such comments are echoed by most Fed officials in their speeches and comments. But, theoretically, federal funds rate at 2.25-2.50% is better described at "just below" neutral of 2.50-3.0%, as Powell said before the December meeting.
So, the new economic projections to be released this week will hopefully turn policymakers' words into numbers. That is, How patient are they expecting to be? And where is neutral rate now if federal funds are are at the lower end of neutral?
Currently, fed fund futures are pricing 0% chance of a rate hike within 2019.
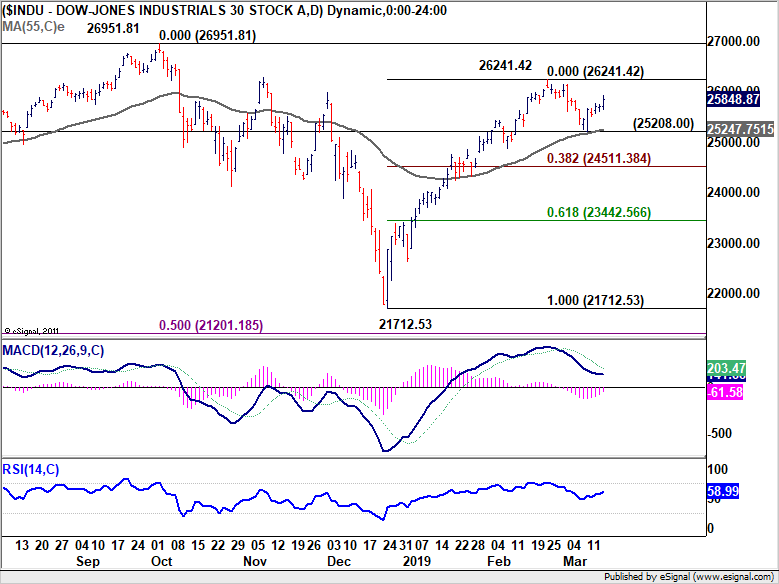
 DOW rebounded after testing 55 day EMA
DOW drew strong support from 55 day EMA and rebounded notably last week. Outlook is the index is unchanged. We're viewing the rebound from 21712.53 as a leg inside the medium to long term consolidation pattern from 26951.81. Hence, while further rise cannot be ruled out, such rise should top below 26951.81. On the downside, break of 25208.00 support should now confirm near term reversal and target 38.2% retracement of 21712.53 to 26241.21 at 24511.38 first.
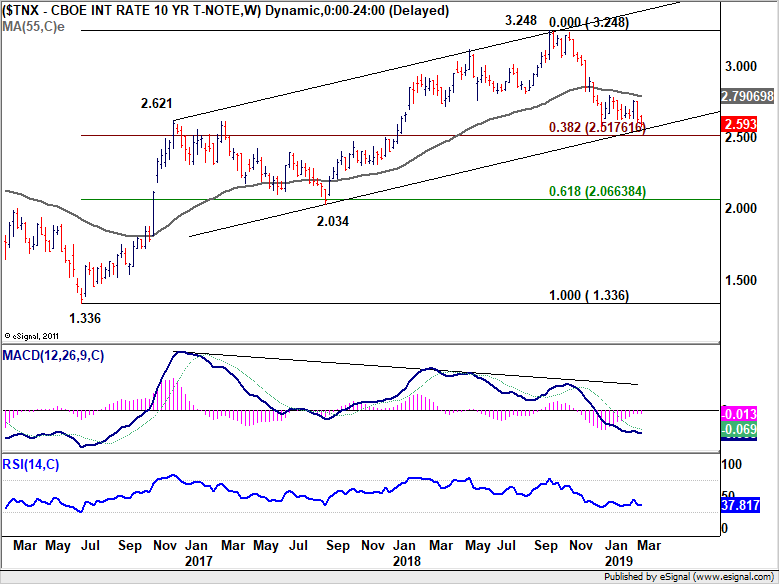
10-year yield still in critical support zone
10-year yield lost more ground last week to close at 2.593, below 2.6 handle. The current development suggests that a breach of December's low at 2.554 is likely in near term. But we'd maintain that TNX is now very close to long term channel support at 2.550. It's also close to 38.2% retracement of 1.336 to 3.248 at 2.517. So, we'd expect limited downside potential, and near term bullish reversal should be due. That is, while near term weakness in yield could drag down Dollar, the rebound should take dollar through key resistance levels. Nevertheless, it will be another story if 2.5 handle in TNX is firmly taken out, which confirms medium term bearish reversal.
Dollar index rejected by 97.87 fibonacci resistance again
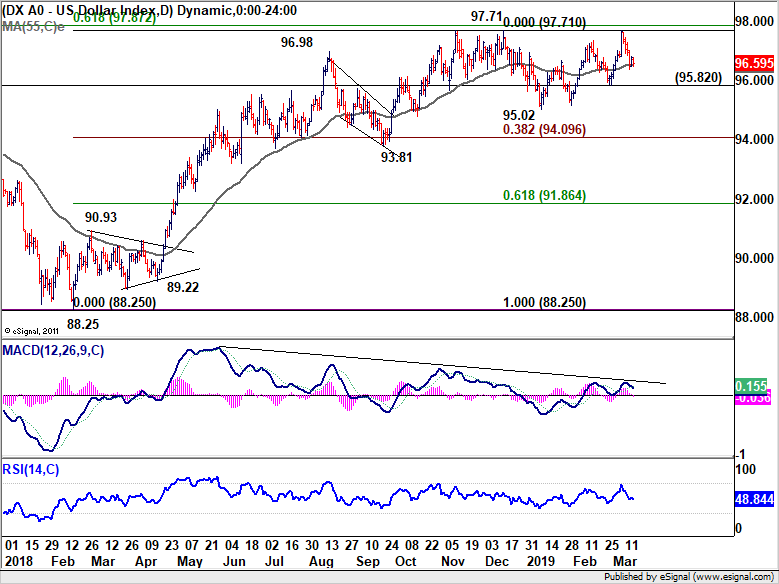
Dollar index's decline last week indicates that the index has once again failed 97.87 fibonacci resistance (61.8 retracement of 103.82 to 88.25). On the downside, break of 95.82 support will suggest that consolidation pattern from 97.71 has started a third leg towards 95.02 and below. But in that case, we'd expect strong support from 94.09 (38.2% retracement of 88.25 to 97.17) to contain downside. Meanwhile. decisive break of 97.71/87 resistance zone will confirm resumption of whole rise from 88.25.
Position trading
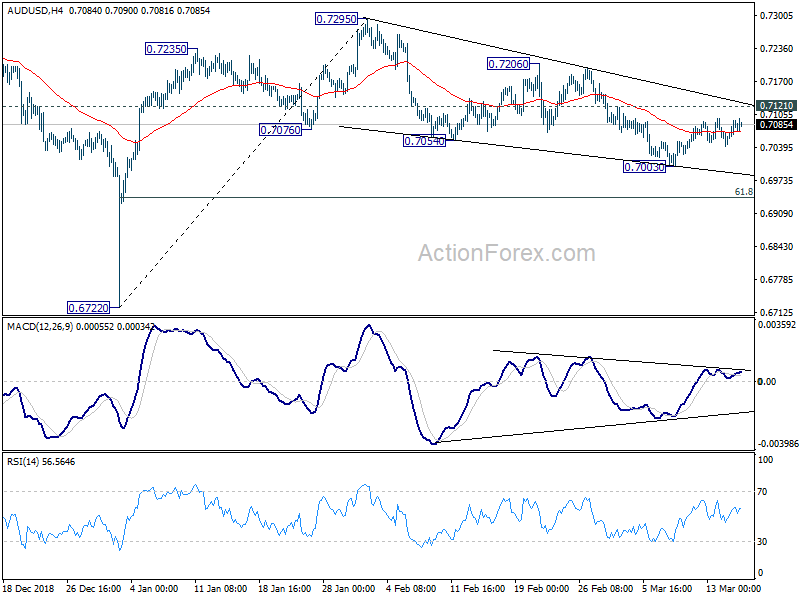
We'd holding on to AUD/USD short (sold at 0.7050). The corrective structure of recovery from 0.7003 maintains near term bearishness. We'd continue to expect AUD/USD pick up downside momentum again later. Fall from 0.7295 should extend through 61.8% retracement of 0.6722 to 0.7295 at 0.6941 to 0.6722 low as first target. But again, we're actually looking at long term down trend resumption to 0.6008 and below. So, we'll hold short in AUD/USD with stop unchanged at 0.7120.
EUR/GBP Weekly Outlook
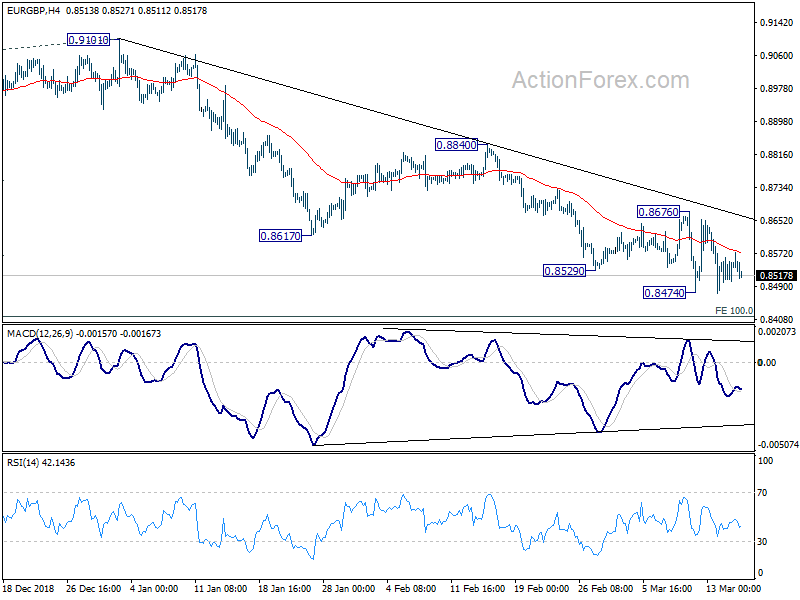
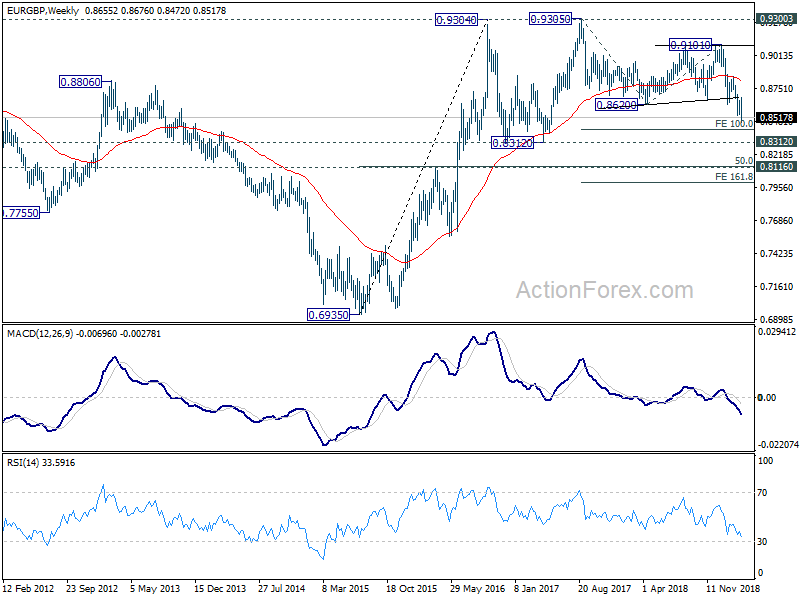
EUR/GBP dropped to 0.8474 last week but turned sideway since then. Initial bias is neutral this week for some more consolidation first. As long as 0.8676 resistance holds, further decline is expected. Firm break of 0.8474 will resume larger down trend to 0.8416 long term projection next. However, on the upside, decisive break of 0.8676 will indicate short term reversal and bring further rise to 0.8840 resistance.
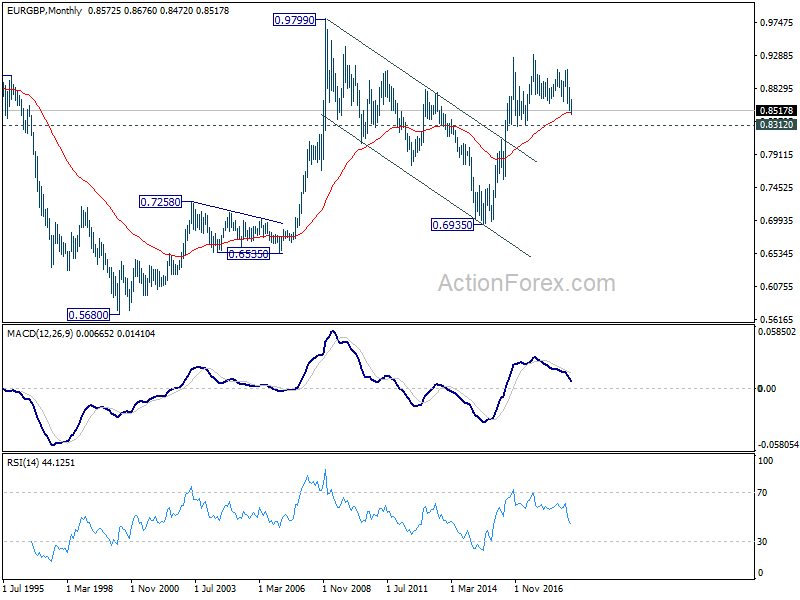
In the bigger picture, EUR/GBP is seen as staying in long term range pattern started at 0.9304 (2016 high). Current fall from 0.9305 (2017 high), is a falling leg inside the pattern. Such decline is now targeting 100% projection of 0.9305 to 0.8620 from 0.9101 at 0.8416 and possibly below. But for now, we'd expect strong support around 0.8312 support to contain downside and bring rebound.
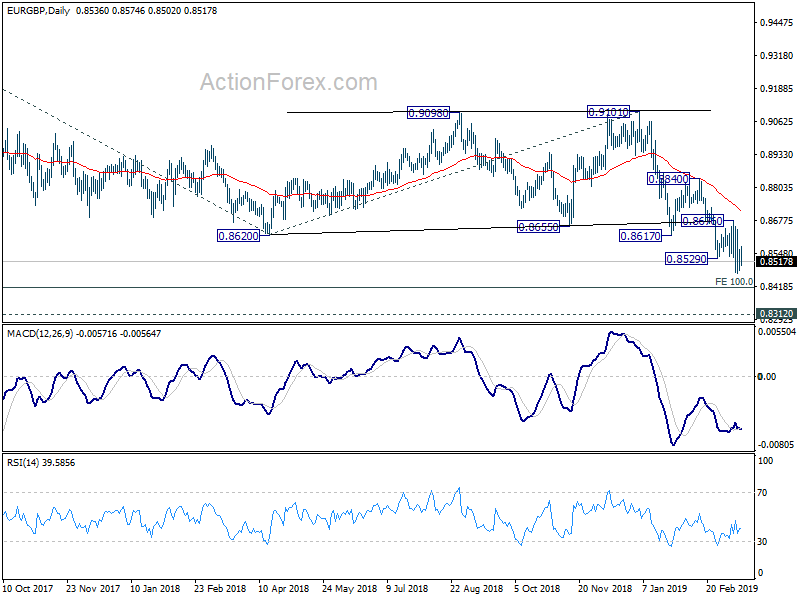
In the long term picture, we're holding on to the view that rise from 0.6935 (2015 low) is resuming the up trend from 0.5680 (2000 low). As long as 050% retracement of 0.6935 to 0.9304 at 0.8120 holds, further rise should be seen through 0.9305 to 0.9799 and above down the road.
Summary 3/18 – 3/22
Monday, Mar 18, 2019
[php_everywhere instance="1"]
Tuesday, Mar 19, 2019
[php_everywhere instance="2"]
Wednesday, Mar 20, 2019
[php_everywhere instance="3"]
Thursday, Mar 21, 2019
[php_everywhere instance="4"]
Friday, Mar 22, 2019
[php_everywhere instance="5"]
Weekly Economic and Financial Commentary: Economic Data Reinforce Fed Patience
U.S. Review
Economic Data Reinforce Fed Patience
- Several indicators released this week signaled a moderation in the pace of economic growth, and provided further reinforcement for patience from the Fed on further monetary policy tightening.
- Retail sales rebounded in January, but the gain wasn't enough to completely wash out the weak readings in December, suggesting a slow start to the year for consumer spending.
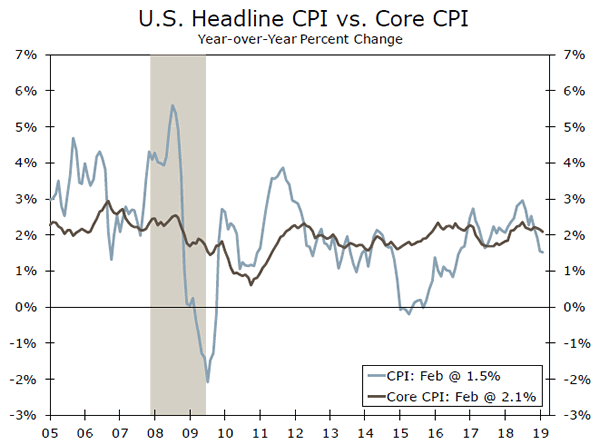
- Prices continue to increase only modestly, and with core inflation measures at or near the Fed's target of 2%, increased risk of a break-out to the upside remains limited.
Economic Data Reinforce Fed Patience
Several indicators released this week signaled a moderation in the pace of U.S. economic growth, and provided further reinforcement for patience from the Fed on further monetary policy tightening.
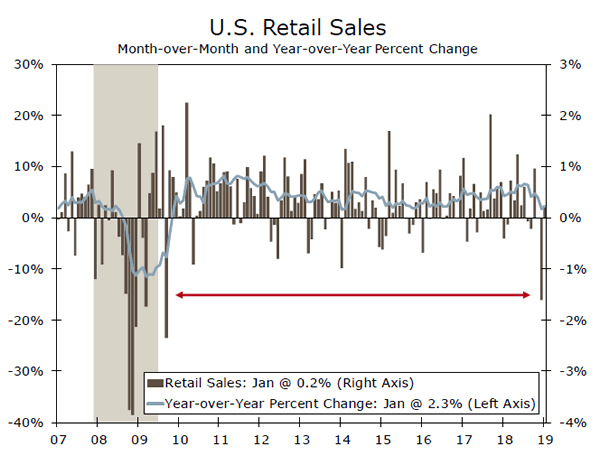
The week opened with the January retail sales report, which showed a bounce-back in consumer spending after what was the worst month for retailers since the Great Recession. Stripping away volatile components—food, autos, gas and building materials—the control group measure fared even worse in December, declining 2.3%, or the largest monthly decline since 2000. Given that this measure is a good proxy for the goods portion of personal consumption expenditures in the GDP report, the 1.1% rebound in January calmed fears of a prolonged retrenchment in spending.
That said, while we suspect the weak December was due to transitory factors, Q1 spending is dented. December, a key shopping period for consumers, was plagued by a market sell-off, which cramped consumer confidence and reduced household wealth. But, with financial markets having regained all of the ground they gave up in December, and confidence measures trending higher, spending doesn't appear to be falling off a cliff, but it will be weaker in the first quarter.
Prices data for February remained more or less in check. The Consumer Price Index edged up in February, but lower energy prices over the past year have held down the headline index on a year-over-year basis. With core inflation running at a 2.1% annualized pace over the past three months and on a year-overyear basis, the underlying price trend remains at the Fed's target, suggesting there is little need (from an inflation perspective) for it to move swiftly on further rate hikes. In last week's payroll report, we learned that average hourly earnings hit a new cycle high in February, but such heating labor costs have only modestly passed through to consumer inflation. Stronger productivity growth and historically high profit margins present some scope for companies to eat higher labor costs, and suggest inflation is unlikely to get out of hand anytime soon.
Producer prices also remain subdued, rising 0.1% in February, and 1.9% on a year-over-year basis. Through the volatility, core PPI inflation moderated to 2.3%, year-over-year. The recent trend here has remained consistent with that seen from consumer prices, and further affirms that a renewed gain in inflation remains minimal.
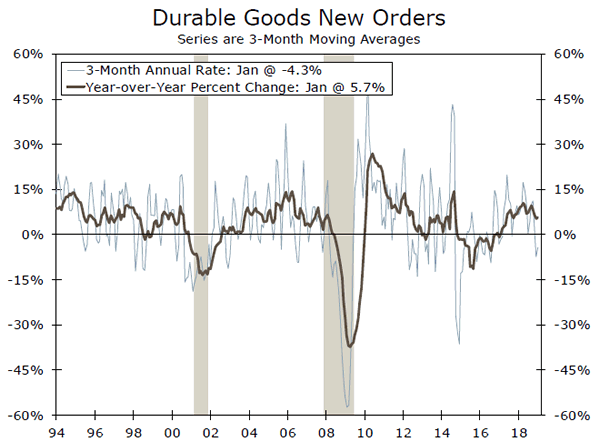
The hard data for durable goods were fairly positive, considering the volatile readings on new orders from the ISM manufacturing index in recent months. Core orders and core shipments both notched 0.8% gains over the month. The headline was pushed up by a large gain in aircraft orders—non defense and defense aircraft orders were up 13.1%. Despite volatility in the orders component, uncertainty remains on how durable goods could be impacted in coming months due to the grounding of the Boeing 737 MAX aircraft. Please see our short special report concerning this topic for more detail.
U.S. Outlook
FOMC Meeting • Wednesday
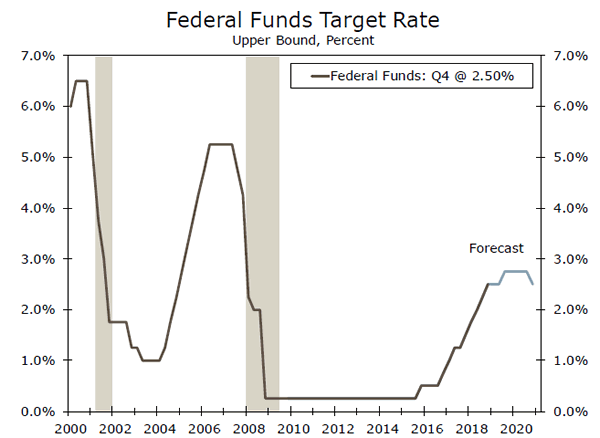
After increasing the fed funds rate each quarter in 2018, the FOMC declared in January that it will be "patient" with future adjustments. We see little reason for the FOMC to have altered its stance since then. Financial conditions have eased further, but a number of other "cross-currents" Chair Powell noted have not abated. Core inflation has eased up a touch and inflation expectations have edged down. The labor market remains tight, but initial jobless claims and payrolls suggest it is improving at a slower pace. Headwinds from overseas persist, with signs of global growth slowing further.
Next week's meeting will include updated economic projections. We anticipate estimates for GDP growth and inflation will be revised down a bit. The Fed's markedly more dovish stance in January also points to participants' projections for the fed funds rate being lowered from two hikes this year to one, and possibly even none. For potential changes to the balance sheet, see the Interest Rate Watch.
Previous: 2.25-2.50% Wells Fargo: 2.25-2.50% Consensus: 2.25-2.50%
Leading Economic Index • Thursday
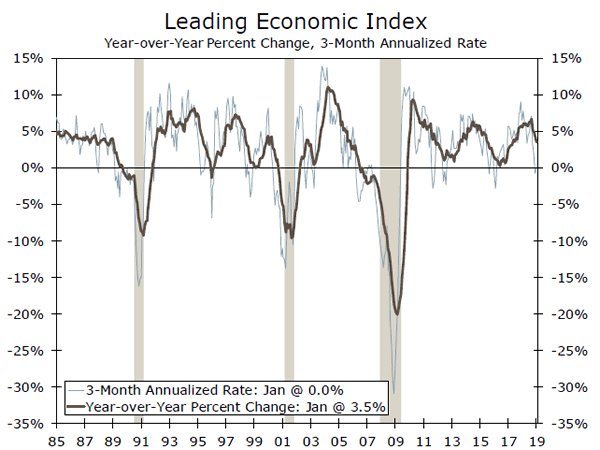
The Conference Board's Leading Economic Index highlights how the U.S. economy has lost some momentum in recent months. The index has virtually stalled since September, including an unchanged reading in January. We expect to see a modest increase in February, however. More building permits, higher equity prices, stronger capital goods orders and a rebound in consumer expectations should all add to the index. Partially offsetting those gains, however, look to be fewer hours worked in the manufacturing sector alongside a pullback in the ISM new orders index.
Even with a gain in February, the LEI points to slowing growth in the economy as fiscal stimulus wanes and monetary policy support is removed. The slowdown is consistent with the Fed taking its time in deciding its next move.
Previous: 0.0% Wells Fargo: 0.1% Consensus: 0.1%
Existing Home Sales • Friday
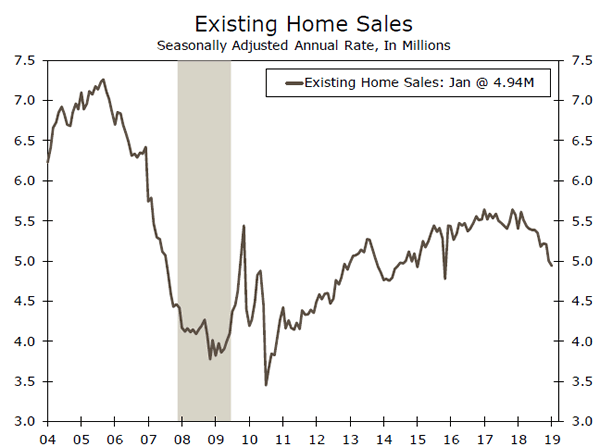
Existing home sales rolled over in 2018, but we expect to see the start of a modest rebound in February. Mortgage rates have come down about 50 bps since last November, helping buyers on the affordability front. Home price growth has also been moderating, while stronger wage growth has narrowed the gulf between costs and income. Already there are signs of demand picking back up. Pending home sales, which lead existing home sales by one to two months, jumped 4.6% in January, while mortgage purchase applications have risen since the fourth quarter.
Winter is a slow season for the housing market, which generates the possibility of seasonal factors exaggerating February's print. As a result, we do not expect this month's existing home sales to have much bearing on the Fed in isolation, but will offer another clue as to how much higher interest rates over the past two years have affected the housing market.
Previous: 4.90M Wells Fargo: 5.08M Consensus: 5.10M
Global Review
Still Slow Going for Global Growth
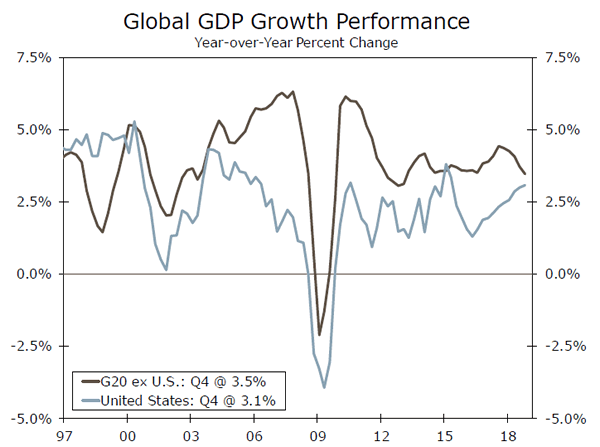
- This week's economic news remained consistent with the narrative of a slow-motion global expansion. Chinese activity data for early 2019 were mildly soft in tone, while Japan's activity data were also subdued overall. Q4-GDP figures for the G20 were released and showed that outside of the United States, international economic growth remains on a steadily slowing trend (see chart on right).
- U.K. GDP jumped in January, reversing its December fall, but it is unclear how long that growth pace will persist. The U.K. parliament voted this week to delay the Brexit date, extending uncertainty and likely pushing back Bank of England hikes.
U.K. Starts Strong in 2019, But Will it Continue?
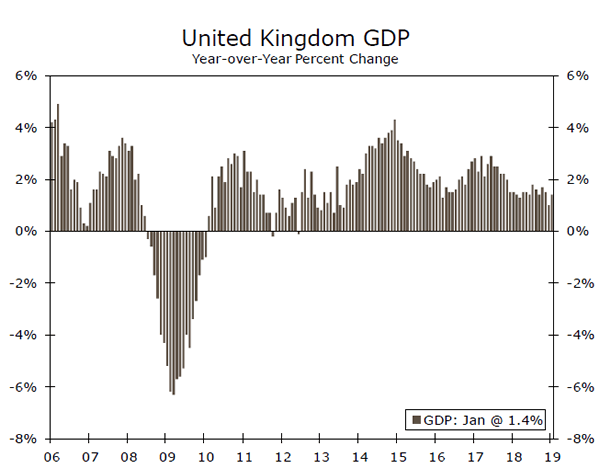
After a subdued finish to 2018, the U.K. economy started 2019 on a stronger footing. This week's January GDP figures showed the economy grew 0.5% month-over-month, more than reversing the 0.4% decline from December. The key services sector—which accounts for the majority of U.K. economic activity—rose 0.3%, while the monthly increase in GDP was also helped by a 0.6% gain in industrial output and a 2.8% gain in construction output. On an annual basis, GDP growth firmed to 1.4% year-over-year in January, from 1.0% in December.
However, we believe it is unlikely the U.K. economy will sustain this strong pace of growth through the early part of this year. In fact, just this week U.K. lawmakers voted to request an extension to the deadline for the U.K. to formally leave the European Union. It's not yet assured whether that extension will be approved by the other European Union countries, and, in any event, it simply prolongs the current uncertainty. As a result we have pushed back the timing of our Bank of England rate hike by one quarter, to Q3- 2019 and Q1-2020.
Bank of Japan Keeps Monetary Policy on Hold
The Bank of Japan once again held monetary policy steady this week, keeping its policy rate at -0.10% and maintaining a target for 10-year Japanese government bond yields of around 0%, with an unchanged tolerance band. In fact, with Japan's economic backdrop still relatively subdued we no longer expect the central bank will adjust monetary policy in a less accommodative direction in the second quarter, although we still expect the government to proceed with its consumption tax increase in October as scheduled.
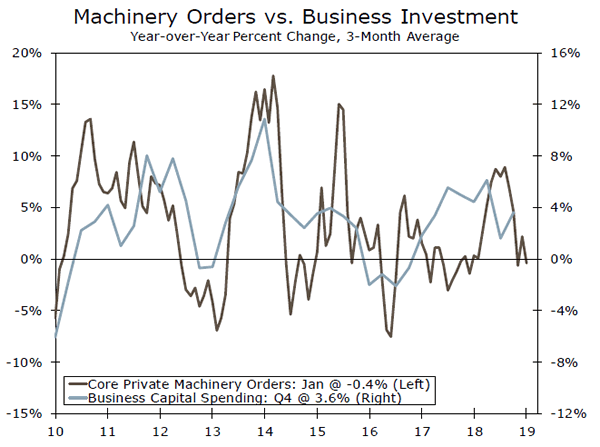
The mixed nature of Japan's activity data offers a good indication of why we believe the central bank will keep monetary policy on hold. Japan's core private machinery orders slumped 5.4% month-over-month in January, not exactly an encouraging sign for business capital spending (see middle chart). The tertiary industry index—a measure of service sector activity—did rise 0.4% in January, but that did not fully reverse the 0.5% decline from December. With CPI inflation still well short of the Bank of Japan's goal, we expect monetary policy to stay on hold for some time.
China: Hard Data, Hard Landing?
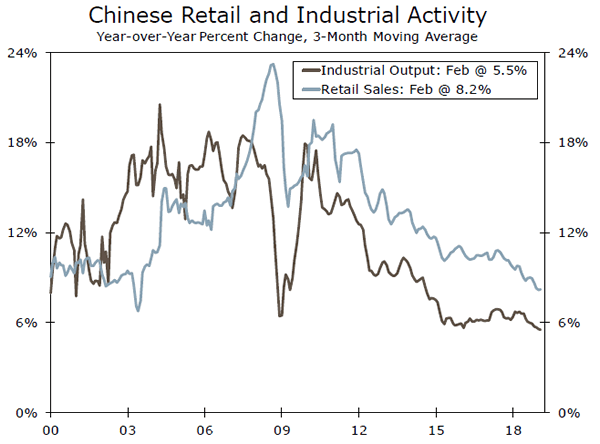
The first "hard" activity data for China relating to 2019 were released this week, and although they point to a continued slowdown they do not, in our view, point to a Chinese "hard landing". January-February retail sales rose 8.2% year-over-year, matching the consensus forecast and in line with the annual growth rate from December 2018. Industrial output for the first two months of the year rose 5.3%, not only a downside surprise, but also below the 5.7% year-over-year gain from December.
The relative stability in retail sales along with the gradual slowdown in industrial output suggests that China's economic slowdown should remain orderly, especially given continued monetary and fiscal policy support. For calendar 2019, we expect a modest slowdown in China's GDP growth to 6.2%.
Global Outlook
Bank of England Decision • Thursday
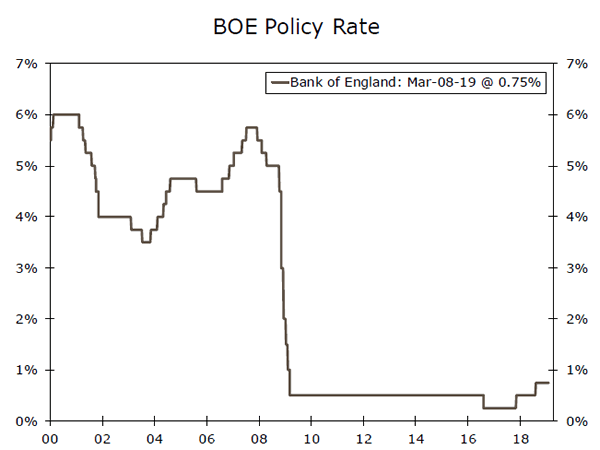
After a couple of 25 bps rate increases between late 2017 and mid-2018, the Bank of England has since been firmly on hold as it waits for uncertainty surrounding the U.K.'s exit from the European Union to dissipate. Following this week's political developments that uncertainty has not yet lifted, and is still not clear whether a Brexit deal will be reached and approved by the end-March deadline. Given the unsettled environment, we expect the Bank of England to once again hold its policy interest rate at 0.75% at this month's meeting.
Although U.K. Q4-GDP disappointed with growth of just 0.2% quarter-over-quarter (not annualized), some monthly economic indicators have been more resilient. Next week also sees January labor market data, with average weekly earnings expected to rise 3.2% year-over-year. February retail sales should fall 0.4% month-over-month after its January gain, while core CPI inflation should have remained close to target in February.
Previous: 0.75% Wells Fargo: 0.75% Consensus: 0.75%
Eurozone PMIs • Friday
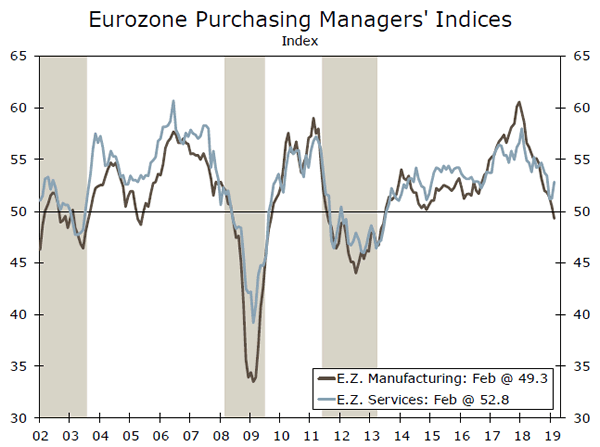
The persistent slowdown of the Eurozone economy has attracted the attention of investors and policymakers. The economy grew at just a 0.7% annualized pace in H2-2018, with manufacturing especially soft, and the service sector also subdued. Against that backdrop the European Central Bank made a dovish shift at its March announcement, saying interest rates would remain at low levels for longer and announcing a new round of targeted long term loans.
In this environment, the Eurozone PMI surveys are being particularly closely scrutinized for clues on the path of the economy. February was a mixed bag, with the manufacturing PMI falling further to 49.3, but the services PMI rose for the first time in five months to 52.8. The March figures could offer insight on whether that was temporary relief or a sustained improvement—the consensus expects the services PMI to ease to 52.7, while the manufacturing PMI is expected to rise to 49.5.
Previous: 49.3 (Manufacturing), 52.8 (Services) Consensus: 49.5 (Manufacturing), 52.7 (Services)
Canadian CPI • Friday
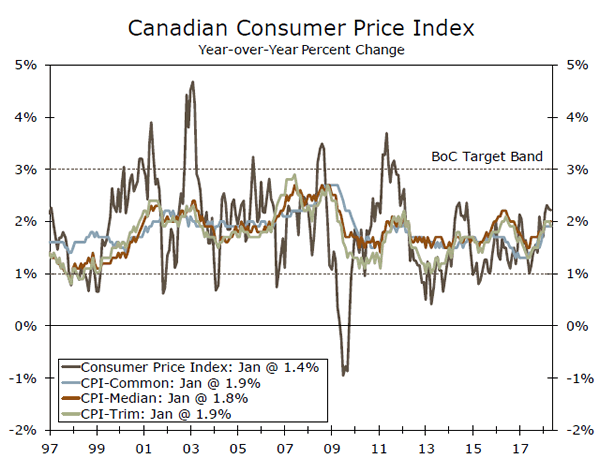
Canadian CPI inflation has been relatively benign in recent months, a trend that we believe will continue with the February reading. We expect headline inflation to firm slightly to 1.6% year-over-year, comfortably within the Bank of Canada's 1%-3% target range. Meanwhile, measures of core inflation are likely to remain just below 2%, where they have been for the past several months.
Although the Bank of Canada seems comfortable with recent inflation outcomes, economic growth developments have likely been more concerning. Q4-GDP rose just 0.4% (annualized) and, at its March announcement, the central bank said the slowdown was more broad-based than expected, and that a period of "below neutral" interest rates was warranted. Next week sees further activity data in the form of January retail sales, coming after sales showed a month-over-month fall in both November and December. We have pushed back our forecast of Bank of Canada hikes, with an initial increase now seen in the third quarter of this year.
Previous: 1.4% Wells Fargo: 1.6% Consensus: 1.4% (Year-over-Year)
Point of View
Interest Rate Watch
Fed Balance Sheet Comes into View
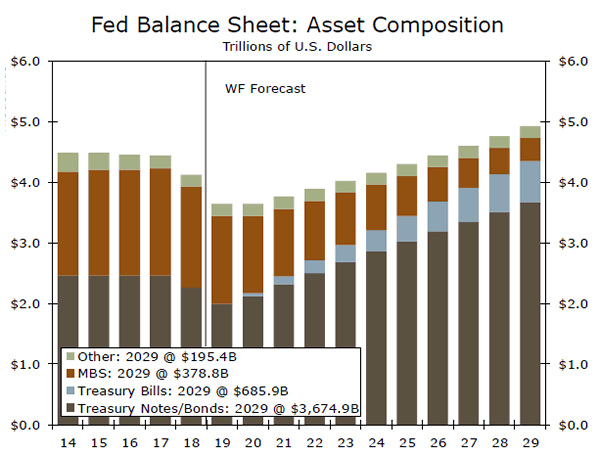
In addition to the updated economic and dot plot projections expected from the FOMC next Wednesday, policymakers may also provide some additional color on the outlook for the Fed's balance sheet.
Thus far, much of the focus has been on when and at what size the balance sheet unwind will conclude. Based on our analysis and reading of the tea leaves, we believe this has already been more or less established. While the exact timing is unclear, we believe the Fed will likely stop shrinking its balance sheet at some point later this year.
However, there are still several outstanding questions that need answers. First, after the unwind comes to an end, will the Fed immediately begin growing its balance sheet again? Over time, the Fed's balance sheet should grow in line with its major liabilities, namely currency in circulation and bank reserves. That said, some participants have suggested that the Fed could hold the size of the balance sheet steady for a period of time, allowing them to patiently monitor whether reserves have truly reached a level that is no larger than needed to implement monetary policy "efficiently and effectively".
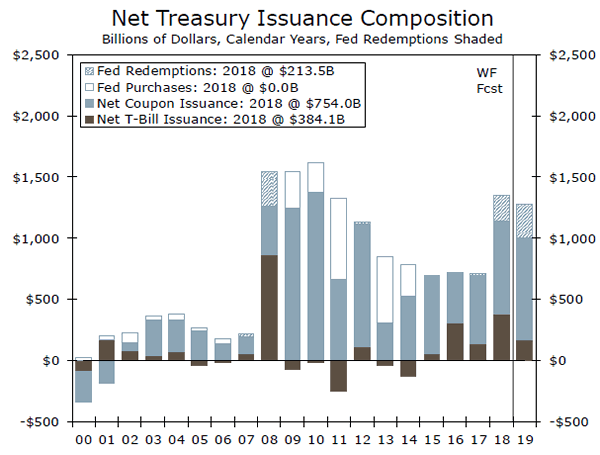
Second, the composition of the balance sheet going forward remains unclear. Will the Fed continue to allow mortgage-backed securities (MBS) to roll-off? And if so, at what pace? If MBS continue to roll-off, as we expect, the Fed will need to begin buying a healthy chunk of Treasury securities, both to replace MBS and to account for organic balance sheet growth. This then raises yet another question: where along the Treasury curve will the Fed buy? In our view, the most market-neutral approach would be to buy in proportion to how the Treasury is issuing on a net basis, which at the moment is roughly 30% T-bills and 70% notes and bonds.
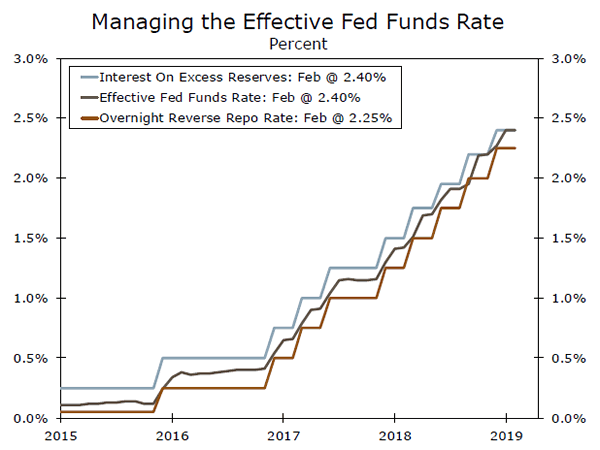
These questions are in addition to several other issues under consideration at the Fed, such as potentially introducing a standing repo facility or adopting a new main policy rate, such as the overnight bank funding rate (a close relative of the fed funds rate). While we doubt all of these issues will be addressed in full at next week's meeting, there will likely be plenty to digest.
Credit Market Insights
China Still Buying U.S. CRE
China remained a net buyer of U.S. commercial properties in 2018, despite a popular narrative of rapid divesture amidst an escalating bilateral trade dispute and broader restrictions on outbound Chinese capital. To be sure, Chinese sales of American properties shot up over 200% in 2018 to $8.1 billion, and purchases fell over 50%. Yet with purchases still totaling $11.2 billion, China remained a net investor. The United States remains the favored destination for Chinese investment, despite government efforts to regulate and divert the flow of funds elsewhere. The economic outperformance of the United States relative to the rest of the developed world—over the past couple of years as well the expectation for 2019—and ongoing strength in CRE fundamentals have kept demand for properties buoyant. Moreover, the relative stability of the United States amidst slowing growth in the Eurozone and Japan and a trade-exacerbated secular slowdown in China bolster the attractiveness of U.S. CRE as a store of value.
For now, China continues to buy U.S. properties. Fears of widespread disposals, potentially as one front of a trade war, have not been fully realized. Rapid Chinese selling of U.S. Treasuries causing yields to spike has also not occurred. A potential trade deal, still not quite in the offing, should loom over any potential cross-border investment decision for the foreseeable future.
Topic of the Week
Could the Fed Go Negative?
Our forecast for the U.S. economy does not currently include a recession any time in the near future, but when the next downturn comes around, Fed policymakers are likely to reassess their toolkit for stimulating economic activity. Could negative interest rate policy (NIRP) become part of that toolkit in the next downturn?
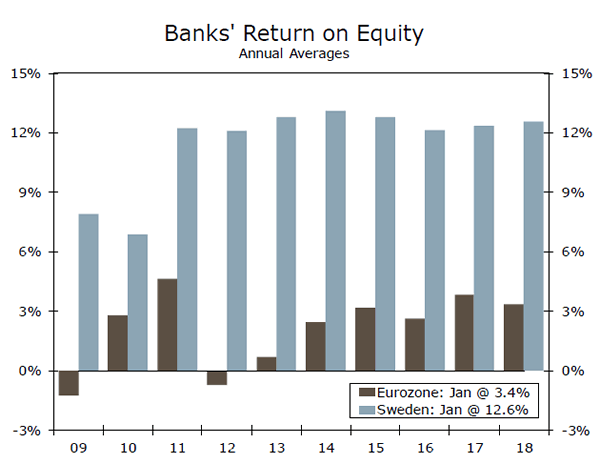
Central banks in other major developed countries have implemented NIRP in recent years, including the Eurozone (i.e., the ECB), Denmark, Japan, Sweden and Switzerland. In general, these countries have seemingly had mixed success with negative rates, but the purported downside effects have also not been all that significant.
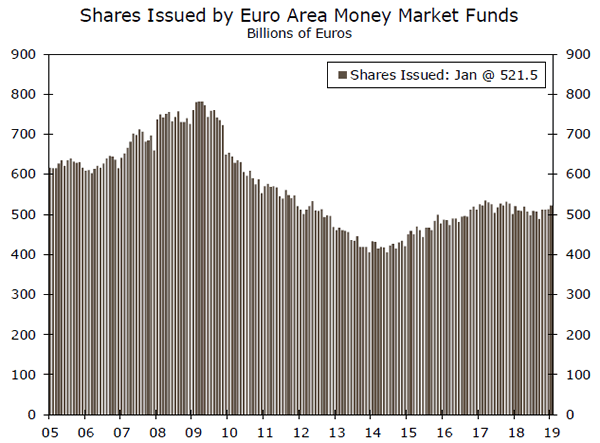
Let us start with the effects of NIRP on the banking sector. In theory, negative interest rates could be passed on to consumers and lead to large-scale deposit flight, but, in practice, deposits have been stable in countries employing NIRP. Meanwhile, bank profitability and lending activity do not seem to have been meaningfully hampered by the implementation of negative rates in other countries. Money market mutual funds (MMMFs) have also seemingly not been significantly harmed or disrupted, despite concerns over the theoretical impact of negative rates on fund inflows. Finally, NIRP has in general not seemingly led to bubble-like behavior in financial markets, and in areas where asset prices have become frothier amid negative interest rates, authorities have responded with policies to discourage speculative activity and contain price appreciation.
In short, NIRP does not seem to have the degree of negative impact on the economy that theory suggests. Yet, the efficacy of negative rates in other countries is far from clear, as economies in the Eurozone, Japan and Switzerland that have implemented negative rates continue to struggle with lackluster rates of economic growth and lingering deflationary concerns. Thus, the Fed may be hesitant to implement NIRP unless the next downturn is particularly severe, and, moreover, policymakers may employ other policies (such as QE) in conjunction with NIRP to jumpstart the economy.
The Weekly Bottom Line: Sitting at Neutral, Slogging Towards Normal
U.S. Highlights
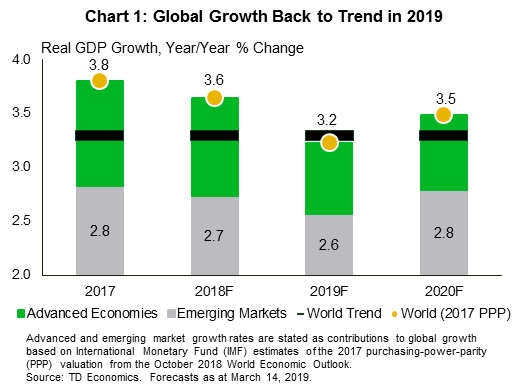
- Our updated economic forecast anticipates a slowdown in global growth to 3.2% in 2019, roughly at trend.
- A weak handoff from 2018 and start to 2019 motivates much of the downgrades in advanced economies, while growth in emerging markets is anticipated to perk up slightly later in the year.
- Growth in the U.S. is expected to slow, but still remain at an above-trend pace this year. That said, lingering economic uncertainty could weigh further on the domestic and global outlook.
Canadian Highlights
- Canadian data this week was somewhat discouraging. Households ended 2018 by setting a new record for relative indebtedness. Meanwhile, February home resale data showed a 9.1% drop in sales activity, but January manufacturing sales rebounded, up 1.4% in volume terms.
- Recent softness provides a weak starting point for our latest Quarterly Economic Forecast. We've downgraded our economic growth forecast for this year to 1.2%, with a modest acceleration to 1.8% in 2020.
- Contained inflation and a forecast of just a trend pace of growth suggest that the Bank of Canada has already brought its monetary policy interest rate to a neutral stance. We expect no further rate hikes.
U.S. - Ahead of the (Slowing) Pack
In a year marked by high expectations for deals, 2019 is shaping up to be a rough year for the global economy, and advanced economies in particular. Our new quarterly economic forecast expects global growth to slow to 3.2% in 2019 from 3.6% last year (Chart 1). That's down about 0.2 ppts from our December outlook.
This outlook is consistent with global demand growing roughly at the same pace as capacity, and, correspondingly, subdued inflation pressures. However, the headline print itself masks the disparate regional challenges. For example, a soft end to 2018 and a disappointing start to 2019 results in a much weaker growth outlook for G7 economies this year. Add a global manufacturing slump, and you have the impetus for a relatively weak economic expansion relative to past years. Downgrades like this justify the pivot to patience by G7 central banks. Interest rate hikes are effectively cancelled through the end of 2019.
In contrast, economic activity in the developing world is expected to heat up later this year. An anticipated improvement in global manufacturing activity, weaker inflation and lower global interest rates all support a firmer outlook in emerging market economies. That said, a slowing Chinese economy and elevated trade policy uncertainty vis à vis the U.S. could weigh further on major trading partners, stifling any sort of rebound in global economic activity.
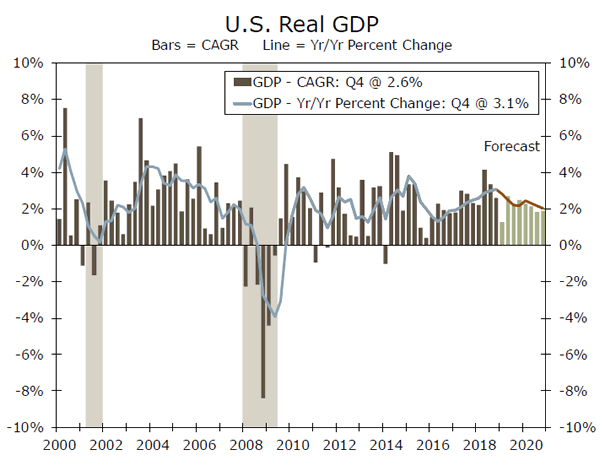
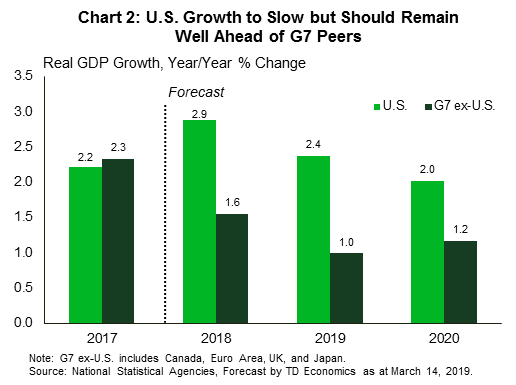
The U.S. economy is expected to prove more resilient than its G7 peers (Chart 2). Although it too will see growth slow in 2019, the decline is largely due to the waning impulse from fiscal stimulus. Growth for 2019 is still expected to average an above-trend pace of 2.4%, half a point shy of last year's strong performance. The government shutdown and continued phenomenon of residual seasonality weigh heavily on the first quarter, bringing down the annual average. However, both consumer and business spending fail to rebound to the heady quarterly growth rates observed in 2018 through the remainder of this year.
Spending on consumer durables, such as automobiles, is expected to decelerate. Moreover, although a rebound in housing activity is expected later this year, very weak momentum acts to ensure that residential investment contracts for a second consecutive year. Net trade is also expected to weigh on growth again this year, with import demand outpacing exports.
The data this week acted to support this outlook. January retails sales staged a solid rebound from December lows. Combined with solid wage gains in February's employment report, this sets the table for an uptick in economic activity later this quarter. That said, geopolitical events this week proved less constructive. Trade talks between Presidents Trump and Xi have been punted to at least April, and Brexit will likely be delayed at least through June. This suggests that elevated political and trade policy uncertainty will continue to weigh on global economic activity for at least a couple more months.
Canada - Sitting at Neutral, Slogging Towards Normal
The economic data this week painted a generally downbeat picture. The one exception was manufacturing sales, which rose 1.4% in volume terms in January (see commentary), a strong report that was still not enough to offset the weakness seen in late 2018. Beneath the strong headline, forward looking components (new and unfilled orders) were soft.
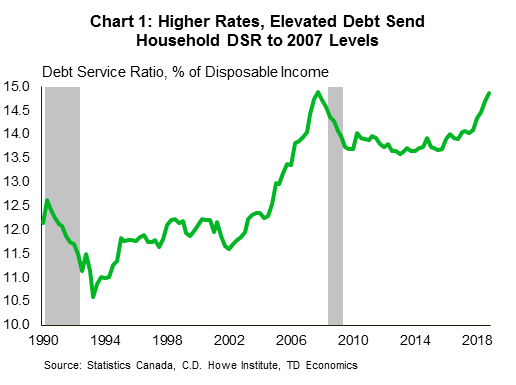
Striking a less positive note was Statistics Canada's snapshot of Canadian finances at the close of 2018, showing that the stresses on households continue to mount (see our commentary). Past interest rate increases are continuing to manifest. The debt service ratio rose to 14.9%, just shy of its prior peak in 2007 (Chart 1). Household borrowing ran ahead of incomes again in 2018Q4, sending the debt-to-income ratio to 178.5%. The asset side of the equation was similarly discouraging. Household wealth fell 2.8% quarter-on-quarter. The value of natural resources dropped due to soft oil prices, while late-2018 market volatility took down the value of financial assets. The good news is that recent developments in these categories have been positive. Oil prices are up markedly from their late-2018 doldrums, and the S&P/TSX index has had a roaring start to the year, up more than 12% year-to-date.
The other major driver of falling household wealth was real estate, and here the story is one of ongoing weakness. Canadian real estate markets are struggling to gain traction, with February's resale report disappointing expectations. Sales fell 9.1% month-on-month, and both the average sale price and the quality-adjusted home price index were down. Some of this may be due to bad weather, but it still paints a less than encouraging picture to start the year.
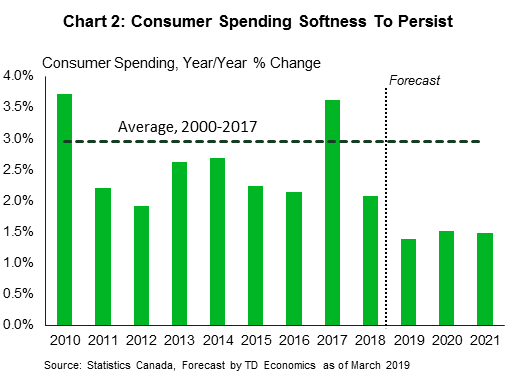
These trends, and their knock-on effects on economic growth, are likely to continue and remain a key driver of TD Economics' outlook. In our just-released Quarterly Economic Forecast, we see only a modest pace of consumer spending (Chart 2). The reasons are just what the recent data has shown: servicing debt is eating up a sizeable share of household incomes, weighing on consumer spending, notably in housing-related and durable goods.
The biggest change in our latest forecast is our Bank of Canada outlook, which sees no further interest rate increases. The rhetoric from Governor Poloz and company has shifted to reflect the reality of the recent soft patch, but still communicates a desire to move rates higher with time. This is not feasible over the foreseeable future. The key is the consumer: slower spending growth will constrain the pace of overall economic activity. This means little in the way of inflationary pressures and little reason to tighten monetary policy. Our forecast of growth at trend, near-target inflation and a low unemployment rate suggests the policy rate may already be at 'neutral'. Thus, no further hikes are needed absent a significant upside surprise on growth. Given the economic headwinds at present, we aren't holding our breath.
U.S.: Upcoming Key Economic Releases
U.S. FOMC Rate Decision
Date: March 20, 2019
Previous: 2.50%
TD Forecast: 2.50%
Consensus: 2.50%
The March dot plot should suggest one more hike (to neutral) this year, and potentially no additional hikes in 2020 based on recent comments from several Fed officials. We also expect the median dots for 2020 and 2021 to no longer suggest hiking beyond a neutral range. We see this not as a consequence of a shift in the reaction function, but of the lower projected path for core inflation. More clarity about when runoff ends, and the size of the balance sheet at that time, should be forthcoming, if not in a separate statement then as part of Powell's press conference. Look for a neutral market reaction, as outright rate cuts are priced for 2019.
Canada: Upcoming Key Economic Releases
Canadian CPI - February*
Release Date: March 22, 2019
Previous: 0.2% m/m, 1.4% y/y, Index: 133.6
TD Forecast: 0.7% m/m, 1.5% y/y, Index: 134.5
Consensus: N/A
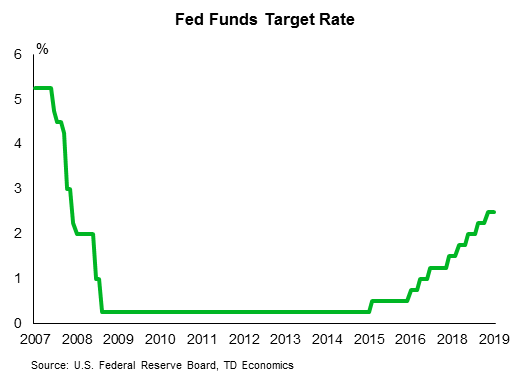
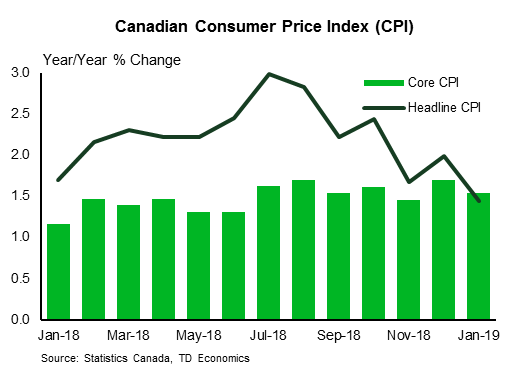
We expect inflation to firm to 1.5% in February, reflecting a 0.7% increase in prices on the month. Gasoline prices lend a strong m/m boost, with solid gains in food prices as well. Elsewhere we expect most of the m/m gains to result from travel services and MIC. Airfares, the other source of oneoffs, look benign this month taking in account February seasonals and the near full correction last month. The previous jump in the rent index (+0.9% m/m) is unlikely to be repeated and is one source of downside risk. It is likely to be volatile going forward thanks to the methodology changes. Finally, core inflation is likely to be stable at 1.9% on average but risks remain skewed to the downside on the back of poor growth dynamics and weak wage growth. Looking ahead, the recent pickup in fuel prices along with the new CPI basket weights suggest a slightly higher trajectory for our forecast at 1.6% in Q1 vs 1.5%, though still below the BoC's forecast of 1.7%.
Canadian Retail Sales - January*
Release Date: March 22, 2019
Previous: -0.1%, ex-auto: -0.5%
TD Forecast: 0.4%, ex-auto: 0.2%
Consensus: N/A
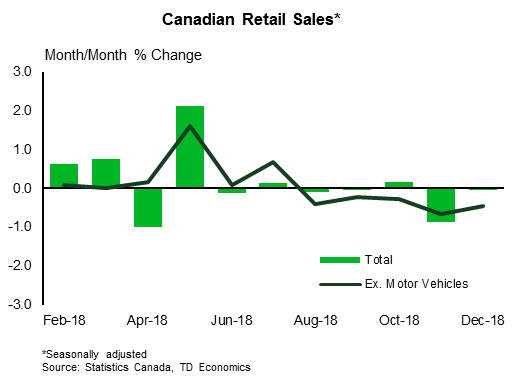
Stronger motor vehicle sales will help to drive a 0.4% rebound in January retail sales after broad weakness weighed on the sector into year-end. Motor vehicle sales will benefit from warm weather across most of the country alongside a pickup in consumer confidence; this should leave ex-auto sales to post a more modest 0.2% increase. Looking past motor vehicles the picture is mixed; robust labour market gains should help support consumer spending, but one month of positive home sales is unlikely to drive a rebound in demand for home furnishings given the broader trend, and a recent slowdown in residential construction will weigh on building material sales. Lower gasoline prices also present a headwind to nominal sales, although the positive impact on real incomes provides a silver lining from the cumulative 25% decline since October. Overall we expect real retail sales to come in at or slightly above the nominal print owing to a decline in seasonally adjusted goods prices during the month.
Dollar Falls as Soft Data and Trade Hope and Brexit Guide Markets
The US dollar is lower against most major pairs on Friday. The greenback was higher on Thursday as investors sought refuge after the Brexit drama and the apparent delay in the US-China negotiation. President Trump later said that news is upcoming in the next 3-4 weeks, once again boosting optimism that the two largest economies will reach a deal. News of a delay have now been digested, but the praise from Trump on the negotiations brought back risk appetite to investors who sold the US dollar.
The wires were also full of hope on an extension being granted by the EU on the Brexit deadline. There are still a lot of work to do to move parliament from its current fragmented form into a consensus that approves a workable deal.
Brexit Drama to Continue as BOE Shares the Stage
The GBP/USD rose 2.09 percent in the last five trading days. The pound is higher against the greenback after the UK parliament voted to seek an extension of the Article 50 deadline. There was plenty of volatility during the week as the UK parliament voted on British Prime Minister Theresa May’s proposal, a no-deal exit and other amendments which included the extension. May was once again defeated, but lawmakers voted for a no-deal divorce boosting the pound. Near the end of the week the extension vote was victorious but with the caveat that it needs to be ratified by all 27 EU members.
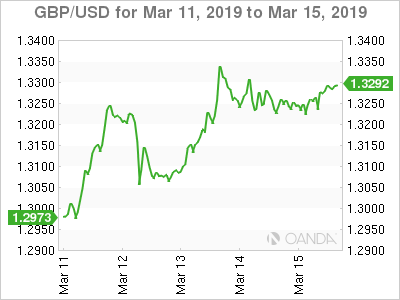
Theresa May will try once again to get her proposal to pass on the same week the Bank of England (BoE) is scheduled to warn investors about the dangers of a no-deal exit, that although has been voted in parliament is dependent on an agreement being made to fully rule out the possibility of that scenario becoming a reality. A defeat on her third attempt could mean the UK would need a longer extension and even a second referendum is back on the table at that point. British economic indicators to watch out for during the week include the jobs report, inflation and retail sales.
GOLD
Gold rose 0.51 percent on Friday. The yellow metal climbed above the $1,300 price level but remains in a consolidation pattern. The softness of the dollar after disappointing economic indicators and lack of demand for the greenback as a safe haven appreciated the value of gold.
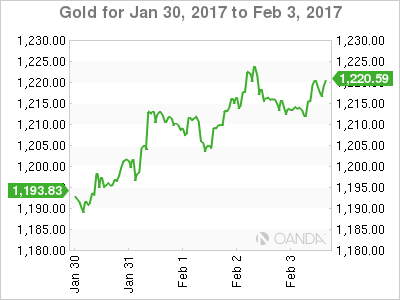
Gold will remain on the mind of investors ahead of a busy week. The U.S. Federal Reserve and the Bank of England (BoE) will hold court, along with a plethora of economic indicator releases and to top it off the UK parliament could hold a Brexit vote on March 19.
OIL
Oil fell on Friday after hitting a 2019 high. The fragile balance between the OPEC+ crude output limit and the rising production in the US is easily disrupted. Higher oil production and question marks about global demand won out at the end of the week with crude prices retreating.
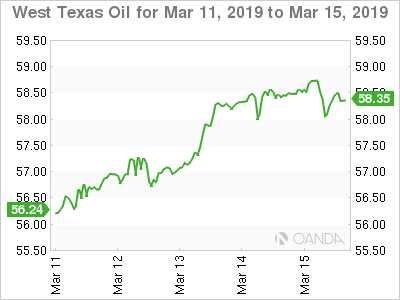
The ongoing OPEC+ agreement could be extended which is why prices could be higher in the second quarter to the year as the production cap soaks up excess capacity, even with a big push from US producers.
Sanctions against Iranian and Venezuelan crude exports could accelerate the upward trajectory given that global demand for energy appears steady at current prices. OPEC compliance has been high, but it remains to be seen if all members in particular the leaders Saudi Arabia and Russia are willing to keep limiting their revenue beyond April.
STOCKS
Global stocks rose on Friday after news that China is ready to keep adding stimulus to its economy looking to regain its growth momentum. The words from President Trump praising the Chinese in their negotiation with hopes that an announcement will be made on the US-China trade deal in three weeks. The announcement of Friday of a new foreign investment law was seen as a sign of goodwill from the Chinese.
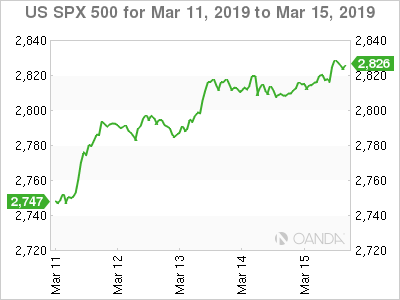
Tech was a big driver with Broadcom leading the charge as semiconductor stocks were in demand. Boeing shares rebounded after the global grounding of the 737 Max jetliners has impacted the stock.
Australia & New Zealand Weekly: Case for RBA Rate Cuts Continues to Build
Week beginning 18 March 2019
- Case for RBA rate cuts continues to build.
- RBA: Assistant Governor Financial Markets Kent speaks.
- Australia: AusChamber-Westpac survey, Westpac-MI Leading Index, employment.
- NZ: GDP, consumer confidence, current account.
- UK: Meaningful Vote, BOE policy meeting.
- Europe: EU Summit, consumer confidence.
- US: FOMC policy meeting.
- Flash PMI's for Japan, the Euro Area and the US.
- Key economic & financial forecasts.
Information contained in this report current as at 15 March 2019.
Case for RBA Rate Cuts Continues to Build
Westpac's forecast for RBA rate cuts in 2019, set down on February 21, has gained significant support over the last week. Updates on business and consumer confidence show the growth slowdown over the second half of last year is carrying into 2019 and starting to affect decision making. The case for cuts may build further with the release of next week's labour market data.
Markets are now giving about a 50% chance of an RBA cut by June, up from a 40% chance immediately following the December quarter GDP release. We continue to favour moves coming later in the year – August and November the likeliest timing – with the Bank still seeming reluctant to cut and likely to require more evidence around the 'consumer-housing nexus' and the labour market outlook before taking action.
The NAB business survey indicates that both business conditions and business confidence weakened in February – with both at below average levels. The business conditions index fell by 3pts to +4, down sharply from the average +18 read over the first half of 2018. Business confidence also fell by 2pts to +2.
We see the soft business update as a significant development. The February read is less affected by holiday season volatility, and is a clearer confirmation that the sharp loss of economic momentum since mid-2018 has extended into 2019. That is consistent with Westpac's view of GDP growth running at a below trend 2.2% pace in 2019.
The detail shows particularly weak conditions for retail, the December–February period marking the weakest three month run since 2013, and construction which saw conditions dip into contractionary territory. The state breakdown continues to show a sharp loss of momentum in NSW and Victoria. All of this is consistent with increasing negative spillovers from the Sydney and Melbourne housing corrections.
Importantly, the shift is clearly starting to affect businesses willingness to hire and invest. While the employment component of the survey moved sideways in the February month, at +5 it continues to show a clear easing from the +11 averaged over the first nine months of 2018. Meanwhile, the March survey points to downside risks around investment, with capacity utilisation falling to below average levels and capital expenditure plans down to a three year low.
Consumer confidence is also starting to falter. The Westpac- Melbourne Institute Consumer Sentiment Index fell 4.8% to 98.8 in March from 103.8 in February. The move takes the index back below 100, indicating pessimists again outnumber optimists, in contrast to the 'cautiously optimistic' reads that prevailed throughout 2018.
At 98.8, the index is still only 'cautiously pessimistic' and comfortably above the average level recorded in 2017. However, the March fall looks likely to be sustained with the survey detail indicating the poorer run of economic news is starting to weigh more heavily. Indeed, responses collected after the March 6 GDP release were much weaker, consistent with an Index level of 92.7. We suspect that the national accounts release clarified what were previously somewhat mixed signals about the extent of Australia's growth slowdown. As such this aspect of the March weakening in consumer sentiment looks likely to be sustained.
Other aspects of the March consumer sentiment survey also suggest the shift is starting to have a bearing on decisions.
Job loss concerns rose sharply in the month, the Westpac- Melbourne Institute Unemployment Expectations Index recorded an 8.9% jump, indicating more consumers expect unemployment to rise in the year ahead.
Responses to additional questions on the 'wisest place for savings' also show risk aversion rising to extremely elevated levels. Two thirds of consumers favouring safe options – bank deposits, superannuation or paying down debt – and just 17% nominating risky options such as real estate and shares. The mix is more risk averse than at the height of the global financial crisis.
Both job loss concerns and rising risk aversion raise the risk of a further move by households to rein in spending and increase savings, all of which would be consistent with Westpac's expectation of a significant 'wealth effect' drag on demand.
The labour market is the main focus domestically over the coming week with the February labour force survey to be released on March 21. Leading indicators have softened in recent months and we are expecting next week's update to be softer with employment dipping 5k and the unemployment rate nudging up to 5.1%.
However, this is within the range of monthly volatility for the labour force survey. A clearer moderating trend is only likely to emerge through March–April–May, as the slower growth pulse combines with businesses putting hiring on hold around the Federal election (a feature of the two previous elections in 2016 and 2013).
The Reserve Bank Board next meets on April 2. While Westpac expects the RBA to cut the cash rate by 50bps by the end of 2019, we do not expect the Bank to move rates at its April meeting. The weak December quarter national accounts will undoubtedly prompt a further downward revision to the RBA's growth forecasts to be released in the next Statement on Monetary Policy on May 10. However, this is unlikely to shift its views on the labour market – an area of strength that the Bank has highlighted as key to its policy considerations – by enough to warrant a policy easing.
The Federal Budget, due on the same day as the April RBA Board meeting, adds another layer of uncertainty. With the government's budget position improving, boosted in part by recent gains in commodity prices, and an election looming in May, there is certain to be significant stimulus measures tabled. That said, whether these will be sufficient or credible enough to turn the dial on confidence and the wider economy in a timely manner is unclear. Fiscal policy still looks to be constrained by the perceived need of both political parties to predict a surplus in 2019/20.
The case for monetary policy easing is clearly continuing to build, very much in line with Westpac's view. However, we still see the situation favouring a first 25bp rate cut from the RBA coming in August, once the extent of spillovers from the housing downturn, on the labour market in particular, become more apparent, with a follow-up 25bp cut in November.
The week that was
Beginning first with our Westpac-MI Consumer Sentiment Survey, March saw a material deterioration in household views on the economy, headline sentiment falling 4.8% to 98.8 – its lowest level since September 2017, and below the '100' optimist/ pessimist divide. The disappointing Q4 GDP report clearly affected households' confidence in the economy, with responses received after its release 8% lower. It is not surprising then that both the 1-year and 5-year views on the economy fell sharply, respectively 6.9% and 5.5%. With respect to the labour market, consumers have also become more circumspect, an 8.9% jump in unemployment expectations in March taking the sub-index to a 18-month high. It is best to regard this shift as signalling an expected deceleration in employment growth rather than a sharp drop, with unemployment expectations now near their long-run average.
The impact of these developments on family finances is significant. Both relative to a year ago, and for the year ahead, views on family finances are more than 5% below long-run average levels. 'Time to buy a major household item' is similarly 7% below its average. These results point to risks around the consumer remaining tilted to the downside, as headwinds from weak wages growth and declining house prices are further amplified by deteriorating employment prospects. On the housing market, affordability is improving as price declines continue, particularly in Sydney and Melbourne. However, consumers continue to expect further price declines. The survey's house price expectations index has fallen to a new record low back to 2009. Unsurprisingly, NSW and Victoria are the worst affected, with circa 50% of consumers believing prices will be lower in 12 months' time.
Also raising concern over our economy this week was the latest update from the NAB Business Survey. At +4 in February, business conditions are below average and down sharply from the level of H1 2018, when the index averaged +18. Business confidence is also below average at +2. In line with the rise in consumer unemployment expectations back to long-run average levels, businesses' willingness to hire has also ebbed to a level consistent with a stable unemployment rate. As the labour market typically lags activity, we foresee further weakness in this measure in coming months. On investment, the capital expenditure index is approaching the lowest level back to 2014/15, and capacity utilisation is now below average.
The above developments further support our view that the Australian economy needs easier policy. The full rationale for our call for two 25bp cuts in the cash rate in 2019 can be found in our March Market Outlook on pages 6 and 8. This release also provides commentary on the outlook for the Australian dollar and developments in global FX markets.
Looking offshore, for the UK, the past week has been high on drama, with three Brexit votes in Parliament. First, Prime Minister May's deal was voted down for a second time. Then a 'no deal' Brexit was precluded by the second vote. And finally via the third vote, scope for an extension of the Article 50 negotiation period was approved. While the second and third votes are positive steps, they do not narrow the divide between the various political factions. Indeed, the potential length of the extension is particularly divisive. If PM May's agreement is successful, Parliament have agreed on an extension to 30 June. But, if unsuccessful, uncertainty is set to remain rife as the extension date for this scenario was not made absolute by the third vote. It is likely that the EU will push for as lengthy a negotiation period as possible. In our view, this is the best that can be hoped for, in order to allow perspective and time for fruitful discussions.
Finally to China. The past two weeks have seen the 2019 National People's Congress and a slew of data updates following the Lunar New Year holidays. At the Congress, authorities maintained their focus on quality development and long-term prosperity. The lower and wider growth target for 2019, of 6.0%–6.5% versus 2019's 'around 6.5%', speaks to this intent and to the headwinds from softer global growth and US/China trade tensions. A full discussion of the economic initiatives highlighted by the Congress is on page 22 of our March Market Outlook; but from Australia's perspective, of greatest importance is growing support for infrastructure spending by local governments and business investment more broadly (a positive for commodities), and a drive to foster more profitable industry which begets higher incomes for households (supportive of greater demand for Australian service exports).
In terms of the data to hand, industrial production disappointed in February, but fixed asset investment met expectations. More importantly though, the breadth of investment growth looks to be widening, creating a sounder base for activity hence. Finally, taken together, the January and February credit data point to 2019 funding for local government spending being front loaded, and banks putting to work liquidity freed up by 2018/19's Reserve Requirement Ratio cuts.
Chart of the week: the Australian Dollar
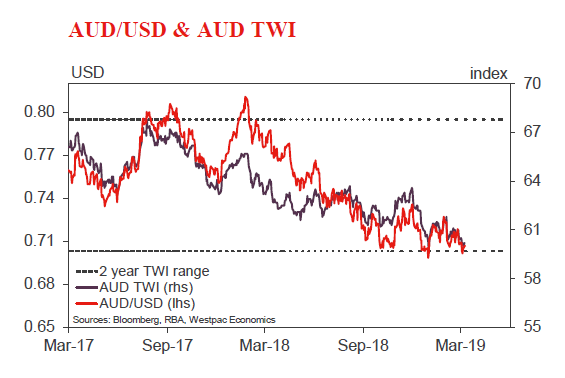
It has been an eventful month for the Australian economy, with GDP and other key data surprising to the downside, and interest rate expectations shifting. Regardless, at USD7093, the Australian dollar is unchanged from USD0.7093 when our February Market Outlook went to print, having held a fairly tight range of USD0.7009 to USD0.7183 since.
Our forecasts see that by end-2019, the policy rate differential between Australia and the US would stretch to –163bps – a highly-abnormal spread versus history. Against the scale of the above Australia/ US differentials for growth and interest rates, our forecast for around a 4% decline in the Australian dollar to USD0.68 in the second half of 2019 appears modest.
The justification for maintaining this forecast is two-fold: (1) key commodity prices continue to hold up better than anticipated; and (2) demand for Australian assets from foreign investors remains very strong.
New Zealand: week ahead & data wrap
Next week we should get confirmation of the slowdown in growth in the second half of 2018 with the release of December quarter GDP data. Our view is that this slowdown will prove temporary, with momentum set to improve in 2019, supported by high government spending, a strong pipeline of construction work, and a lift in labour incomes. On balance, data released this week tended to support that view.
We expect next week's report will show that GDP grew just 0.3% in the December quarter, after an equally modest gain in September. Our forecast is at the lower end of market expectations, and is significantly below the 0.8% GDP growth the RBNZ forecast in its February Monetary Policy Statement. If we're right that would see annual GDP growth fall to 2.7%, down from 3.1% in 2017 and 3.9% in 2016.
Some of the softness in growth in the December quarter is genuine. Importantly, the December Quarterly Employment Survey indicated less activity was taking place in the business and personal services sectors. But this weakness was also exacerbated by some temporary disruptions in the energy sector. Output from the Pohokura gas field was again interrupted this quarter (which will have a flow-on effect on methanol production). Meanwhile low hydro lake levels will directly weigh on electricity production with the subsequent lift in electricity prices to reduce demand from manufacturers.
Brighter spots in next week's GDP data are likely to include a strong lift in retail spending (after a subdued September quarter), a pickup in residential and commercial construction activity and increased spending on government services.
The big question is whether the late-2018 loss of momentum will continue into 2019. We think not. We expect GDP growth to recover.
A core component of this view is that consumer spending will strengthen in 2019 as petrol prices remain relatively flat and households benefit from rising wages and the range of new assistance measures from the Government. This week's retail card spending was supportive of the view. Data showed a healthy 0.9% lift in card core spending in the month (which excludes spending on fuel and autos), bringing the annual growth to 5.1%. After some unusual volatility in this measure in recent months (largely related to durable spending) February data signaled a return to the pace of growth in retail spending that was prevailing before the sharp lift in oil prices put a brake on other retail spending late last year.
Other data we've seen in recent weeks which support a brighter outlook for 2019 include a more positive outlook for export earnings thanks to rising dairy prices and a jump in the number of residential building consents issued.
In contrast, there was mixed support for our view from this week's housing data. February REINZ data did show nationwide house price inflation accelerating over the New Year, as we expected. Nationwide house prices rose around 0.7% in February and were up 1.3% over the summer as a whole (December through to February). This was a step up from the pace of house price inflation in the spring months. However, it looks increasingly like this 'summer fling' will prove brief.
The number of house sales provides one of the best shortterm leads on house prices, and took another big step down in February. Seasonally adjusted house sales fell 5.8% in the month. REINZ data understates the number of house sales in its initial release, but even if the true fall in house sales was closer to 4%, it comes on top of several months where house sales have been trending lower. The drop in turnover has been particularly stark in Northland, Auckland and Waikato, suggesting that the north of the country in particular is about to experience further house price weakness. In Auckland, the drop in sales has not been matched by a drop in listings, meaning a surplus of unsold homes on the market. Realestate. co.nz reports there are currently 9,400 unsold homes on the market in Auckland, up 50% on three years ago. What's more, homes are taking longer to sell. Nationwide the average time to sell has risen to 40 days, up from 37.5 a year ago.
Putting it all together, and it looks like house price inflation will fall a bit short of the 3% we had been expecting in 2019. Given how closely house prices and consumer spending are entwined, there's a risk of a small knock on effect for consumer spending, although clearly house prices are not the only factor at play when it comes to determining how far households decide to open their wallets.
One reason we expect stronger momentum in the economy in 2019 to prove temporary is the outlook for slowing population growth in the coming years. But getting a clear idea of how net migration flows (which are the key swing factor determining changes in the pace of population growth) are evolving has been challenging to say the least.
The February data confirmed that net migration numbers have become something of a lottery under Stats NZ's new methodology. This week's data suggested monthly net migration has shot up from under 5,000 to above 6,000 in the past two months, largely due to arrivals of French and German migrants. We find this very hard to believe. More likely, Stats NZ's new methodology is introducing volatility to the series.
For now, our view remains that annual net migration flows will continue to ease. At face value recent migration data challenges our assessment of the pace of this slowdown. But with such wild swings in the data being reported, we're reluctant to go very far down this path until we have a clearer understanding of just what's going on.
Data Previews
Aus Q1 AusChamber-Westpac business survey
- Mar 19, Last: 63.1
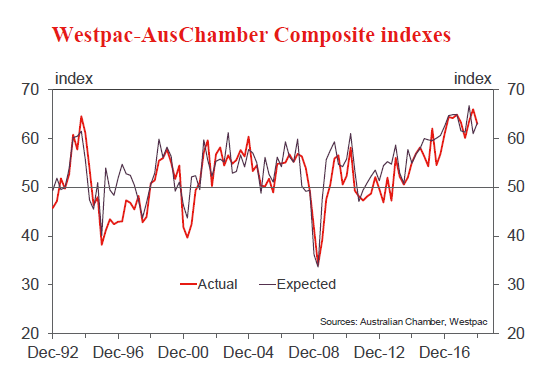
The Australian Chamber-Westpac survey of the manufacturing sector provides a timely update on conditions in the sector and insights into economy-wide trends. The Actual Composite tracks a range of demand related measures including investment and employment. The Q1 survey was conducted from February to March.
In Q4, the Actual Composite declined to 63.1 from 66.5 in September. The Composite is supported by new orders, output employment and order backlog.
Manufacturing is benefitting from a rise in public infrastructure and a relatively low AUD. However, home building activity is now in a downturn and there are likely to be spill-over effects from the drought in NSW and Queensland.
Aus Feb Westpac–MI Leading Index
- Mar 20, Last: –0.43%
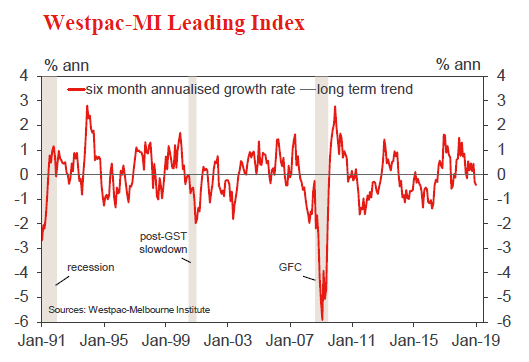
The six month annualised growth rate in the Westpac– Melbourne Institute Leading Index, which indicates the likely pace of economic activity relative to trend three to nine months into the future, fell to –0.43% in January. Despite some choppiness, the major trend is consistent with growth slowing to a below trend pace.
The Feb read will include a mixed bag of component updates. Positives include strong gains for the sharemarket (ASX200 up 5.2% vs 3.9% last month) and commodity prices (up 4.6% in AUD terms vs 3.9% last month); and a small recovery in dwelling approvals. The main negatives are around sentiment, with the Westpac-MI Consumer Expectations Index down -6.1% and the Westpac-MI Unemployment Expectations Index deteriorating 8.9%. The balance is likely to see another soft read.
Aus Feb Labour Force Survey - employment '000
- Mar 21, Last: 31.9k, WBC f/c: –5k
- Mkt f/c: 15k, Range: -5k to 30k
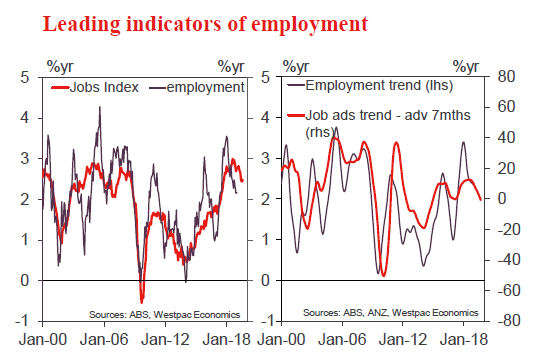
Total employment lifted a solid 39.1k in January, well clear of the market median of 15k. The year started with a solid trend pace of employment growth with a three month average gain of 31.9k. While it is just one month into the year, employment has gained 271k in the year to January (2.2%yr) with a very solid 2.9%yr six month annualised pace.
There is, however, an important caveat – January is the peak holiday month in Australia as Christmas, New Year and school summer vacation all come together. Little business happens in Australia at this time.
The leading indicators are softening but they are not pointing to a collapse in employment (at this stage). We believe that employment growth is set to stall through the first half of 2019 but our –5k forecast for February is more about monthly volatility than the start of a new trend.
Aus Feb Labour Force Survey - unemployment %
- Mar 21, Last: 5.0%, WBC f/c: 5.1%
- Mkt f/c: 5.0%, Range: 4.9% to 5.1%
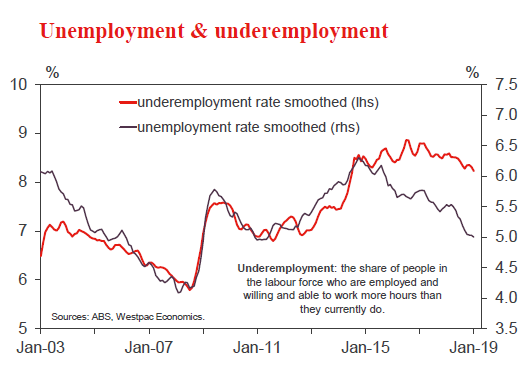
Despite the strong gain in employment, the unemployment rate was flat in January at 5.0% (market median was for 5.0%) as a 0.1ppt lift in the participation rate to 65.7% (65.72% at two decimal places) boosted the gain in the labour force by 45.7k.
It is also worth noting that 2018 produced a –0.2ppt decline in the underemployment rate from Q1 to Q4. In January there was a further improvement in underemployment to 8.2% (from 8.3%) the lowest print in underemployment since March 2015. Again, we would caution that this is a January print so would not project that this improvement can be sustained but nevertheless, it is another indicator of just how robust the labour market was through 2018.
Holding the participation rate flat at 65.7%, our forecast for a –5k fall in employment will see the unemployment rate tick up to 5.1%.
NZ Q1 Westpac McDermott Miller Consumer Confidence
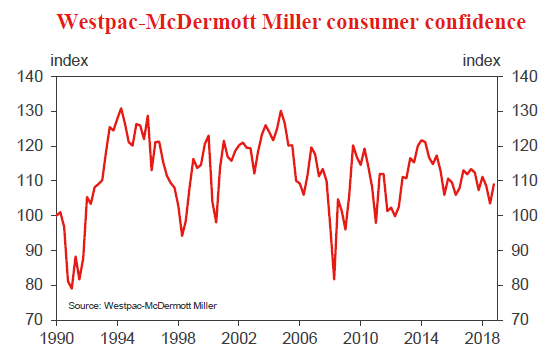
- Mar 19, Last: 109.1
Consumer confidence picked up in December, shaking off its mid-year slump. That was supported by the fall in fuel prices in late 2018, along with signs the housing market was firming in some parts of the country. December's gains in confidence were widespread across regions, age brackets and income groups.
Since the time of the last survey, we've seen downward pressure on interest rates and an easing in mortgage lending restrictions. There's also been an increased focus on tax policy, including the possible introduction of a capital gains tax, following the release of the Tax Working Group's final report in February.
NZ Q4 current account % of GDP
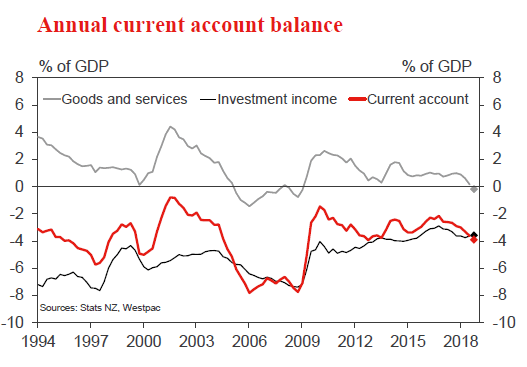
- Mar 20, Last: -3.6%, WBC f/c: -3.9%, Mkt f/c: -3.9%
We expect the annual deficit to widen further from 3.6% to 3.9% of GDP. This would match the deficit in the December 2012 quarter, which in turn was the largest since the GFC.
The widening in the deficit has been driven by the goods trade balance. The terms of trade fell over 2018 as dairy export prices fell and oil import prices rose (though both of those have turned around in the early part of this year). In addition, import volumes have remained surprisingly high relative to domestic demand.
In contrast, there has been little change in the investment income deficit, with profits of overseas-owned firms and interest costs on overseas debt broadly flat over the last year.
NZ Q4 GDP
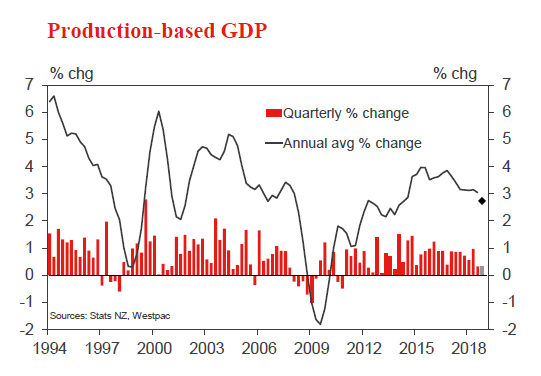
- Mar 21, Last: 0.3%, WBC f/c: 0.3%, Mkt f/c: 0.6%
We expect just a 0.3% rise in GDP for the December quarter, following an equally soft gain in the September quarter. Our forecast is at the bottom of the range of market forecasts, and substantially below the RBNZ's forecast of 0.8%.
There does seem to have been some genuine loss of momentum in the second half of last year. However, in the December quarter this was exacerbated by some temporary disruptions to gas and electricity supplies.
Consumer spending and construction are likely to be the highlights for the quarter, in contrast with the housing-led slowdown in these components in Australia.
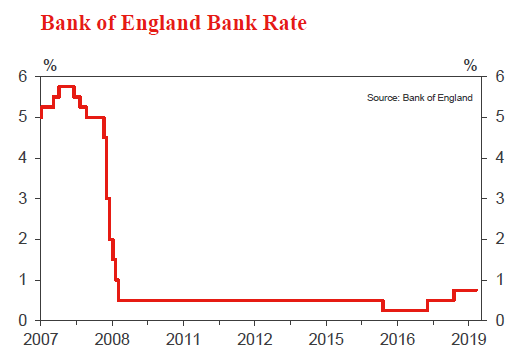
UK Bank of England Bank Rate
- Mar 21, Last: 0.75%, WBC f/c: 0.75%, Mkt f/c: 0.75%
In February, the BOE left the Bank rate unchanged and maintained its very mild tightening bias. However, the assumed tightening was contingent on economic conditions following the UK's exit from the EU, and the BOE noted that Brexit related uncertainty had intensified.
Since the BOE's last update, economic activity has remained middling. Importantly, there's been no real progress on Brexit negotiations. Parliament intends to seek an extension to the negotiation period, but for businesses this means the continuation of the economic uncertainty that has been a significant drag on investment plans. Against this backdrop, there's no chance of a change in the Bank Rate this month, and the BOE will emphasise the conditionality of its forecasts.
US Mar FOMC meeting
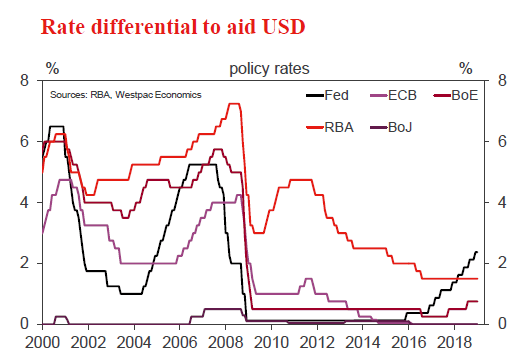
- Mar 19–20, Last: 2.375%, WBC f/c: 2.375%
The FOMC's March meeting will not only provide an updated qualitative assessment of the outlook, but also the first set of revised quantitative economic forecasts since the Committee's collective dovish turn at the start of this year.
With data since decidedly mixed in tone, growth and inflation forecasts are under pressure. That said, the scale of downward revisions is unlikely to be significant. Growth at or above trend in 2019 is still the most appropriate core expectation to hold for the US – unlike Europe.
The market's primary focus for the FOMC's post-meeting communications will be 'the dots', i.e. Committee estimates of the fed funds rate over the forecast period. A downward revision has to be expected. But, given the strength of the labour market, some probability of a hike will remain. We continue to forecast one more hike in December 2019.
China Weekly Letter – Xi-Trump Summit Delayed, Q1 Data a Mixed Bag
- Xi-Trump summit in April at the earliest, according to sources.
- Data for Jan/Feb was mixed but leading indicators still point to recovery.
- Stock markets take a breather as regulator sends warning.
Xi-Trump summit delayed to at least April
Sources close to the trade negotiations said on Thursday that a summit between Donald Trump and Xi Jinping would take place in April at the earliest , see Bloomberg 14 March. According to the article, Xi's staff is no longer planning for a flight to Florida after a planned visit to France and Italy at the end of this month.
Speaking on the trade negotiations on Wednesday, US President Donald Trump told reporters that "things are going along very well " and "I think the deal is going to be made... but we'll see what happens ". However, he also stressed that he is in no hurry to make a deal, referring to those accusing him of rushing a deal, see Reuters 13 March. Trump also told reporters that he preferred to finish the deal at a summit with Xi but was also open to competing the deal beforehand and instead meet for signing the trade deal. Former economic adviser Gary Cohn said in an interview that Trump is 'desperate' to sign a deal with China, see Bloomberg , 14 March.
On Friday, the National People's Congress approved a new foreign investment law aimed at levelling the playing field for foreign companies and increasing protection of intellectual property rights, see SCMP , 15 March. This would come into effect on 1 January 2020. The law was first introduced as a draft in 2015 but in the past three months, it has been rushed through to accommodate US demands in the trade talks.
Comment: As we wrote last week , things are bound to get trickier at the end of such negotiations with so much at stake , see China Weekly Letter - Trade deal to face hurdles, closer to the finish line , 7 March. It seems the US wants an enforcement mechanism in which they can re-impose tariffs on China if they believe China is not honouring the deal, without China being allowed to retaliate. No Chinese president could sell such a deal domestically. China prefers an independent body such as the WTO to be the judge of any breach, which is a no-go for the US. A compromise needs to be found.
Xi will not agree to a summit unless a deal is more or less completed . Trump's comments that he could walk from a deal if it is not good enough has created anxiety on the Chinese side. Xi cannot risk giving Trump the honour of hosting a summit in his own resort and then come home without a signed agreement. We probably have to wait for trade talks to be more or less finished before a summit would be announced. This may take some time. Ultimately, we still firmly believe a deal will be made, though , as Trump needs a deal for his campaign for the 2020 Presidential elections, which kick off soon. Failure to reach a deal would lead to sharp declines in equities and China would stop buying soy beans, etc., which would hurt voters in important swing states. In our view, it is unlikely that Trump would choose that path.
Mixed data for Jan/Feb but leading indicators still improving
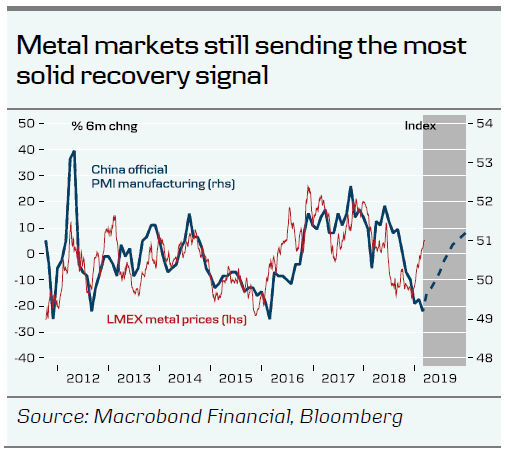
Chinese data for industrial production, retail sales and fixed asset investments was a mixed bag, see Flash Comment China – Q1 was weak but leading indicators point to a bottom, 14 March. The surveyed unemployment rate jumped from 4.9% in January to 5.3% in February. On a more positive note, the Chinese Customs chief Ni Yuefeng reported that China's exports for the first nine days of March were up 39.9% compared to the same period last year, see SCMP, 11 March. Metal prices are also still hanging on to the gains seen recently, thus still supporting a picture of bottoming growth.
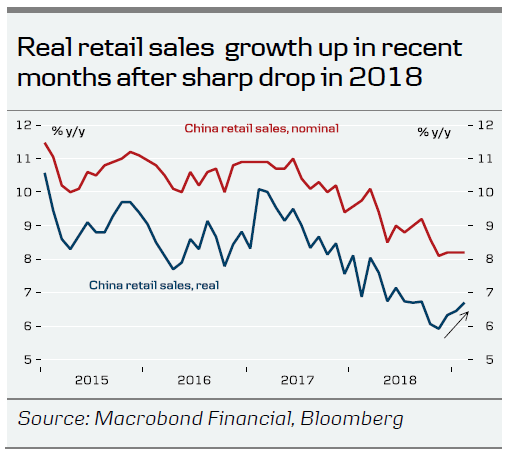
Comment: The data this week does not change our view that growth was weak in Q1 but that is also likely to be the low point for growth. The jump in the unemployment rate is interesting, as we are not used to big changes in unemployment. However, it fits well with the picture of a slowdown – and possibly also some distortion from Chinese New Year. We look for stimulus measures to kick in with more force as 2019 unfolds and a trade deal should also reduce a big cloud of uncertainty. Although the tech war is set to continue, it will have less economic impact. We also doubt Trump would dare to reignite the trade war in the middle of an election campaign, where he needs the tailwind from strong markets and a robust economy.
Stock markets take a breather
Chinese equities hit a few more road blocks this week. On top of more mixed signals in trade talks, the Chinese regulator also warned brokerages to minimise the risks from margin lending and warned "analysts to avoid inflammatory language", see Bloomberg, 14 March. In particular, the ChiNext small cap index of mostly technology companies took a beating, falling 7% overall on Wednesday and Thursday. It is still up more than 30% this year, though, following a very strong performance in February.
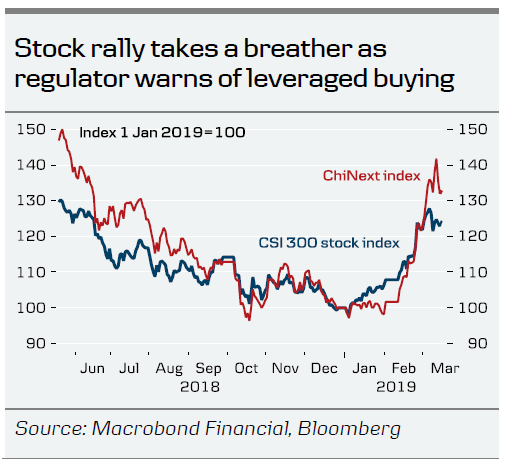
Comment: We see the declines as a healthy correction and would not rule out further declines in the short term; especially if doubts creep in regarding a trade deal. However, in the medium to longer term, we see more upside in Chinese stocks on the back of a gradual economic recovery and accommodative monetary policy.
Other China news of the week
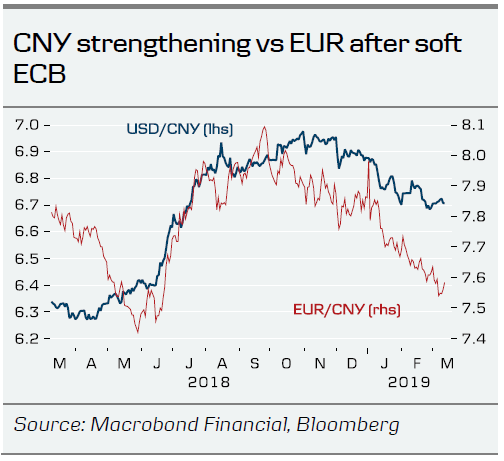
The CNY has been stable this week with USD/CNY around 6.72. We look for the declining trend to continue over the next year, albeit at a slower pace than seen in the past months.
An EU Commission paper released this week takes a tougher stance on China. In what is called 'A strategic outlook' communication, the EU Commission describes China as a 'systemic rival' and 'economic competitor'. It recommends a common EU approach to the security of 5G networks and heightened awareness of security risks in critical assets, technologies and infrastructure. While critical in some areas, the paper also recommends strengthened engagement and cooperation. The paper is the position of the EU Commission and not the European Council.
Voices of criticism of key Chinese policies at NPC, see SCMP, 13 March. The most outspoken has been Lou Jiwei, the chairman of the National Council for the Social Security Fund and previously finance minister. He called the 'Made in China 2025' policy a waste of taxpayers' money. The remarks contradict the criticism often heard that there is no room for debate in China. Although there is clearly a limit in how far you can go.
Dollar Depreciation Remains Elusive Even as Fed Prepares to Lower Rate Path Prediction
Following the Federal Reserve’s dovish pivot in January, there is a lot of anticipation for the next FOMC meeting on March 19-20 when policymakers will publish their latest economic projections, including a revised dot plot chart. But as the Fed becomes increasingly at ease with its newly-adopted wait-and-see approach, the dovish policy move does not appear to be transmitting into the currency markets, with the dollar index holding close to 1½-year highs.
The greenback was widely expected to weaken in 2019 even before Jerome Powell’s dramatic intervention early in January when he first signalled that the Fed will be “patient” in assessing the need for further rate hikes. The Fed raised rates four times in 2018, driving the dollar index, which measures the US currency against a basket of six of its major peers, up by more than 4%. But while the central bank was always expected to slow the pace of rate increases in 2019, pressing the pause button so soon in January took many market participants by surprise.
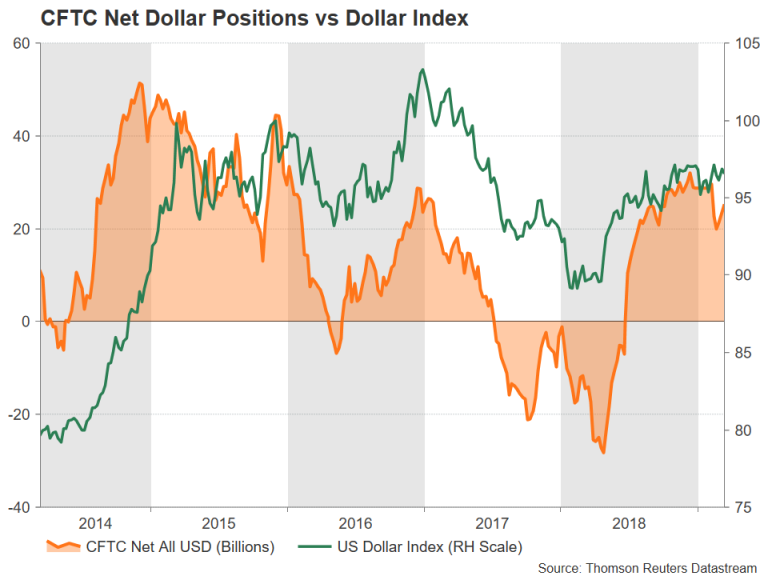
Moderating growth and muted inflation in the United States are some of the concerns of the Federal Open Market Committee (FOMC), but the biggest factors cited for the policy turn were the sharp slowdown elsewhere in the world as well as the turbulence that shook financial markets at the end of 2018. Heading into the March policy meeting, investors are anxiously waiting to find out how the median projection of the federal funds rate has shifted since the December meeting when two rate rises were being forecast for 2019.
Although Fed officials have communicated a pretty consistent message that the Committee is done with raising rates for now, most remain open to the possibility of resuming the rate hike process later in the year. Whether this will result in a majority of Committee members projecting at least one rate rise in the second half of 2019 remains to be seen but can certainly not be ruled out given policymakers’ public remarks.
Should the FOMC forecasts signal one rate hike in 2019, the dollar would likely appreciate and could reattempt a break above the strong resistance zone between 111.80 and 112.00 against the Japanese yen. Steeper gains are possible, with the 112.60 region coming into view, given that futures markets are indicating the opposite and suggesting a small chance of a rate cut by year-end.
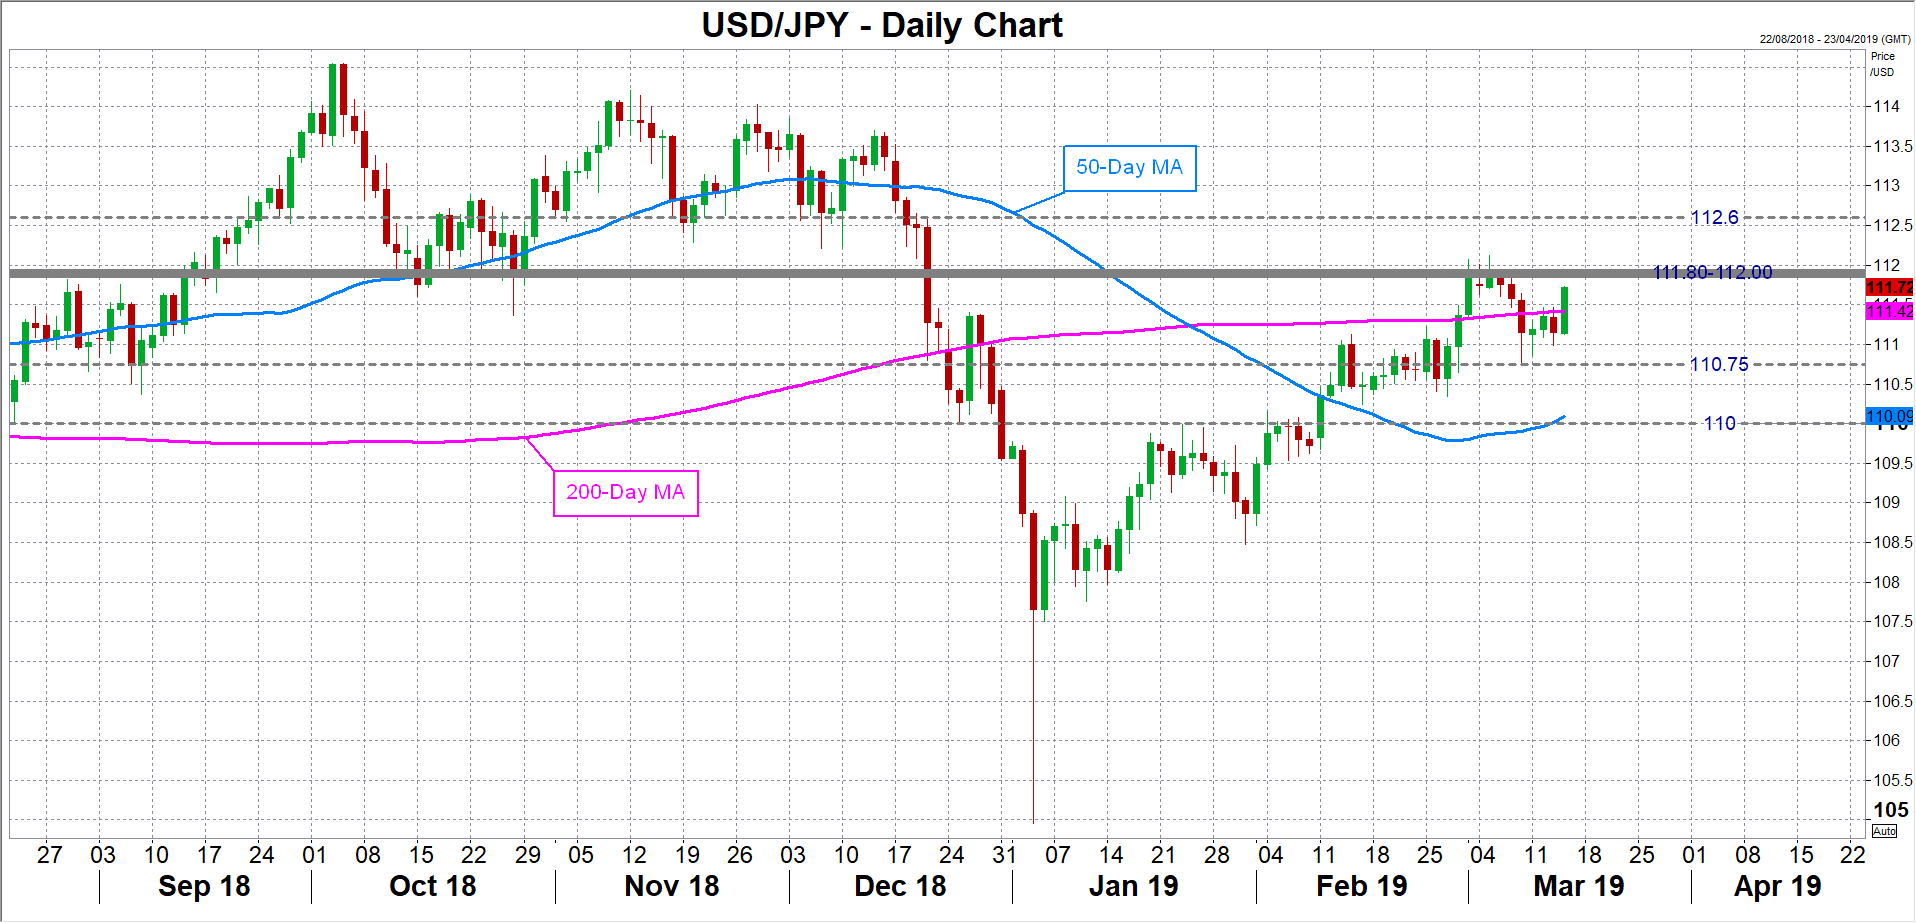
The market pricing of a rate cut suggests investors foresee the US and global economic outlook deteriorating further in the coming months even if they don’t expect the Fed to completely drop its tightening bias just yet. But while it’s likely that the Fed would want to keep its options open regarding future rate increases, it would also not want to upset markets either by signalling that rates may still be raised later this year.
Should the Fed surprise investors with an overly cautious set of growth and inflation projections and predict no more rate increases, the dollar could slide and seek support again from the recently congested area of 110.75 area before testing the key psychological level of 110.00.
However, an FOMC statement and set of projections that are more closely aligned with the market’s view than what some analysts are anticipating at the moment may not necessarily guarantee a weaker dollar, at least not in the medium term. Although in January the Fed made one of its sharpest policy reversals in its history, the move still leaves it comparatively more hawkish than other major central banks.
Investors may have substantially downgraded their outlook for the US economy in recent months but with the rest of the world stuck in the doldrums, US assets remain relatively attractive and that would probably limit how far the bears would be able to pull down the dollar.
One of the biggest disappointments in 2018 was the Eurozone’s lacklustre performance and with 2019 well underway, the economy has yet to reach a turning point. Until clear signs of a rebound start to appear, the euro’s fortunes are unlikely to change and that would mean little downside for the dollar index, which the single currency constitutes about 58% of its weighting.
Since the summer of 2018, the dollar index has been hovering around the 50% Fibonacci retracement of the January 2017- February 2018 downtrend. The 50% Fibonacci is around the 96.0 level with the 61.8% Fibonacci forming the top of the range near 97.85 and the 23.6% Fibonacci creating a floor around 94.20.
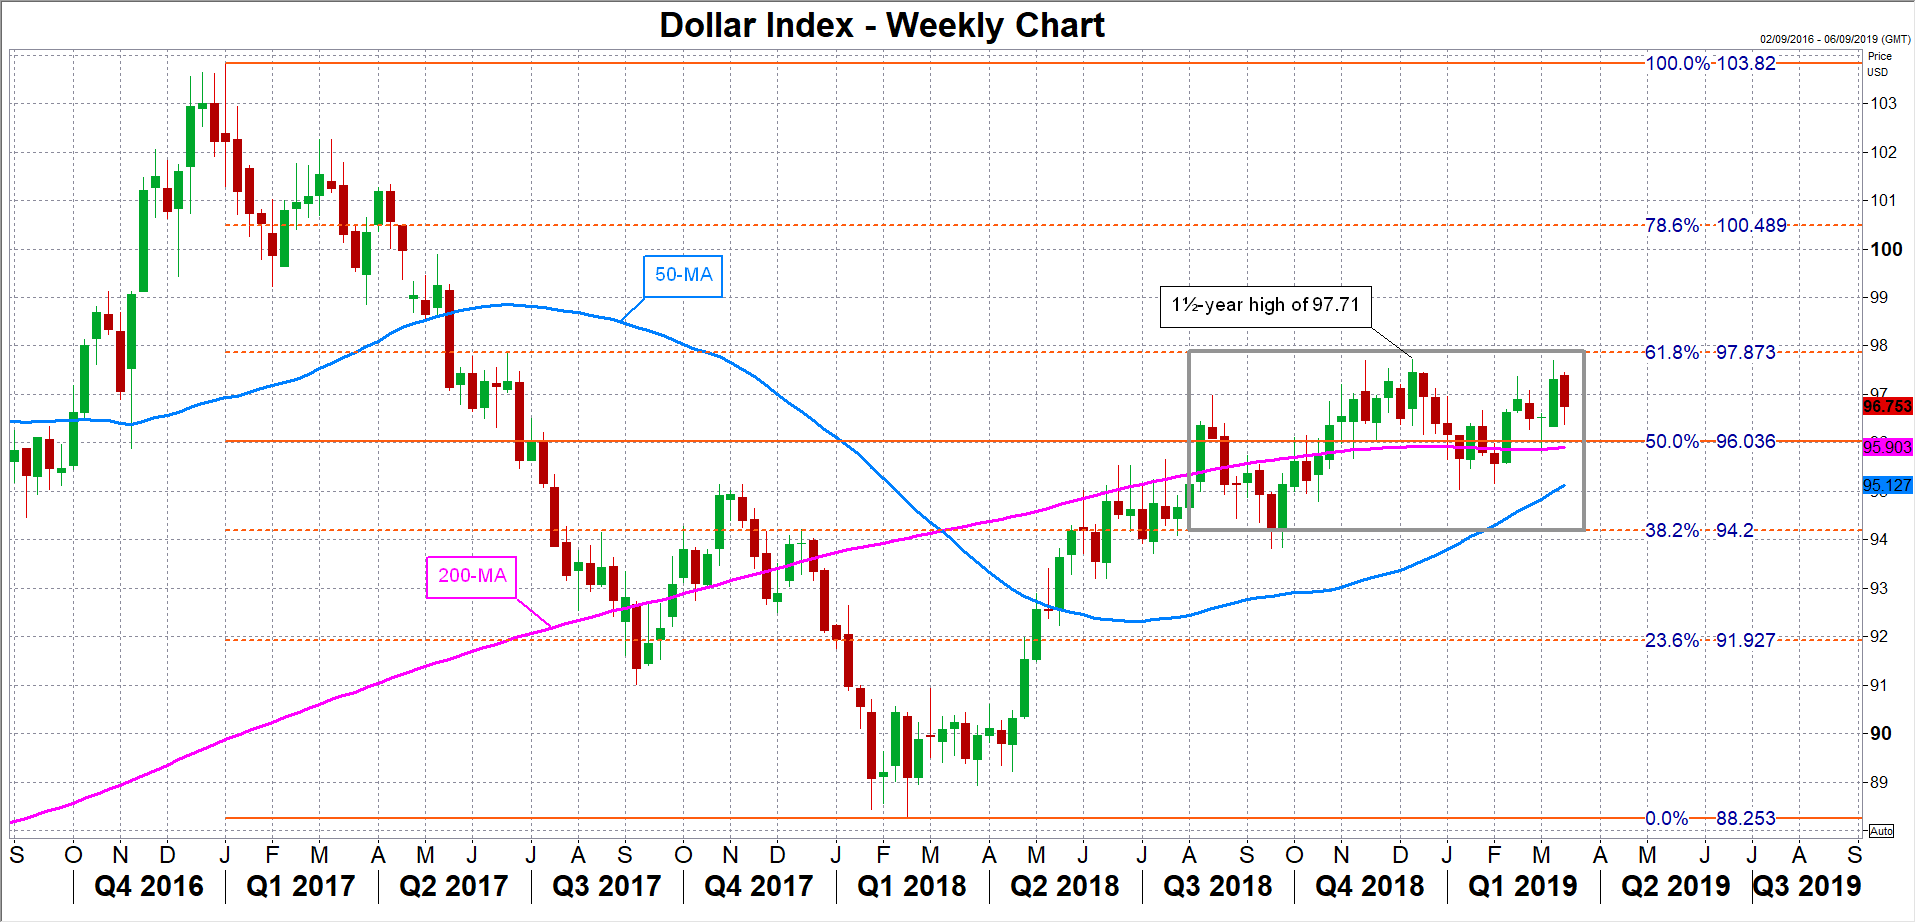
For the index to break out of this range in either direction, there would have to be significant developments on the growth front in the euro area as well as in the US’s other main trading partners that make up the index such as Japan, Canada and the UK. With growth stuttering in all of these countries, it didn’t take long for their respective central banks to follow the Fed with a dovish tilt, resulting in the downward effect of the Fed’s policy shift on the US currency being partially offset.
Should growth in these regions begin to bounce back, particularly if the immediate threats from trade tensions and Brexit were to recede, the downside risks for the dollar could start accumulating. An improving economic picture outside of the US remains the best bet for the greenback to depreciate, as even if the American economy was to lose some further steam, a much severe downturn appears unlikely at this point given that its fundamentals still look much better than its competitors’.
In fact, it could be argued that a pick up in US economic momentum is not only a more probable outcome than a deeper slowdown but also more likely than a convincing rebound in global growth. Consequently, should the Fed be forced to make another U-turn by resuming its tightening cycle, the dollar could end up finishing 2019 with year-to-date gains, especially if any recovery in other parts of the world lags growth in the US.
Another upside risk for the greenback is a collapse in the US-China trade talks. The US dollar has been behaving as a safe-haven in the Sino-US trade story but has seen an unwinding of safety flows as optimism grows that a deal between the two trading powers is within reach. A break down in the trade talks could see safe-haven demand returning to the greenback, pushing the currency higher against its peers that don’t enjoy a similar status.
Ultimately, given the current state of the world economy and the headwinds facing it, Fed policy may not play as big a role in the dollar’s direction in 2019 as developments outside of the US, as well as of course President Trump’s stance on trade.