Sample Category Title
Gold: Yellow Metal Trading On A Negative Footing In The Morning Session
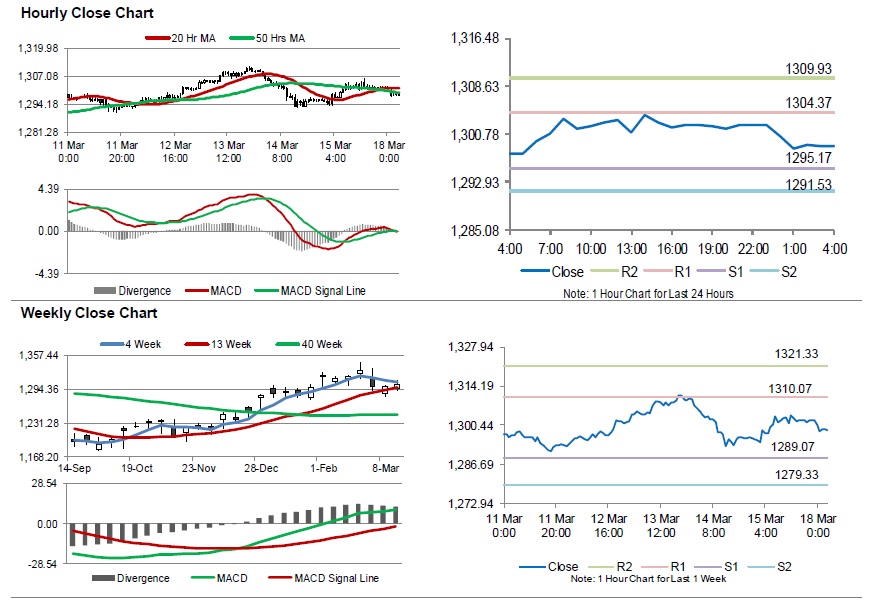
For the 24 hours to 23:00 GMT, Gold rose 0.46% against the USD and closed at USD1302.00 per ounce on Friday, amid weakness in the US dollar.
In the Asian session, at GMT0400, the pair is trading at 1298.80, with gold trading 0.25% lower against the USD from Friday’s close.
The pair is expected to find support at 1295.17, and a fall through could take it to the next support level of 1291.53. The pair is expected to find its first resistance at 1304.37, and a rise through could take it to the next resistance level of 1309.93.
The yellow metal is trading below its 20 Hr moving average and showing convergence with its 50 Hr moving average.
Silver: White Metal Reverses Its Gains In The Asian Session
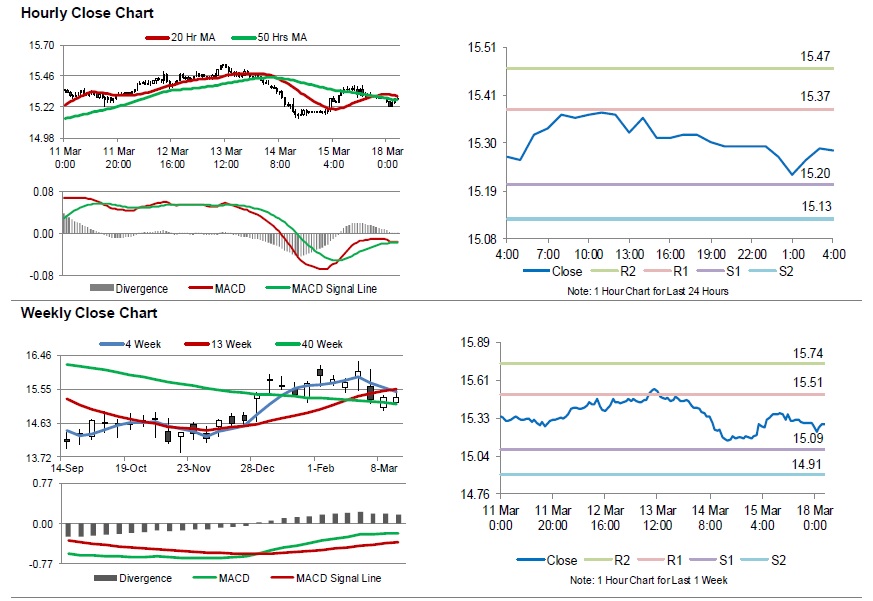
For the 24 hours to 23:00 GMT, Silver rose 0.69% against the USD and closed at USD15.29 per ounce on Friday, tracking gains in gold prices.
In the Asian session, at GMT0400, the pair is trading at 15.28, with silver trading 0.07% lower against the USD from Friday’s close.
The pair is expected to find support at 15.20, and a fall through could take it to the next support level of 15.13. The pair is expected to find its first resistance at 15.37, and a rise through could take it to the next resistance level of 15.47.
The white metal is showing convergence with its 20 Hr and 50 Hr moving averages.
Crude Oil: Oil Extends Its Losses In The Asian Session
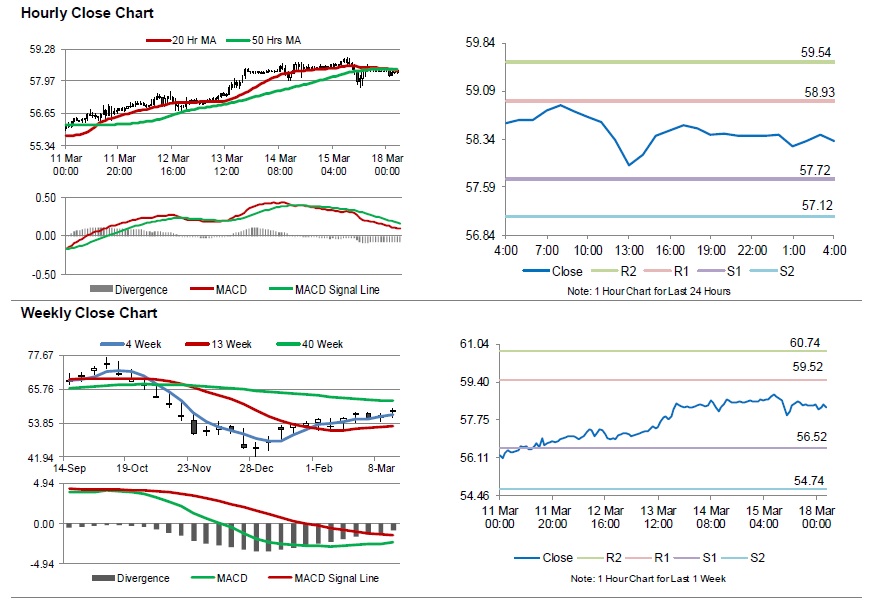
For the 24 hours to 23:00 GMT, Crude Oil declined 0.26% against the USD and closed at USD58.43 per barrel on Friday.
Meanwhile, fresh figures from Baker Hughes disclosed that the number of active oil rigs fell by 1 to 833 in the week ended 15 March 2019, marking its lowest level since April 2018.
In the Asian session, at GMT0400, the pair is trading at 58.31, with oil trading 0.21% lower against the USD from Friday’s close.
The pair is expected to find support at 57.72, and a fall through could take it to the next support level of 57.12. The pair is expected to find its first resistance at 58.93, and a rise through could take it to the next resistance level of 59.54.
Crude oil is showing convergence with its 20 Hr and 50 Hr moving averages.
GBP/USD Surging, USD/CAD Facing Many Hurdles
GBP/USD climbed higher and settled above the 1.3210 resistance level. USD/CAD corrected higher, but it failed to break the key 1.3370 resistance area and later declined.
Important Takeaways for GBP/USD and USD/CAD
- The British Pound gained bullish momentum and traded above the 1.3200 resistance area.
- There is a major bullish trend line formed with support at 1.3270 on the hourly chart of GBP/USD.
- USD/CAD broke a key bearish trend line with resistance at 1.3330 on the hourly chart.
- The pair failed to break the 1.3370 resistance trimmed most its recent gains.
GBP/USD Technical Analysis
The British Pound found a strong buying interest near the 1.2970 and 1.3000 levels against the US Dollar. The GBP/USD pair started a solid upward move and broke the 1.3120 and 1.3200 resistance levels to move into a positive zone.
It even broke the 1.3300 barrier and traded as high as 1.3380 on FXOpen. There was even a close above the 1.3250 level and the 50 hourly simple moving average. Later, there was a downside correction below the 1.3300 and 1.3280 levels.
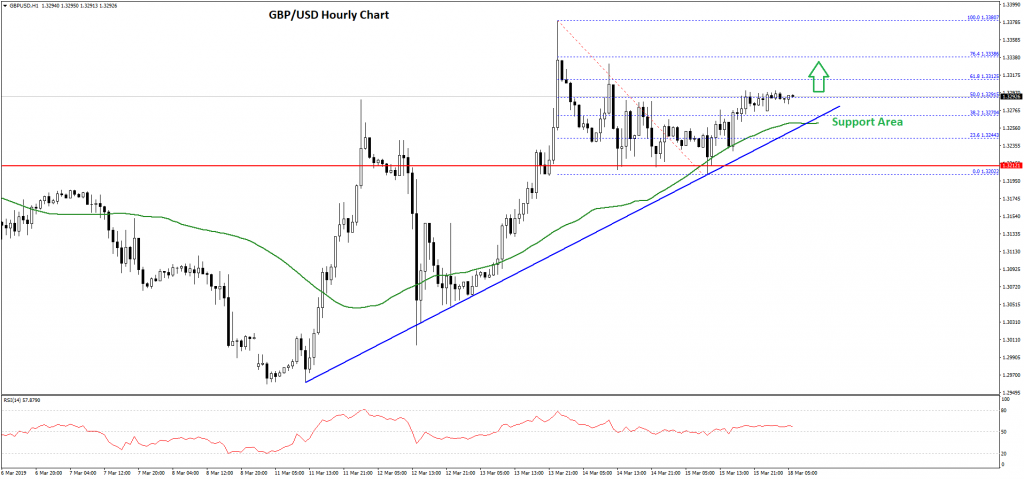
However, the 1.3200-1.3210 area acted as a decent support and prevented further losses. There is also a major bullish trend line formed with support at 1.3270 on the hourly chart of GBP/USD.
The pair moved higher above 1.3250 and the 38.2% Fib retracement level of the last decline from the 1.3380 high to 1.3202 low. The pair also moved above the 1.3280 level, but the 1.3300 level is currently acting as a resistance.
Besides, the pair is struggling to gain strength above the 50% Fib retracement level of the last decline from the 1.3380 high to 1.3202 low. The current price action is positive and suggests that the pair may soon break the 1.3300 and 1.3320 resistance levels.
On the upside, the next key resistance is near the 1.3350 level, above which the pair could revisit the 1.3380 swing high. On the downside, a break below the trend line support at 1.3270 could push the pair back towards the 1.3200 support area.
USD/CAD Technical Analysis
The US Dollar declined heavily and broke the 1.3400 and 1.3350 support levels against the Canadian Dollar. The USD/CAD pair even broke the 1.3300 support level before buyers appeared near the 1.3290 level.
A low was formed at 1.3289 and later the pair formed a solid support base near the 1.3300 level. Finally, there was an upside break above 1.3320 level and a key bearish trend line with resistance at 1.3330 on the hourly chart.
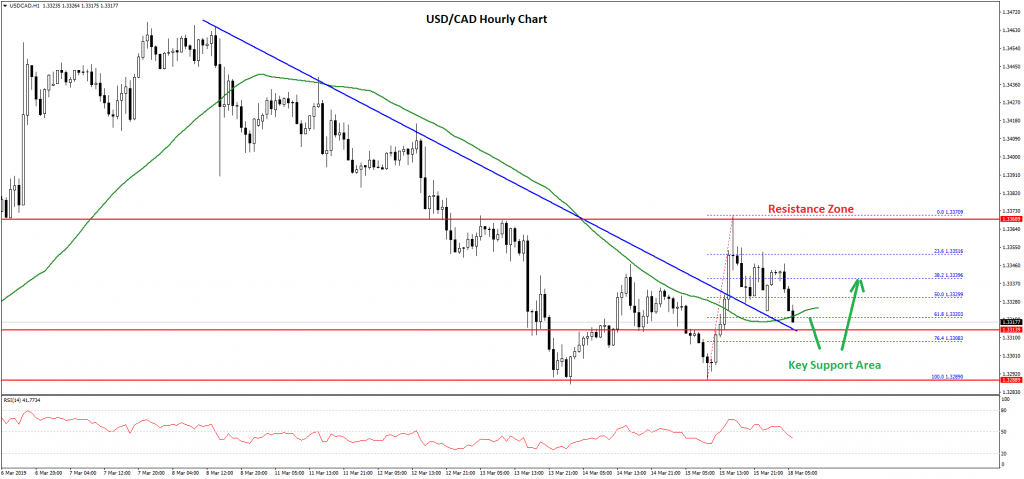
The pair rallied above the 1.3350 level and the 50 hourly simple moving average. However, the 1.3370 level acted as a solid resistance and prevented further gains.
As a result, there was a fresh decline below the 1.3350 level and the 50% Fib retracement level of the last wave from the 1.3289 low to 1.3370 high. The pair even broke the 1.3330 level and retested the 1.3320 support area.
It is currently trading near the 61.8% Fib retracement level of the last wave from the 1.3289 low to 1.3370 high. It seems like USD/CAD could decline further before the 1.3300 support comes into play. As long as the pair is above 1.3300, it could bounce back. If not, the pair may slide sharply towards the 1.3250 level.
EUR/USD Daily Outlook
Daily Pivots: (S1) 1.1301; (P) 1.1323; (R1) 1.1346; More.....
With 1.1277 minor support intact, further rise could be seen in EUR/USD. But upside should be limited below 1.1419 resistance to bring down trend resumption. On the downside, below 1.1277 minor support will turn bias to the downside for 1.1176 low first. Break of 1.1176 will target 100% projection of 1.1814 to 1.1215 from 1.1569 at 1.0970 next.
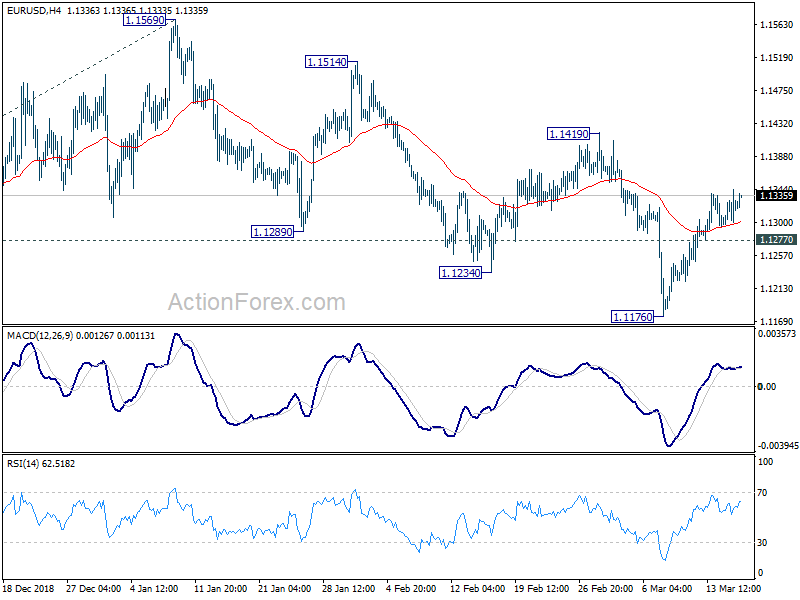
In the bigger picture, down trend from 1.2555 medium term top is still in progress. Bearishness is affirmed by sustained trading below falling 55 week EMA. 61.8% retracement of 1.0339 (2017 low) to 1.2555 at 1.1186 is met. Sustained break there will pave the way to retest 1.0339. On the upside, break of 1.1569 resistance will now indicate completion of such down trend and turn medium term outlook bullish.
GBP/USD Daily Outlook
Daily Pivots: (S1) 1.3231; (P) 1.3265; (R1) 1.3328; More....
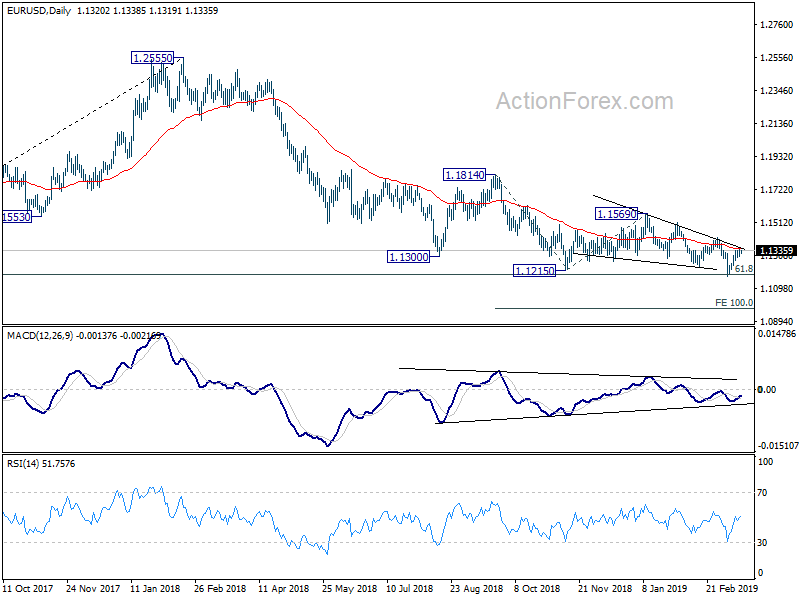
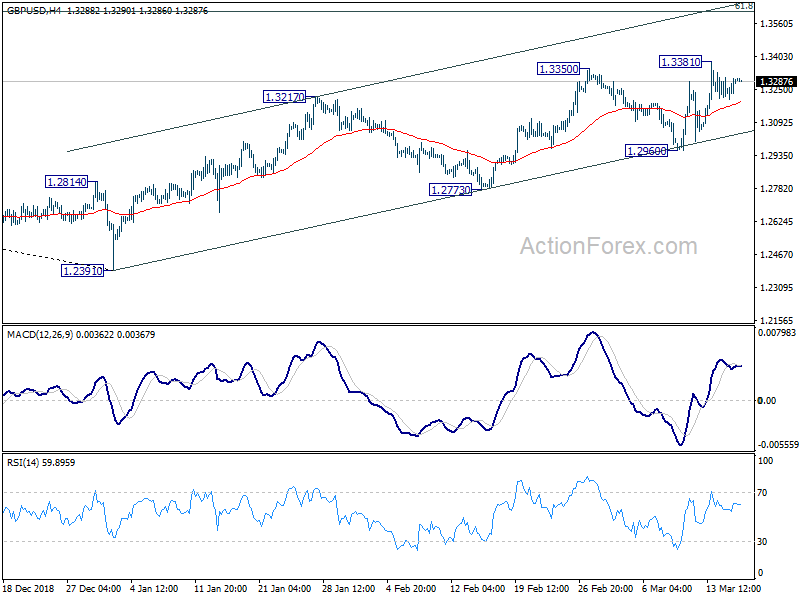
Intraday bias in GBP/USD remains neutral for the moment. Further rise is expected as long as 1.2960 support holds. On the upside, firm break of 1.3381 will target 61.8% retracement of 1.4376 to 1.2391 at 1.3618 next. However, on the downside, firm break of 1.2960 will indicate that rebound from 1.2391 has completed earlier than expected. Deeper fall would then be seen to 1.2773 support for confirmation.
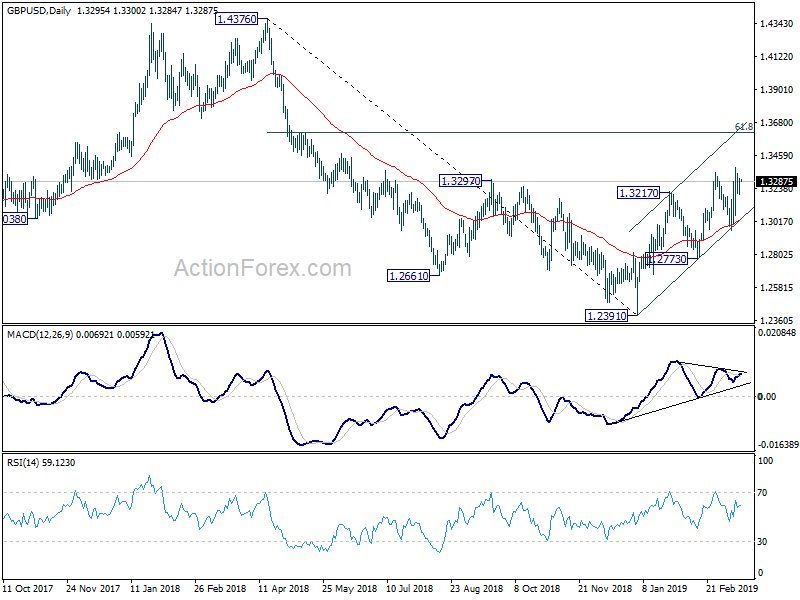
In the bigger picture, medium term decline from 1.4376 (2018 high) should have completed at 1.2391. Rise from 1.2391 is now seen as the third leg of the corrective pattern from 1.1946 (2016 low). Further rise could be seen through 1.4376 in medium term. On the downside, though, break of 1.2773 support will dampen this view. Focus will be turned back to 1.2391 low and break will resume the fall from 1.4376 to 1.1946.
USD/CHF Daily Outlook
Daily Pivots: (S1) 1.0004; (P) 1.0028; (R1) 1.0047; More....
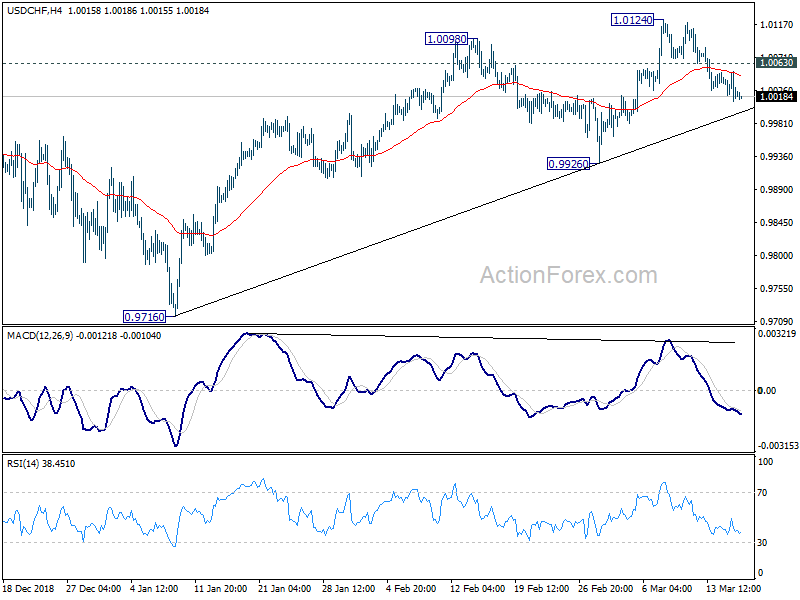
Intraday bias in USD/CHF remains on the downside at this point. Fall from 1.0124 is in progress for 0.9936 support. Decisive break there will carry larger bearish implication. On the upside, though, break of 1.0063 minor resistance will turn bias back to the upside for retesting 1.0124 instead.
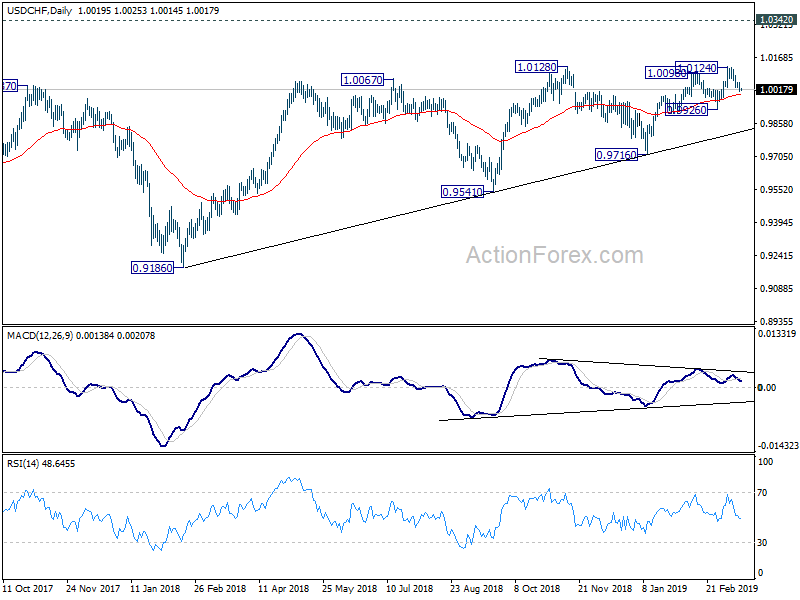
In the bigger picture, USD/CHF drew strong support from medium term trend line and rebounded. That suggests rise from 0.9186 is still in progress. Further break of 1.0128 will confirm up trend resumption and target 1.0342 key resistance. Nevertheless, break of 0.9926 support will be the first signal of medium term reversal and bring another test on the trend line.
USD/JPY Daily Outlook
Daily Pivots: (S1) 111.23; (P) 111.59; (R1) 111.82; More...
Intraday bias in USD/JPY remains neutral as consolidation from 112.13 continues. As long as 110.35 support hold, near term outlook remains bullish. On the upside, break of 112.13 will resume the rally from 104.69 to 114.54 resistance next. However, firm break of 110.35 should confirm near term reversal and turn outlook bearish for 108.49 support and below.
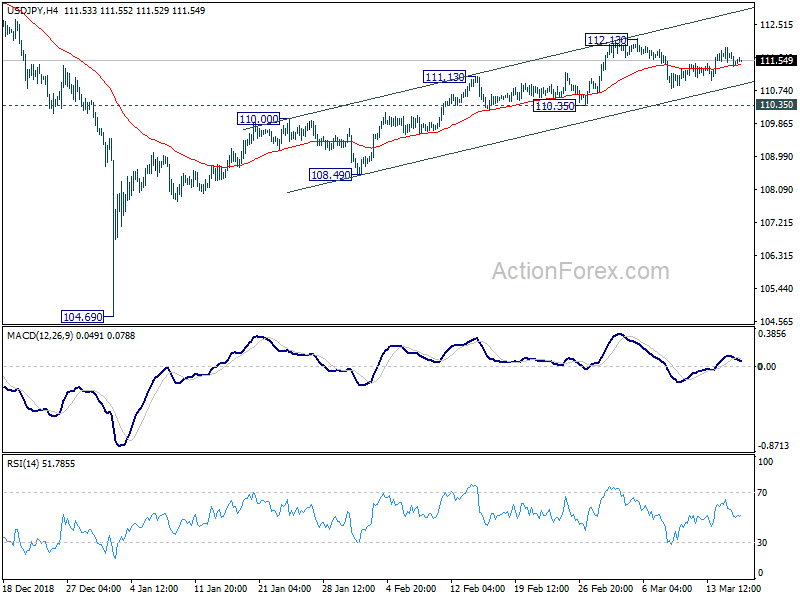
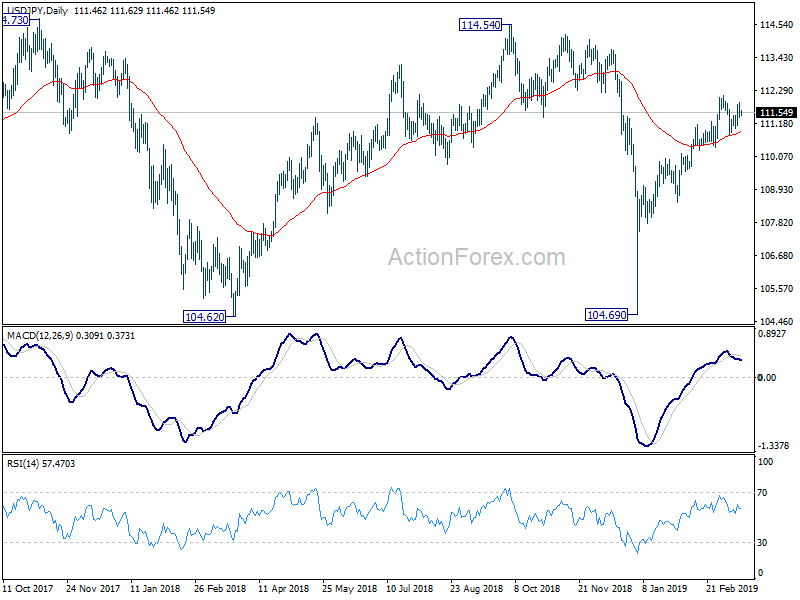
In the bigger picture, strong rebound from 104.69 argues that decline from 118.65 (2016 high) has completed with three waves down to 104.69, after failing 104.62. More importantly, the rise from 98.97 (2016 low) could be resuming. Decisive break of 114.54 resistance will add more credence to this bullish case and target 118.65. This will now be the favored case as long as 110.35 support holds. However, firm break of 110.35 will mix up the medium term outlook again and turn focus back to 104.69 low.
USD/CAD Daily Outlook
Daily Pivots: (S1) 1.3293; (P) 1.3333; (R1) 1.3377; More...
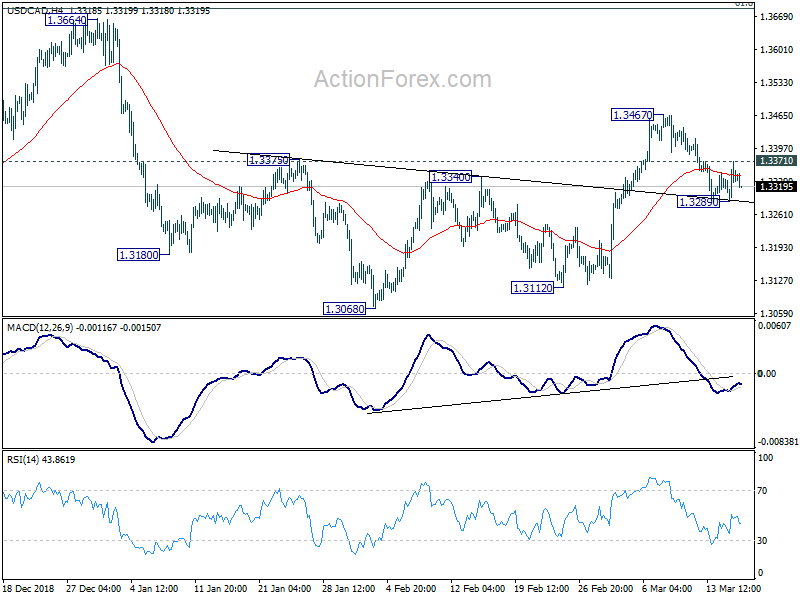
Intraday bias in USD/CAD remains neutral first. With 1.3371 minor resistance intact, further decline is in favor. Break of 1.3289 will extend the fall from 1.3467 to 1.3068/3112 support zone. Nevertheless, on the upside, above 1.3371 will suggest that pull back from 1.3467 has completed. That will also revive the bullish case that rise from 1.3068 is still in progress. In such case, intraday bias will be turned back to 1.3467 resistance and above.
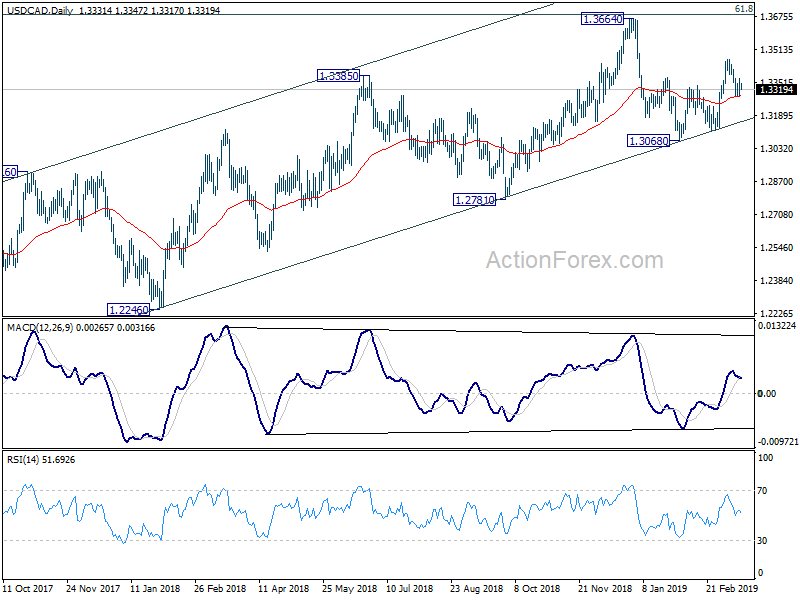
In the bigger picture, structure of the medium term rise from 1.2061 (2017 low) to 1.3664 is not clearly impulsive. Hence, we'd stay cautious on strong resistance from 61.8% retracement of 1.4689 (2016 high) to 1.2061 at 1.3685 and 1.3793 resistance to limit upside, and bring medium term topping. But in any case, medium term outlook will stay bullish as long as channel support (now at 1.3157) holds. Sustained break of 1.3793 will pave the way to retest 1.4689 (2015 high). Firm break of the channel support should confirm reversal target 1.2061 low again.
AUD/USD Daily Outlook
Daily Pivots: (S1) 0.7066; (P) 0.7082; (R1) 0.7102; More...
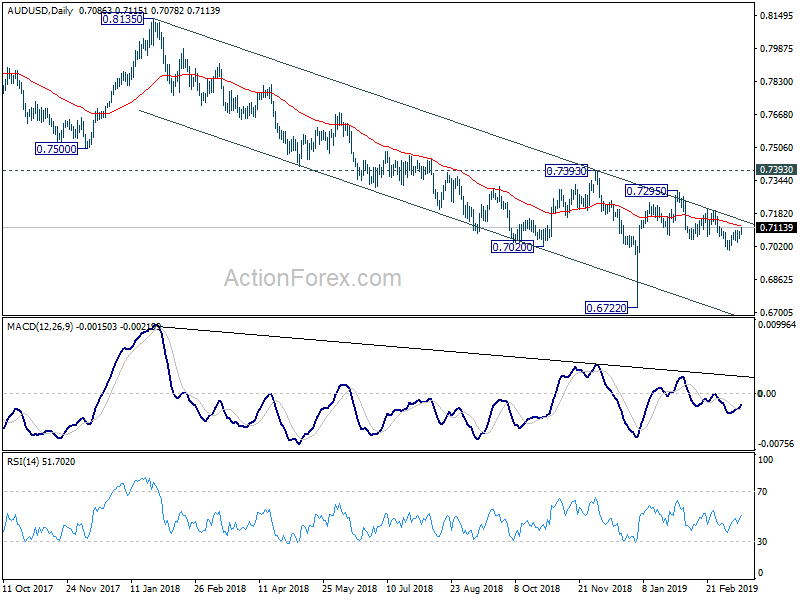
AUD/USD rises strongly today and focus is now on 0.7121 minor resistance. Firm break there will argue that decline from 0.7295 has completed at 0.7003. In that case, further rise should be seen to 0.7206 resistance to confirm. More importantly, in that case, corrective three wave structure of the fall fro 0.7296 to 0.7003 would suggest that rise from 0.6722 low is extending through 0.7295. On the downside, though, break of 0.7003 will extend the fall from 0.7295 to 61.8% retracement of 0.6722 to 0.7295 at 0.6941 and below.
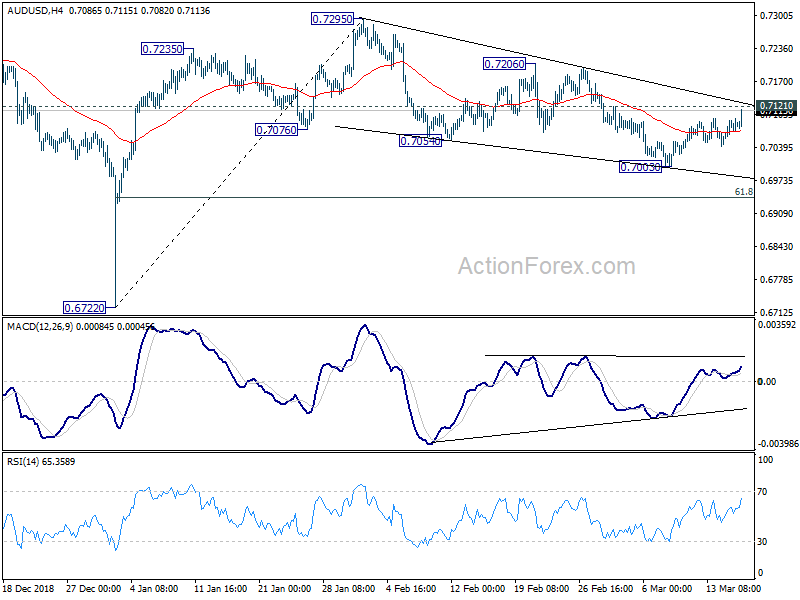
In the bigger picture, as long as 0.7393 resistance holds, we'd treat fall from 0.8135 as resuming long term down trend from 1.1079 (2011 high). Decisive break of 0.6826 (2016 low) will confirm this bearish view and resume the down trend to 0.6008 (2008 low). However, firm break of 0.7393 will argue that fall from 0.8135 has completed. And corrective pattern from 0.6826 has started the third leg, targeting 0.8135 again.