

Sample Category Title
Slowdown in China Remains Pronounced Even After Adjusting for Seasonal Factors
China released its latest macroeconomic data for the first two months of the year. Due to Lunar New Year holiday, the January figures for retail sales, industrial production and fixed asset investment were not released. Despite signs of improvement, the set of data, together with inflation and trade reports released last week, affirmed slowdown in the country’s growth outlook. This also explains the urgency of stimulus measures announced at the National People’s Congress last week.
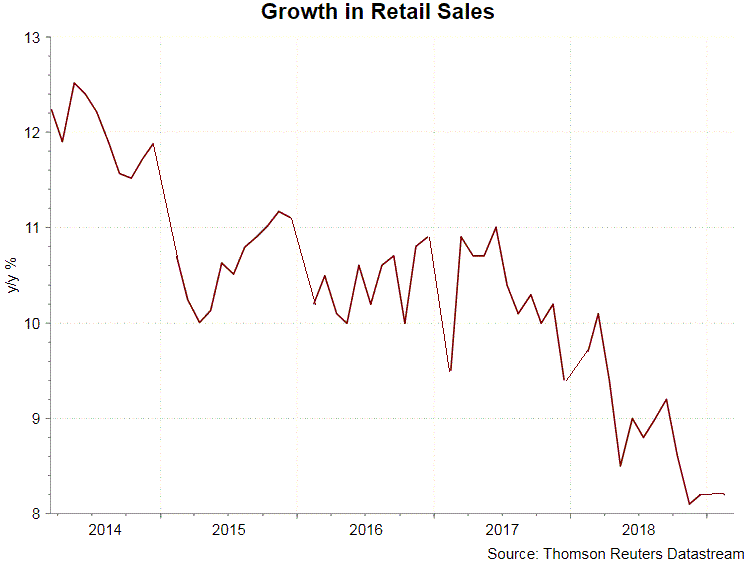
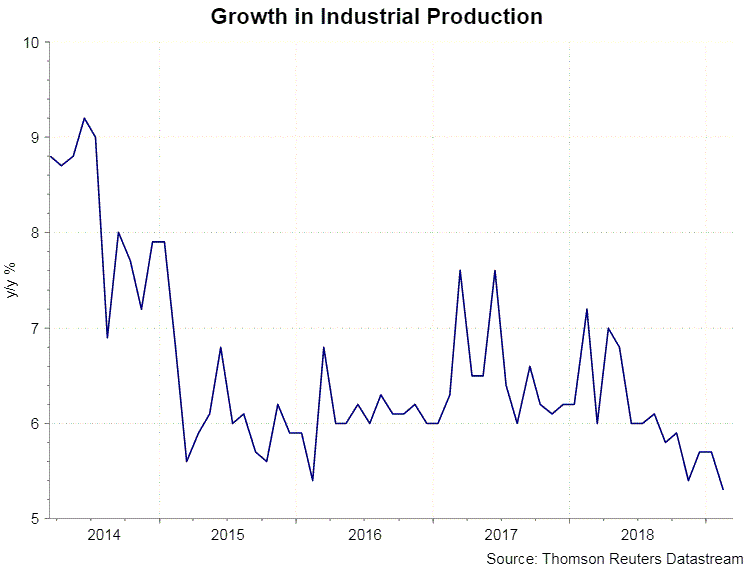
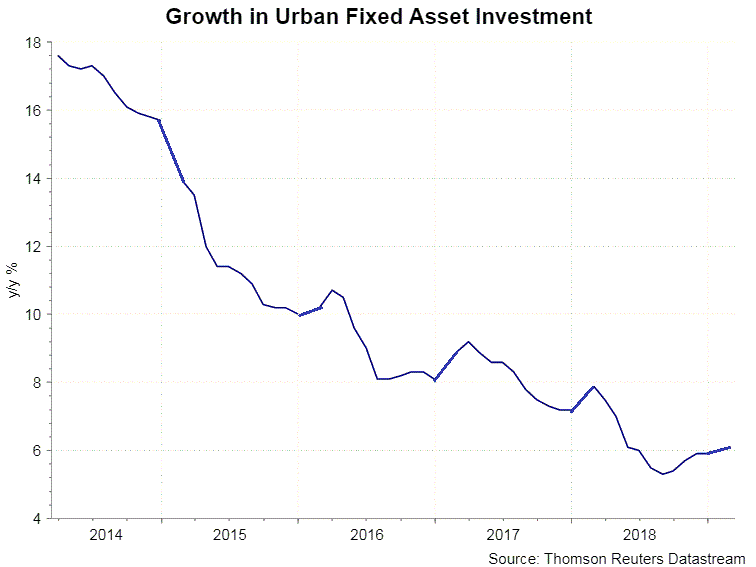
Retail sales grew +8.2% y/y in the first two months of the year, unchanged from December and higher than consensus of +8.1%. growth in industrial production fell to +5.3% y/y, compared with consensus of +5.55 and December’s +5.7%. Moreover, urban fixed asset investment increased +6.1% y/y, beating consensus of +65 and December’s +5.9%.
Inflation
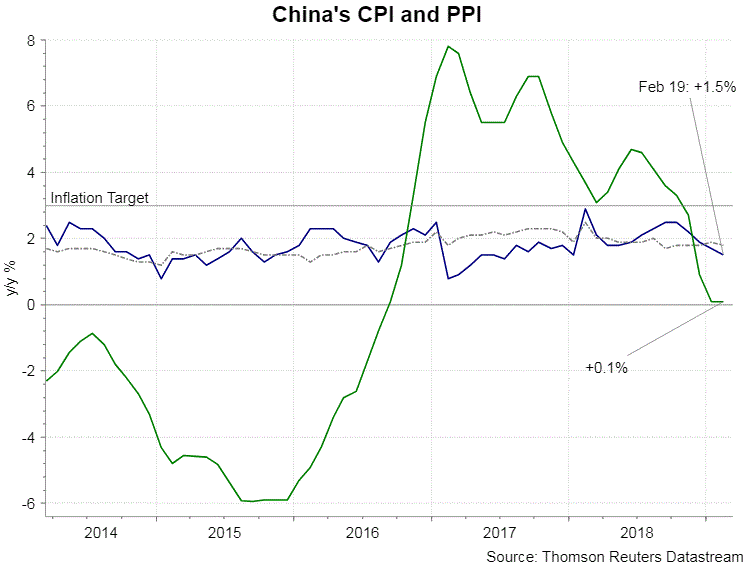
Falling for four months in a row, headline CPI eased to +1.5% y/y in February from +1.7% a month ago. Excluding food prices, inflation stayed unchanged at +1.7% for the month, signaling that the general price level was dragged by food prices. Indeed, food prices grew only +0.7%, significantly lower than January’s +1.9%. Adjusting the distortion driven by Lunar New Year holiday, inflation in the first two months of the year was at +1.6%, easing from +2.2% during the same period last year. Food prices was at +1.3%, compared with +1.9% in the same period last year. PPI stayed unchanged at +0.1%, missing consensus of +0.2% as raw material prices remained in deflation.
Trade
China’s trade surplus narrowed significantly to US$ 4.1B in February. For the first two months of this year, trade surplus was US$ 43.3B, down from US$ 50.6B in the same period last year. This evidenced the slowdown in international trade even after partly excluding seasonal factors. Both imports and exports declined from a year ago. Imports dropped -5.2% while exports plunged -20.7%. For the first two years in 2019, exports and imports fell -4.6% and 3.1%, respectively, after rising +9.9% and +15.8% respectively last year. Country-wise, exports to the US remained weak, plunging -14% in the first two months of the year. Shipments to other countries also softened, as a result of global economic slowdown. For instance, exports to Japan and Hong Kong dropped -1.1 and +10.6%, respectively. Growth in shipments to the ASEAN moderated sharply to +2% for the period of January and February, compared with +12.5% in January. Similarly, exports to EU climbed slightly higher, by +2.4% during the period, compared with a +15.3% expansion in January. Weakness in imports evidenced the decline in domestic demand. The downtrend would likely continue in coming months, as China’s growth decelerates despite the government’s stimulus measures.
Government Policy
At the National People’s Congress (NPC) held last week, the government revised the GDP growth target to 6-6.5% for 2019. This was widely expected by the market. In order to cope with the slowdown, the government announced loosening measures in both fiscal and monetary policies. It pledged to adopt a "proactive, stronger, and more effective” fiscal policy, raising the budget fiscal deficit to 2.8% of GDP for this year, from 2.6% in 2018. Much of the fiscal easing would come from reduction in corporate tax and social insurance contribution (up to RMB 2 trillion). Meanwhile, the monetary policy would be "prudent". With the term "neutral" again disappeared, it is obvious that the measures are tilted to the easing side. We expect RRR cut and reverse report to remain the major tools adopted by PBOC. Yet, the chance of rate cut is increasing as the growth outlook decelerates and expectations of Fed funds rate hike diminishes.
Trump in no rush to complete trade deal with China, still expecting a summit with Xi
Trump insisted that the trade negotiations with China is "going along well". But he told reports at the White House that ""I'm in no rush. I want the deal to be right. ... I am not in a rush whatsoever. It's got to be the right deal. It's got to be a good deal for us and if it's not, we're not going to make that deal."
At the same time, Trump also acknowledged that Xi may be wary of going to a summit in the US without an agreement in hand. He said "I think President Xi saw that I'm somebody that believes in walking when the deal is not done, and you know there's always a chance it could happen and he probably wouldn't want that,"
Though, he's still expecting a meeting with Chinese President Xi Jinping but "we'll just see what the date is". He is also open to complete the trade agreement before or after the summit. He added that "we could do it either way. We could have the deal completed and come and sign, or we could get the deal almost completed and negotiate some of the final points. I would prefer that."
For now, Beijing made no reference to a Trump-Xi summit at the Mar-a-Lago Such summit is unlikely to happen this month. Tariffs imposed from both sides since last year are continuing to drag on the global economy with no end in sight. And there is nothing done that stops China from IP theft, forced technology transfer and market distortion through state-owned enterprises.
Australian Dollar: Steady for Now, But to Go Below USD 0.70 in the Second Half of 2019
Growth and interest rate differentials to weigh on AUD in time.
It has been an eventful month for the Australian economy, with GDP and other key data surprising to the downside, and interest rate expectations shifting. Regardless, at USD0.7094, the Australian dollar is unchanged from USD0.7093 when our February Market Outlook went to print, having held a fairly tight range of USD0.7009 to USD0.7183 since.
The detail of the December National Accounts is laid out on page 8 of our March Market Outlook. With respect to the currency, all that needs to be stated is that from a 4% annualised pace in the first half of 2018, GDP growth slowed to just 1% annualised in the second. On the back of this dramatic deceleration, and given our concerns around the effect of declining house prices and soft household income growth on consumption, we look for growth to remain materially below trend at 2.2%yr in both 2019 and 2020. Versus the US, relative growth comparisons will then remain a material headwind for the Australian dollar over the forecast period.
A consequence of Australia’s weak economic growth and the skew of global risks is a need for further monetary policy easing by the RBA. We believe this is most likely to take the form of two 25bp cash rate cuts in 2019 – the first delivered in August, the second come November.
If we are also correct in forecasting one final rate hike for this cycle from the US FOMC, then by end-2019, the policy rate differential between Australia and the US would stretch to –163bps – a highly-abnormal spread versus history. Albeit at the whim of the market, such a policy outturn should also see the Australia/US 10-year yield spread widen from around –60bps currently to nearer –90bps through mid-2019, after which it will likely remain historically wide as both the RBA and FOMC go on hold in 2020 (a spread of –65bps is expected at end-2020).
Against the scale of the above Australia/ US differentials for growth and interest rates, our forecast for around a 4% decline in the Australian dollar to USD0.68 in the second half of 2019 appears modest. The justification for maintaining this forecast is two-fold: (1) key commodity prices continue to hold up better than anticipated; and (2) demand for Australian assets from foreign investors remains very strong.
For Australia, iron ore and coal prices remain key. Over the past year, both markets have seen significant supply disruptions and a seeming unwillingness (or inability) of producers to quickly offset the production loss. Coupled with ongoing structural reform (which preferences high-quality inputs) and strengthening construction-related demand for steel in China, impaired supply has resulted in elevated price levels for both iron ore and metallurgical coal, respectively US$87/t and US$183/t. In terms of the expected return for miners from current production and broader sentiment for the Australian dollar, this is a clear positive.
While we anticipate a pull-back in prices through 2019 and 2020 (to US$75/t end-2019 and US$65/t end-2020 for iron ore; and to US$150/t end-2019 and US$135/t end-2020 for metallurgical coal), the pace of decline will be measured as supply takes time to correct. For Australian dollar demand, it also seems probable that some of this decline in unit prices will be offset by higher volumes over the forecast horizon. All of this considered, we believe the Australian dollar will gradually edge back up from USD0.68 end-2019 to USD0.70 at end-2020.
Extending our analysis from trade receipt flows to investment/capital flows, it becomes apparent that the Australian dollar will likely receive additional support in the near term. In recent months, Australian resource companies have actioned a number of capital management strategies to return excess cash to investors, ahead of potential changes to franking credit rules after the coming Federal election and given a limited need for capital for capacity expansion. As a large portion of the share registers of these firms are domiciled in Australia, this has provided persistent support for the Australian dollar which could last to the end of FY2019.
More broadly, as at December 2018, it was evident from the ABS Balance of Payments release that foreign investor demand for Australian assets remains very strong. Of particular note, direct investment flows (defined as a 10%+ stake in a company) amounted to $76bn in 2018, almost one and a half times the seven-year average back to 2011 – already a historically strong period for direct investment flows. Whereas during the mining investment boom, direct capital was used to fund new real economy investment, currently it is more a result of foreign investors’ desire for existing income-yielding assets in Australia. This demand is also evident in portfolio inflows into Australian debt securities, which at $74bn was also robust in 2018.
While support from these yield-seeking flows will persist, given the global backdrop and Australia’s growth outlook, it seems inevitable that they will moderate hence. Ergo, the ability for the Australian dollar to maintain or exceed the USD0.70 figure is only likely to remain until mid-2019 after which the above growth; interest rate; and commodity dynamics will re-assert.
Daily Markets Broadcast
Wall Street extends gains on trade hopes
Wall Street rallied yesterday after US President Trump said he was flexible on a summit with China’s leadership, open to delaying the event until a deal had been struck. The NAS100 index touched a 5-month high. UK lawmakers voted against exiting Europe with no Brexit deal in place.
NAS100USD Daily Chart
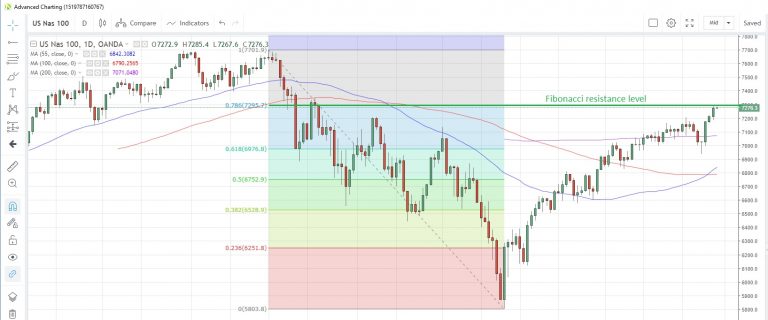
The NAS100 index rose for a fourth consecutive day yesterday, touching the highest since October 17. That’s the longest winning streak since early-January
The index tested the 78.6% Fibonacci retracement of the October-December drop at 7,297.7. At current levels, the index is facing its biggest weekly gain since November last year
January’s new home sales are expected to fall 0.9% from a month earlier, according to latest surveys. That would be the weakest print in three months.
DE30EUR Daily Chart
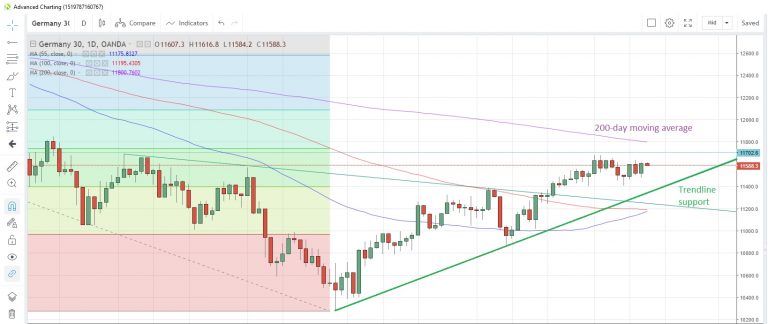
The Germany30 index rose yesterday following better-than-expected economic data while also riding on the coat tails of Wall Street’s gains
The index is still sandwiched between resistance at the 200-day moving average at 11,800 and rising trendline support near 11,355
Euro-zone industrial production rose 1.4%m/m in January, beating economists’ estimates of a 1.0% gain. German consumer prices are seen rising 0.5% m/m in February, the same pace as January.
WTICOUSD Daily Chart
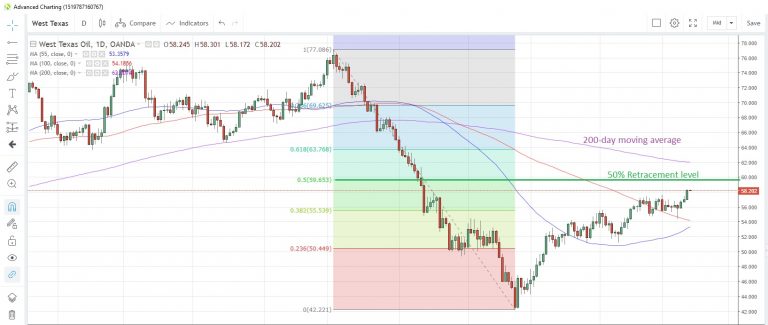
Crude oil prices advanced to the highest in four months yesterday after data showed a surprise drawdown on inventories in the week to March 8
Prices regained the $58 handle for the first time since November 16. The 100-week moving average is at $58.38 while the 50% retracement level of the October-December drop is at $59.653
Data from EIA showed oil stockpiles falling by 3.86 million barrels in the week to March 8. This echoes Tuesday’s numbers from API to March 4, which saw a drawdown of 2.58 million barrels.
Aussie Softens As China Production Slows
Output at 17-year low
China's industrial output rose 5.3% y/y in January, the weakest expansion in 17 years, according to data released this morning. The increase was below economists' expectations of +5.5% and lower than December's expansion. Retail sales kept pace with December's increase, rising 8.2% from a year earlier and beating analysts' forecasts of 8.1% growth.
Investment picked up speed however, with fixed asset investment rising 6.1% year-to-date on an annual basis as the government fast-tracked more road and rail projects, according to Reuters.
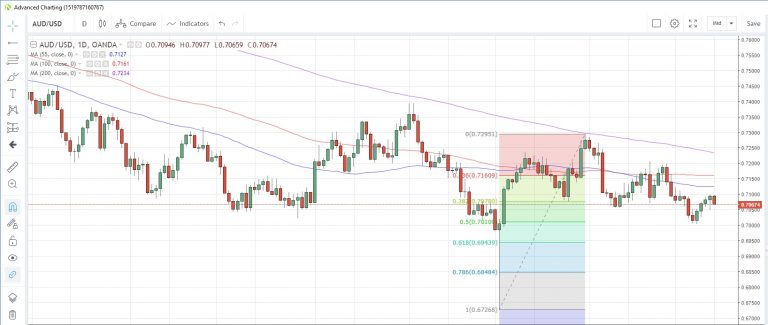
The data on a whole was seen as slightly disappointing, with AUD/USD edging lower to 0.7068 but there was no follow through. The Dollar Index, which computes the value of the US dollar against six major currencies staged a mild rebound, the first gains in five days. USD/JPY rose to 111.47 as stock indices traded mostly in the black, adding on the last night's gains on Wall Street.
AUD/USD Daily Chart
Pound retreats in waiting mode
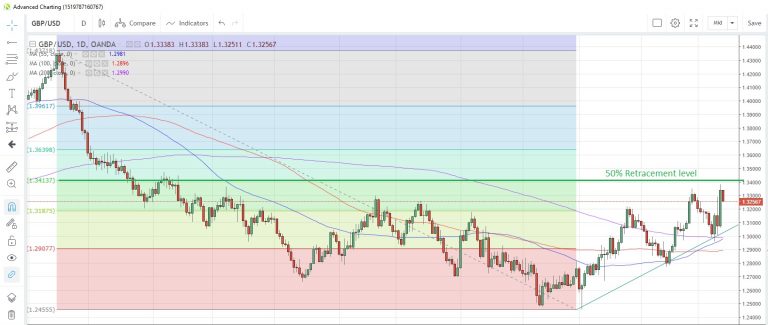
The Pound gave back some of the gains made after UK lawmakers voted yesterday against leaving the EU without a deal in place. GBP/USD reached as high as 1.3383 yesterday, its highest since June 14 last year but has since retreated to 1.3264. Tonight Parliament votes on whether to request an extension to the Article50 deadline. Should lawmakers vote in favour, such a request would still require the EU's agreement, no doubt with some tough conditions attached. Worst case scenario? The conditions are too demanding and the UK leaves either with an inferior, (even more-) rushed deal or with no deal at all. Either way, GBP could be in for a roller-coaster ride.
GBP/USD Daily Chart
New home sales seen weaker
There's not much on the data calendar today, with the UK Parliamentary vote grabbing the spotlight. Germany's consumer prices are seen steady at +0.5% m/m and +1.6% y/y in February while US new home sales are expected to fall 0.9% from a month earlier in January.
UK passed non binding vote to reject no-deal Brexit
Sterling spiked higher after UK Commons passed yesterday a non-binding motion to reject no-deal Brexit under any circumstances. But the Pound quickly retreated again as focus will turn to vote today on whether to ask the EU for Article 50 extension. Also, question is on whether there would be a short extension of a long extension.
The final motion was voted for by 321 to 278, a majority of 43. The motion reads: "This House rejects the United Kingdom leaving the European Union without a Withdrawal Agreement and a Framework for the Future Relationship".
The original motion was changed after the Spelman/Dromey amendment was narrowly passed by 312 to 308, just a mere majority of 4. The original motion reads: "This House declines to approve leaving the European Union without a Withdrawal Agreement and a Framework for the Future Relationship on 29 March 2019; and notes that leaving without a deal remains the default in UK and EU law unless this House and the EU ratify an agreement."
Prime Minister Theresa May, however insisted that the votes do not change the fundamental problem. And the only way to rule out no-deal is to vote for a deal. She also warned that if MPs do not vote for a Brexit deal soon, she will have to seek a long article 50 extension, which would mean the UK having to take party in the European elections.
A European Commission spokesperson quickly responded:: "There are only two ways to leave the EU: with or without a deal. The EU is prepared for both. To take no deal off the table, it is not enough to vote against no deal - you have to agree to a deal. We have agreed a deal with the prime minister and the EU is ready to sign it."
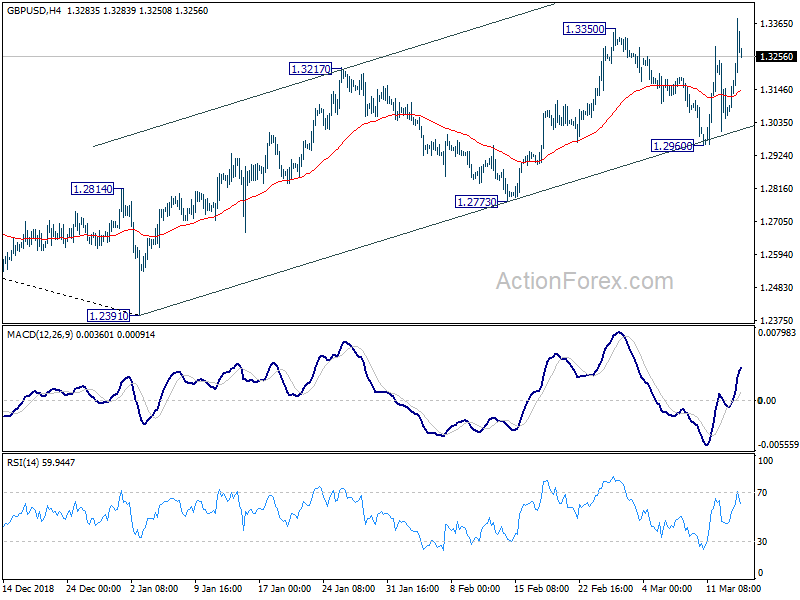
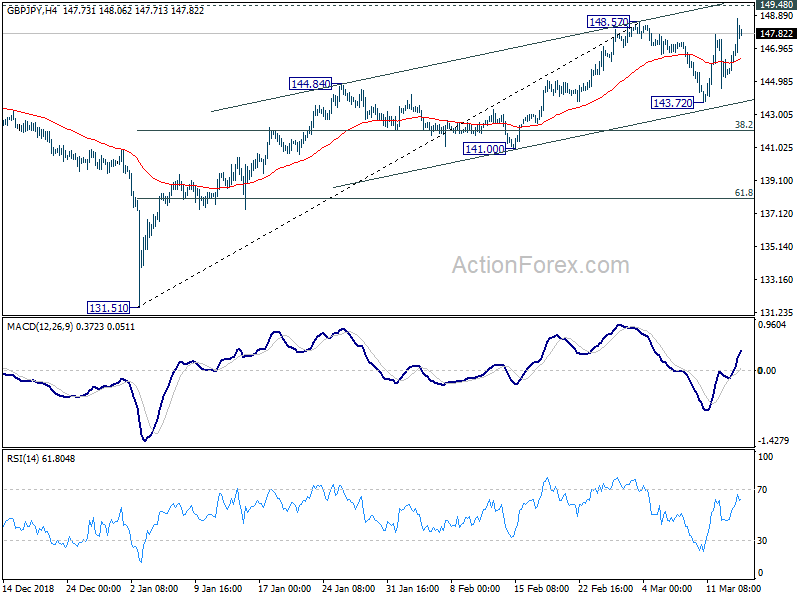
GBP breached recent resistance briefly but settles back in established range quickly.
Market Morning Briefing: Dollar-Index Has Immediate Support At 96.25
STOCKS
Indian indices continue to trade strong and outperform the global equities. The Sensex and the Nifty 50 remains bullish and can move further higher. Dow is testing a key resistance and DAX can remain sideways with a bullish bias. Shanghai remains vulnerable for further fall.
Dow Jones (25,702.89, +148.23, +0.58%) tested the 21-day moving average resistance at 25,772 yesterday. A decisive break above this resistance can take the Dow higher to 25,900 and 26,000. On the other hand, support is at 25,500 which if broken can increase the downside pressure and drag the index to 25,100.
DAX (11,572.41, +48.24, +0.42%) is mixed and can remain range bound between 11,400 and 11,650for some time. The bias within this range is bullish to see a break above 11,650 and target 11,800.
Nikkei (21,431.28, +141.04, +0.66%) seems to be getting support from the 100-day moving average at 21,307. As long as it sustains above this support, a rise to 21,600 is possible in the near term. But a decisive close below 21,300 will increase the possibility of a fall to 21,000.
Shanghai (3,006.89, -20.06, -0.66%) is moving lower as expected and is heading to test the psychological level of 3,000. As mentioned yesterday, the index can break below 3,000 and test 2,970 and 2,950 in the coming days.
Sensex (37,752.17, +216.51, +0.58%) and Nifty 50 (11,341.70, +40.50, +0.36%) have surged further and are keeping the bullish view intact. Sensex has a support at 37,570. The index can move further higher to 37,930 and 38,050. Support for the Nifty 50 is at 11,290 while above which a test of 11,400 and 11,450 can be seen in the coming days.
COMMODITIES
Gold and Silver has hit a resistance and can dip in the near term while copper looks relatively positive for a rise in the near term. Declining inventories have pushed oil prices higher and has opened doors to see further rise it the coming days.
Gold (1306) and Silver (15.42) moved higher yesterday as expected to test 1310 and 15.5 respectively, but has come-off thereafter. A dip to 1300 is possible and gold can consolidate between 1300-1310 for some time. A strong break above the 1310-1315 resistance cluster is needed for to gold to move further higher. Silver can dip to 15.3 while below 15.5.
Copper (2.93) can inch higher to test 2.95 again. The bias is positive for it to break 2.95 and rise to 2.97 and 2.98 in the near term.
The dip to 66-65.7 on Brent (67.65) mentioned yesterday did not happen. Instead Brent has risen decisively above 67. The price action indicates that Brent is gearing up to break the 64-68 range above 68 and rally to 70 soon.
WTI (58.3) has broken above the key resistance at 58. While above 58, the outlook is bullish for a test of 59.5 and 60.3.
FOREX
The UK parliament is set to vote on whether it would extend the Brexit deadline on 29th Mar’19. While no-deal Brexit looms Pound is seen to weaken against the Dollar. Technically, 1.33 is an important level which could keep the Pound (1.3270) lower for the coming sessions, pushing it towards 1.30 again. But if the Pound manages to break above 1.33, we could see upper resistances of 1.34 and 1.35 coming into the picture that could help Pound to again come down in the medium term.
We think that Dollar-Rupee (69.5350) can trend lower, both because of its trajectory on the charts as well as in reaction to the $5 bln buy/sell swap announced by RBI yesterday (view RBI statement at: https://rbi.org.in/Scripts/BS_PressReleaseDisplay.aspx?prid=46542 ) , apart from the prospect of more FPI inflows being lined up. However, there are different views on this in the market. As a resolution, we come back to the same point: Overall trend remains bearish while below 69.80. Our view of immediate fall towards 69.25-69.00 remains intact for the near term.
Dollar-Index (96.56) has immediate support at 96.25 and while that holds, a bounce is possible towards 97.25 again. Break below support at 96.25, if seen would open up chances of sharp fall towards 95.75-95.25 but that seems less likely while the index trades above 96.25. Watch price action near 96.25.
Euro (1.1325) could face immediate resistance near 1.1350/60 and higher at 1.14. While the near term could see a short upmove, we expect an eventual fall in Euro back towards 1.130-1.125 in the medium term.
Euro-Yen (126.21) has risen in line with our expectations. It could rise further towards 126.80-127.00 in the near term from where a rejection could be expected pushing the pair back towards 126-125 levels.
Dollar Yen (111.46) is stuck above 111 trading in a very narrow and small range for the least few sessions. While above 111, there is scope of rising towards 112.0-112.5 but lacks momentum just now.
Aussie (0.7071) has resistance near 0.71-0.7150 from where a decent fall could be seen soon. Overall trade within 0.70-0.7150 is likely in the next 1-2 weeks.
USDCNY (6.7085) has been stable for the last 2-sessions. While daily resistance at 6.72 holds, Yuan is likely to strengthen towards 6.68/67 in the near term.
INTEREST RATES
The US yields have bounced slightly. The 5Yr (2.44%), 10Yr (2.63%) and 30Yr (3.02%) have bounced by 1bps. While there is room for the 30YR to test 2.95% and the 10Yr and 5YR to test 2.6% and 2.4% respectively, if the current bounce sustains, the yields could start rising from here itself back to higher levels.
The UK-US 10YR (-1.43%) is trading at near term resistance which if holds could push the spread back towards -1.45% or lower in the near term. Fall in the spread would indicate near term weakness in Pound.
The RBI announced yesterday that it will do $5 bln 3-year buy/sell swap on 26th March, on an auction basis, for infusion of Rupee liquidity.
This could lead to (a) a dip in USDINR Forward Premia, especially at the far end and (b) a steepening on the Indian yield curve, as money market rates might dip while bond yields might move up a bit, IN CASE the RBI reduces OMO bond purchases to the same/ similar extent.
EUR/GBP Could Resume Slide Below 0.8530
Key Highlights
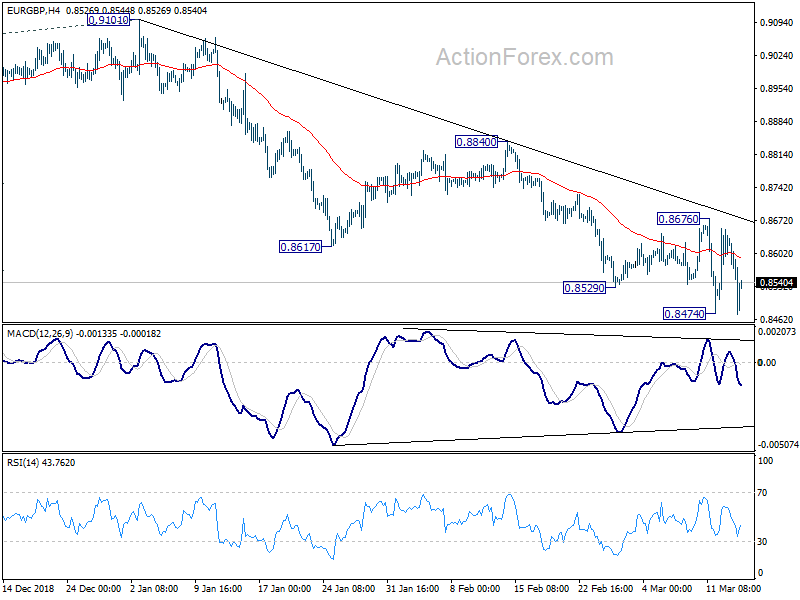
- The Euro recovered recently, but failed to clear the 0.8650 resistance against the British Pound.
- A crucial bearish trend line is formed with resistance at 0.8620 on the 4-hour chart of EUR/GBP.
- The US Durable Goods Orders increased 0.4% in Jan 2019, better than the -0.5% forecast.
- The German CPI for Feb 2019 will be released today, which could increase 0.5% (MoM).
EURGBP Technical Analysis
The Euro started a solid rebound after trading as low as 0.8474 against the British Pound. The EUR/GBP pair climbed above the 0.8600 resistance, but it failed to gain strength above 0.8650.
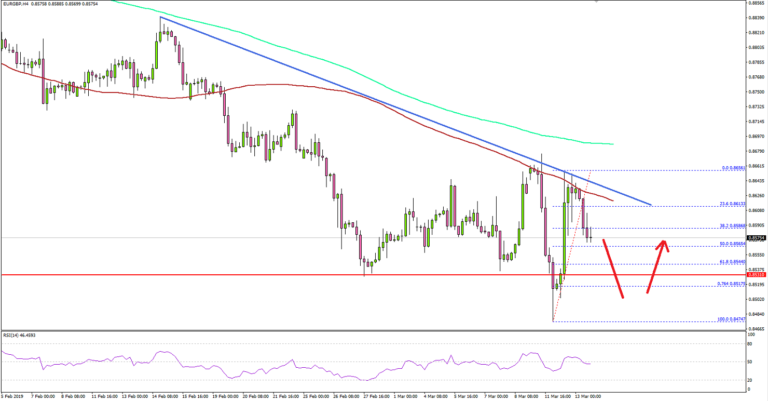
Looking at the 4-hours chart, the pair struggled on two occasions near the 0.8650-0.8660 resistance area. Besides, the 100 simple moving average (red, 4-hours) also acted as a strong resistance near the 0.8650 level.
More importantly, there is a crucial bearish trend line formed with resistance at 0.8620 on the same chart. The recent high was formed near the 0.8656 level and the pair declined below the 38.2% Fib retracement level of the last wave from the 0.8474 low to 0.8656 high.
The current price action is bearish, suggesting more losses in EUR/GBP as long as the pair is below 0.8650 and 0.8660. A successful close above 0.8660 could open the doors for an acceleration to 0.8700.
On the downside, the main support is at 0.8530, below which the pair will likely decline below 0.8500 and 0.8480 in the near term.
Fundamentally, the US Durable Goods Orders report for Jan 2019 was released by the US Census Bureau. The market was looking for a 0.5% decline in orders in Jan 2019, compared with the last +1.2%.
The result was better than the forecast as there was an increase of 0.4% in the US Durable Goods Orders. Besides, the last reading was revised up from +1.2% to +1.3%. On the other hand, the US Durable Goods Orders ex Transportation declined 0.1%, whereas the market was looking for a 0.1% rise.
The report added that:
Excluding defense, new orders increased 0.7 percent. Transportation equipment, up five of the last six months, drove the increase, $1.0 billion or 1.2 percent to $90.9 billion.
The US Dollar failed to gain traction after the release and pairs such as EUR/GBP, GBP/USD and AUD/USD rebounded nicely, with a bullish angle.
Economic Releases to Watch Today
- German Consumer Price Index for Feb 2019 (YoY) – Forecast +1.6%, versus +1.6% previous.
- German Consumer Price Index for Feb 2019 (MoM) – Forecast +0.5%, versus +0.5% previous.
- US Import Price Index Feb 2019 (MoM) – Forecast +0.3%, versus -0.5% previous.
- US Export Price Index Feb 2019 (MoM) – Forecast +0.1%, versus -0.6% previous.
- US Initial Jobless Claims – Forecast 225K, versus 223K previous.
Eco Data 3/14/19
[php_everywhere instance="1"]
Self-Sabotage Revealed
In my peak performance training with traders, I give a strong psychological slant to the concept of self-sabotage. Self-sabotage typically occurs when one lacks the discipline to act in one's own best interest. For example, when you have dessert, knowing it's taboo because you are trying get healthy, you might call that self-sabotage. Or perhaps you know you need to exercise and you really feel good when you do so, but somehow you just feel lazy and want to skip the exercise period. Self-sabotage occurs in trading in many instances:
- When you know you should follow the ten tasks of trading, but you don't.
- When you know you need to determine if your system will really work, but you just trade it anyway.
- When you know you should develop a business plan for your trading, but somehow that just seems like too much work.
- When you know you need to put a stop loss order in on a trade, but you don't.
These and numerous other examples characterize self-sabotage. And these examples of self-sabotage typically occur when you have internal conflict between various parts of yourself and when emotions pop up that result in behavior that is not in your best interest and when you just avoid doing what's important for success.
Many traders, however, avoid thinking about self-sabotage in this manner because they don't like to go inside of themselves to see what is going on. They prefer to think technically about systems rather than notice what their beliefs are and whether or not they are useful. As a result of this tendency, I've developed another definition of self-sabotage that everyone can relate to: repeating the same mistake multiple times.
My definition of a mistake is when you don't follow your rules. And if you don't have rules, then everything you do is a mistake. And self-sabotage occurs when you keep repeating the same mistakes over and over and over again.
For example, you don't raise your stop when the market makes a new high. When you skip it once, and your rules say you must do it, then it's a mistake. When you do it three times in the same week, then it is self-sabotage. When you develop this attitude, can start keeping track of your mistakes and see how much they cost you.
For example, suppose you are about to be stopped out for a 1R loss. (The definition of a 1R loss and R-multiples in general is explained in my book Trade Your Way to Financial Freedom and there is a brief description in my Tharp Concepts section of the website.) You don't want to be stopped out, however, so you cancel the stop – which is your mistake. The position keeps going down and eventually you get out with a 3R loss. That mistake cost you 2R (i.e., instead of a 1R loss you got a 3R loss).
Now suppose you have a system that makes you 100% per year. However, you make a 2R mistake each week. At the end of the year, instead of being up 100%, you have lost money just because of your mistakes. Now can you begin to understand how trading reflects your behavior and that one of the critical things that you must do as a trader is to eliminate mistakes.