Sample Category Title
WTI Oil: Oil Price Rises Nearly 4%, Key Barriers Under Pressure
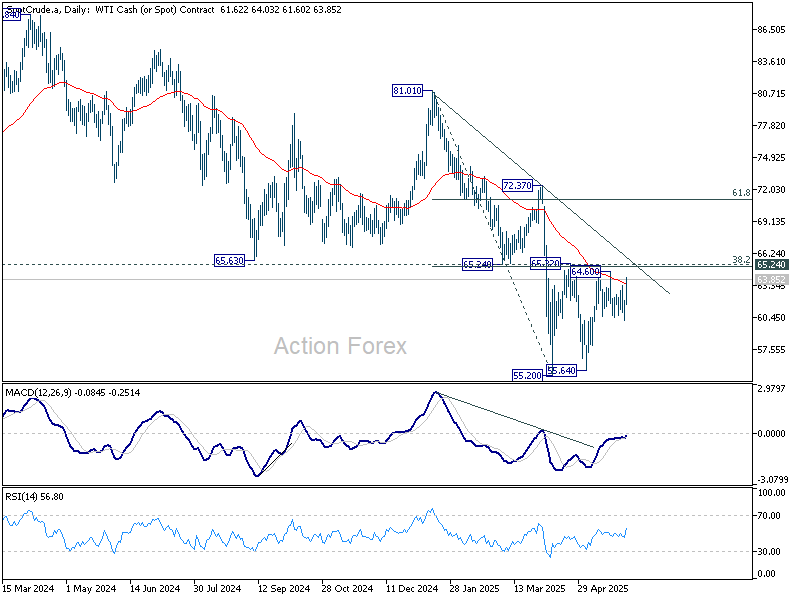
WTI oil price jumped around 3.7% and hit the highest in almost two weeks on Monday, on track for the biggest daily gain since April 9.
Fresh advance penetrated daily cloud (spanned between $62.83 and $63.92) and cracked psychological $63.00 level.
Near term focus shifts to key resistances at $63.92 /$64.03 (cloud top / ceiling of recent four-week congestion) break of which to generate stronger bullish signal for continuation of recovery from $55.14 (May 5 low).
Technical picture on daily chart is improving, as momentum studies are turning positive and daily Tenkan/Kijun-sen are in bullish configuration and below the price, but more work at the upside is still required to further firm the structure.
Sustained break of pivotal $64.00 zone to expose targets at $64.70 (April 23 top) and $65.00 (psychological).
Hourly higher base at $61.68 offers solid support which should contain dips and guard $61.34 (broken Fibo 38.2% of $71.98/$54.77, reinforced by 10DMA),
Res: 63.14; 63.38; 64.03; 64.70.
Sup: 62.24; 62.00; 61.68; 61.34.
Sunset Market Commentary
Markets
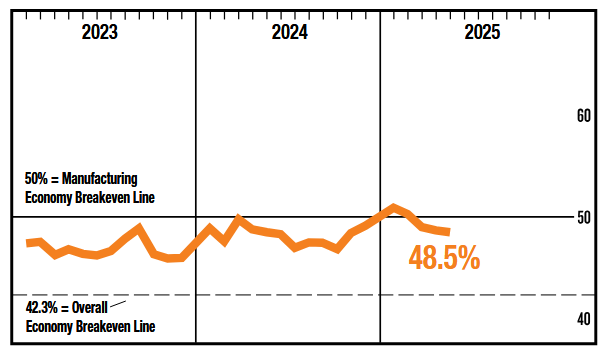
Investor reluctance towards US assets still proves the path of least resistance, as US president Trump warned on higher tariffs for steel (and aluminum) and as US-China trade talks apparently hit a roadblock causing mutual allegations. US equities, bonds and the dollar are all trading in red. Admittedly, losses remain orderly and the move also spills over to other (equity) markets, including Europe (EuroStoxx 50 -0.5%). Other core bonds (Bunds, gilts, Japanese bonds) also show more or less similar losses today. However, especially German Bund levels don’t trade at ‘near stress levels’ like their US counterparts. In this move the currency remains the key discriminating factor. USD weakness remains a by default means for investors to give their appreciation on the unpredictable swings in the Trump administration’s trade policy. In addition to the trade war and the risks it might cause for the US economy; markets are also pondering the idea of the trade war potentially turning into a capital market war. In its proposed Budget Bill; the Trump administration also included an item ‘ Enforcement of Remedies against unfair foreign taxes’ (Section 899). This might include additional taxing on foreign investors of countries that the administration deems to have discriminatory tax policies (e.g. a digital services tax on major US tech companies, minimum corporate taxes etc). The jury is still out whether and how such a measures might be implemented, but it adds another layer of uncertainty for investing in US assets whatsoever. In the run-up to publication of the US manufacturing ISM, US yields add between 3 bps (2-y) and 4 bps (30-y, 4.97%) with the 5% barrier again within reach. German yields add between 2.5 bps (2-y) and 3.5 bps (30-y). Aside from spillovers from the US, tomorrow’s EMU flash CPI and Thursday’s ECB meeting are a good reason for markets not to push further beyond ‘rich’ ECB easing that is currently discounted (ECB cycle low <1.75%). On FX markets, DXY is testing last week’s low near 98.7, the final ‘hurdle’ on the way back to the 97.92 YTD low. EUR/USD in a similar way is challenging the 1.1418 resistance. with the YTD top at 1.1573. The gain of Conservative candidate Nawrocki in the Polish presidential election doesn’t help a unified European approach to geopolitical challenges. Even so, for now the outcome only has a (modestly) negative impact on the zloty (EUR/PLN 4.2675), not on the euro. Still, in this context of USD weakness, the yen outperforms the euro (USD/JPY 143 from 144.0, EUR/JPY 163.2 from 163.4). At the time of finishing this report, the US Manufacturing ISM prints at a weaker than expected 48.5 (from 48.7). Employment also remains in contraction territory at 47.6 (from 47.2). At the same time, price pressures remain elevated with prices paid holding at 69.4 from 69.8. In a first reaction, equities and the dollar declines accelerate. Yields ease off the intraday highs, but stay in positive territory.
News & Views
Swiss GDP growth adjusted for sporting events accelerated from a strong 0.6% Q/Q pace in Q4 2024 to an even better 0.8% Q/Q in Q1 2025. That’s an upward revision from the previously reported 0.7%. The demand-side breakdown showed moderate growth in private consumption (+0.2%) supported particularly by expenses on health and housing. Investments in equipment and software rose by 0.4% Q/Q with construction investment 0.8% higher. Government spending rose by 0.4% as well. The production view showed that the services sector delivered broad-based growth. The chemical and pharmaceutical industry also expanded at an above-average rate (+7.5% Q/Q). Value added in other industrial sectors continued to fall. Overall, this resulted in strong growth for manufacturing (+2.1%) and goods exports (+5%). In particular, exports to the US rose sharply, pointing to possible front-loading in connection with US trade policy. The Swiss franc (EUR/CHF 0.9345) is unmoved by today’s numbers.
The Czech manufacturing PMI slipped again in May, from 48.9 to 48. Consensus hoped for a modest improvement to 49.3. The overall downturn worsened amid a faster fall in output levels and a renewed drop in new orders. Weak demand conditions and client uncertainty reportedly drove the decrease in new sales. Moreover, firms remained in retrenchment mode, as input buying and employment contracted again. Renewed delays to supplier delivery times amid shortages put pressure on capacity. Firms remained upbeat in the year-ahead outlook for output, however, as confidence rose to the highest in over three years. At the same time, inflationary pressures built as input costs (material shortages and higher energy bills) and output charges rose at faster, but still historically soft, rates. EUR/CZK is marginally lower on the day at 24.90.
US manufacturing remains subdued as ISM PMI falls to 48.5
US ISM Manufacturing PMI edged down to 48.5 in May from 48.7, falling short of expectations and marking the lowest reading since November. This marks the third straight month of contraction, with underlying components still signaling broad-based weakness.
New orders and production remained in negative territory, at 47.6 and 45.4 respectively, suggesting that demand conditions are still under pressure. Employment also stayed weak at 46.8, contracting for a fourth straight month.
Prices Index slipped marginally to 69.4 from 69.8, but remains elevated. Over the last six months, price pressures have surged by over 19 points, bringing the index to its highest readings since mid-2022.
The external sector delivered particularly concerning signals, with new export orders plunging to 40.1, the lowest level since the pandemic and, excluding COVID-19, the weakest since the Great Recession. Imports also collapsed, down sharply to 39.9.
Despite the weak headline number, ISM noted that the PMI reading still corresponds to roughly +1.7% real GDP growth on an annualized basis.
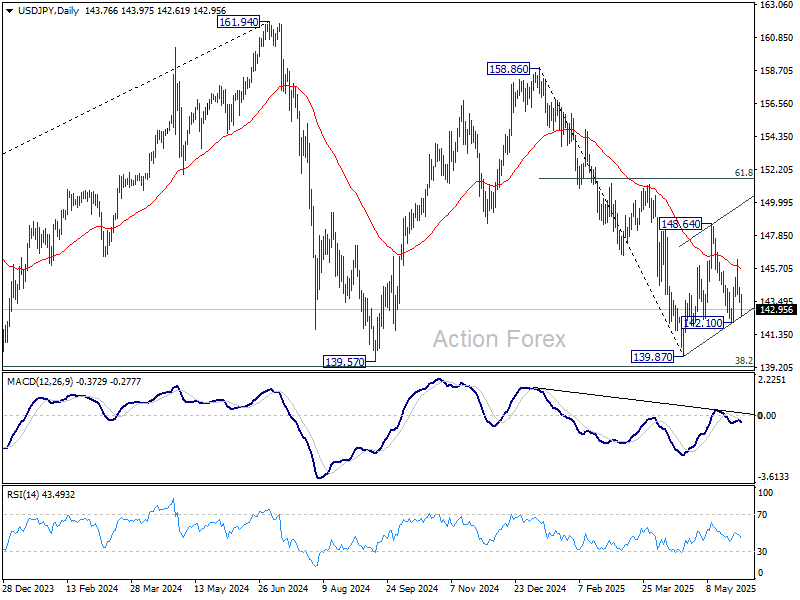
USD/JPY Mid-Day Outlook
Daily Pivots: (S1) 143.51; (P) 143.98; (R1) 144.51; More...
No change in USD/JPY's outlook and intraday bias stays neutral at this point. On the upside, above 146.27 will target 148.64 resistance first. Firm break there will resume the rebound from 139.87. Nevertheless, break of 142.10 will bring deeper fall back to 139.87 low.
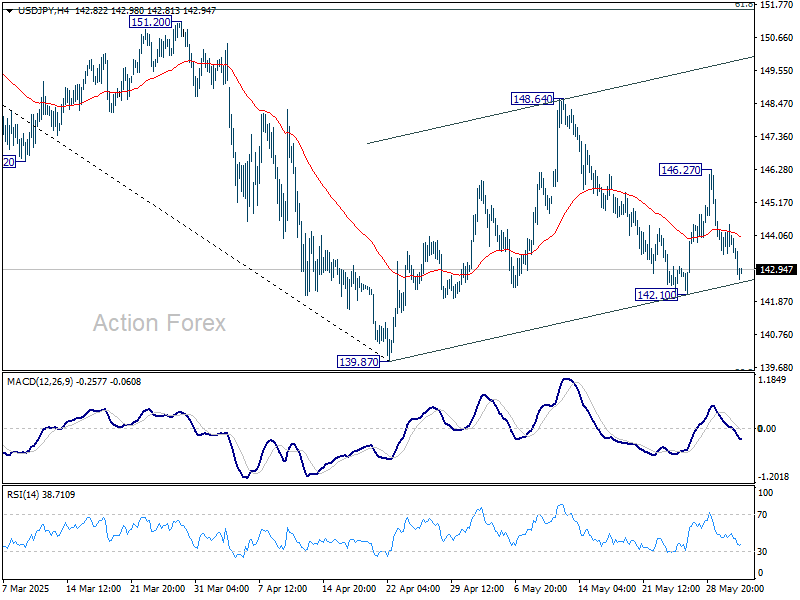
In the bigger picture, price actions from 161.94 are seen as a corrective pattern to rise from 102.58 (2021 low), with fall from 158.86 as the third leg. Strong support should be seen from 38.2% retracement of 102.58 to 161.94 at 139.26 to bring rebound. However, sustained break of 139.26 would open up deeper medium term decline to 61.8% retracement at 125.25.
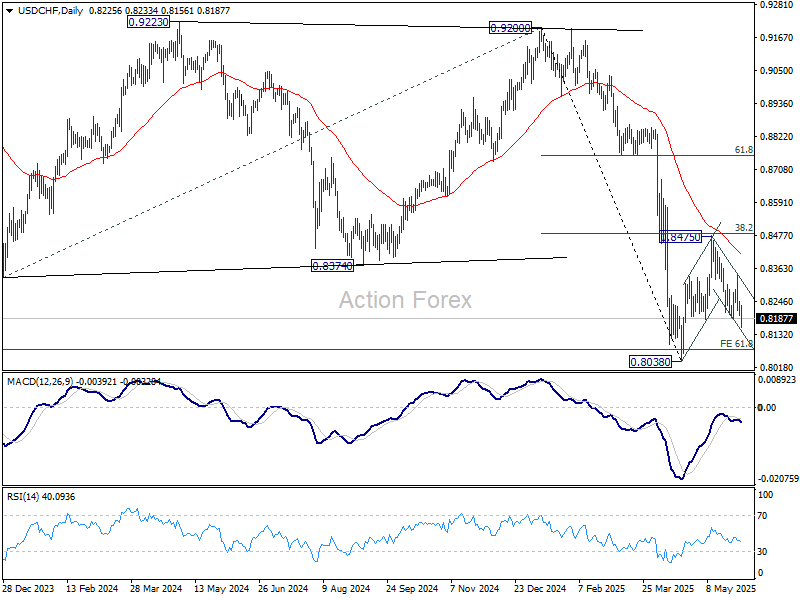
USD/CHF Mid-Day Outlook
Daily Pivots: (S1) 0.8202; (P) 0.8226; (R1) 0.8252; More….
Intraday bias in USD/CHF is back on the downside, as fall from 0.8475 resumed by breaking through 0.8187. Deeper fall should be seen to 0.8038 low. But strong support could be seen from there to bring rebound, on first attempt. On the upside, above 0.8248 minor resistance will turn intraday bias neutral first. However, decisive break of 0.8038 will confirm larger down trend resumption.
In the bigger picture, long term down trend from 1.0342 (2017 high) is still in progress and met 61.8% projection of 1.0146 (2022 high) to 0.8332 from 0.9200 at 0.8079 already. In any case, outlook will stay bearish as long as 55 W EMA (now at 0.8732) holds. Sustained break of 0.8079 will target 100% projection at 0.7382.
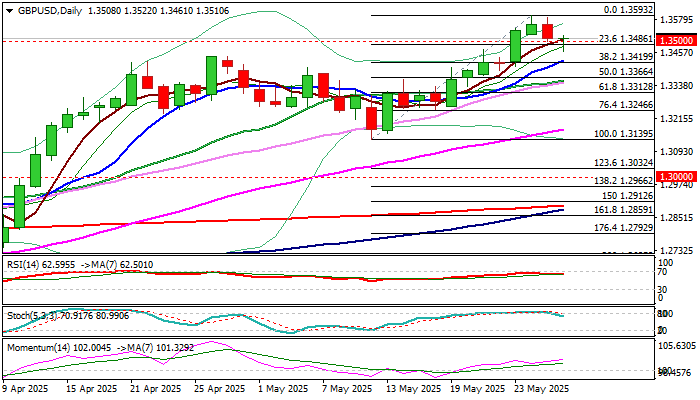
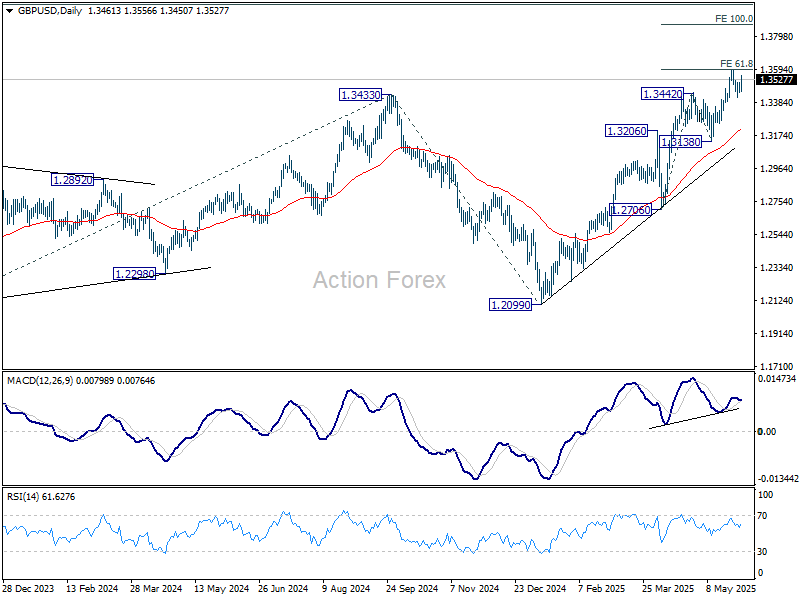
GBP/USD Mid-Day Outlook
Daily Pivots: (S1) 1.3431; (P) 1.3471; (R1) 1.3494; More...
Range trading continues in GBP/USD and intraday bias remains neutral. Further rally is expected with 1.3389 support intact. On the upside, firm break of 1.3592 will resume larger up trend to 100% projection of 1.2706 to 1.3442 from 1.3138 at 1.3874. However, decisive break of 1.3389 will confirm short term topping, and turn bias back to the downside for 1.3138 support instead.
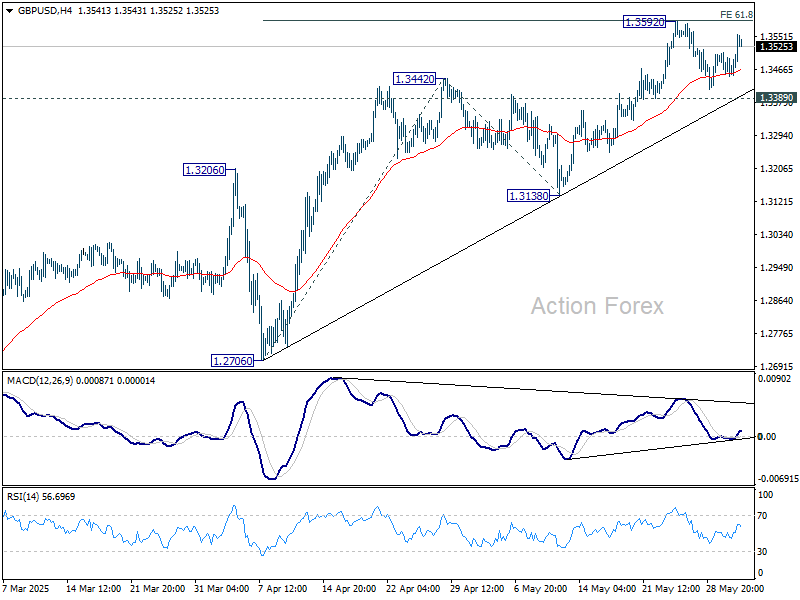
In the bigger picture, up trend from 1.3051 (2022 low) is in progress. Next medium term target is 61.8% projection of 1.0351 to 1.3433 from 1.2099 at 1.4004. Outlook will now stay bullish as long as 55 W EMA (now at 1.2866) holds, even in case of deep pullback.
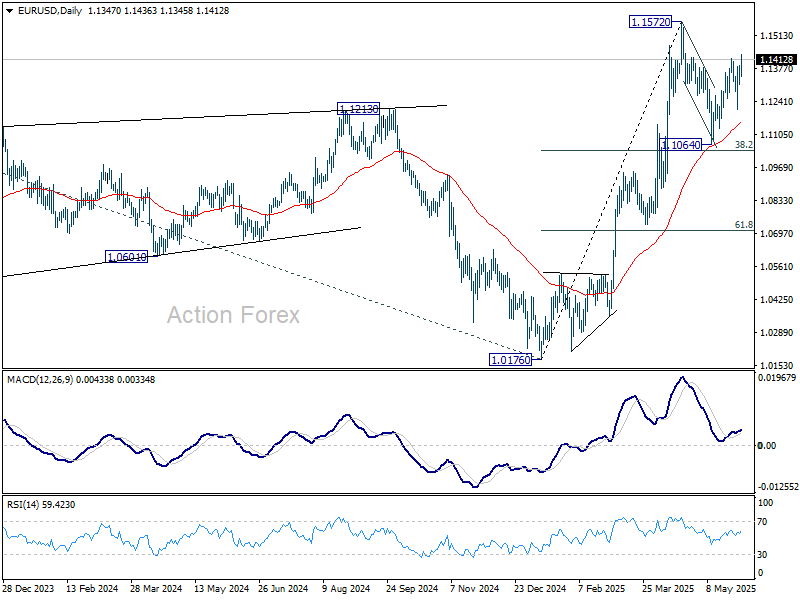
EUR/USD Mid-Day Outlook
Daily Pivots: (S1) 1.1310; (P) 1.1350; (R1) 1.1387; More...
Intraday bias in EUR/USD is back on the upside as rebound from 1.1064 resumed by breaking through 1.1417. Further rise would be seen to retest 1.1572. Strong resistance could be seen there to limit upside at first attempt. Below 1.1311 minor support will turn intraday bias neutral first. Nevertheless, decisive break of 1.1572 will confirm larger up trend resumption.
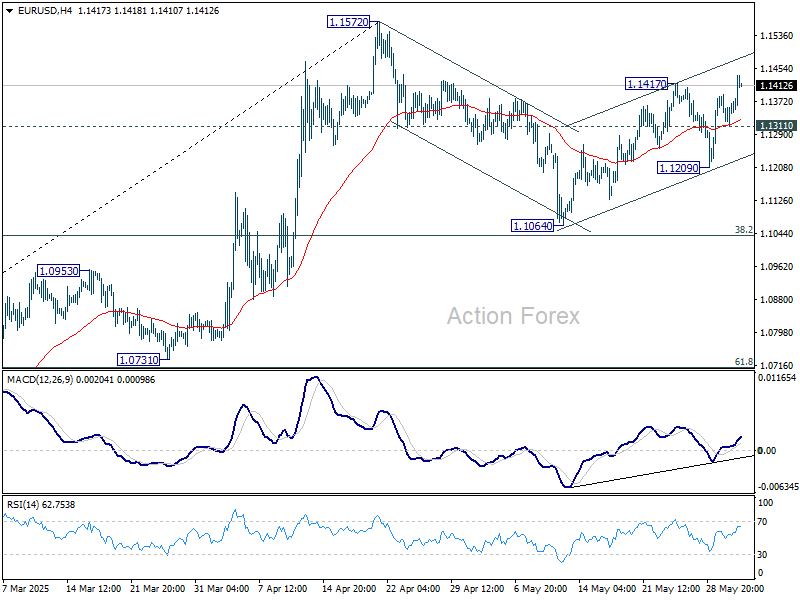
In the bigger picture, rise from 0.9534 long term bottom could be correcting the multi-decade downtrend or the start of a long term up trend. In either case, further rise should be seen to 100% projection of 0.9534 to 1.1274 from 1.0176 at 1.1916. This will now remain the favored case as long as 55 W EMA (now at 1.0856) holds.
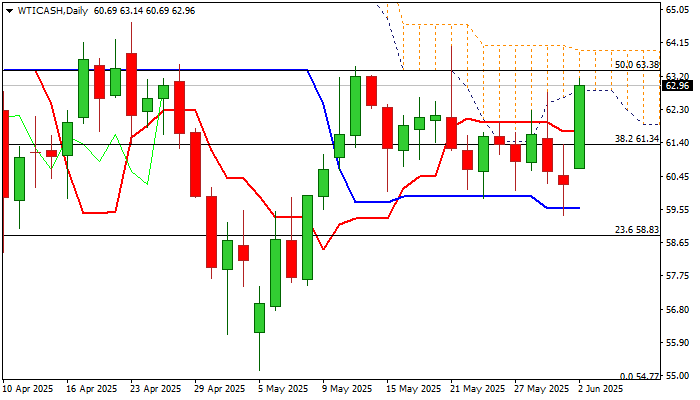
Trade Tensions Drag Dollar While Oil Jumps on OPEC+ Hold
Risk sentiment remains fragile as the US session gets underway, with equity markets under pressure from renewed tariff threats. European stocks are particularly heavy after US President Donald Trump threatened to double tariffs on imported steel. UK equities, however, are finding some support from Prime Minister Keir Starmer’s announcement of increased defense spending.
In the currency markets, Dollar is under broad pressure, currently the weakest performer of the day as traders react to the heightened trade uncertainty again. Loonie and Swiss Franc are also underperforming. Kiwi leads gains, followed by Yen and Aussie. Sterling and Euro sit in the middle.
Meanwhile, oil prices have jumped after OPEC+ confirmed it would maintain output increases in July at pace of 411k barrels per day. Markets had been wary of a possible larger hike, as hinted by sources late last week. That outcome would have likely sparked a sharp bearish gap on Monday’s open. The restraint from OPEC+ has thus supported a modest rebound in crude.
Technically, despite the rebound, WTI crude remains capped below key cluster resistance at 65.24 (38.2% retracement of 81.01 to 55.20 at 65.05. As long as this resistance zone holds, outlook will stay bearish for down trend resumption through 55.20 at a later stage. Nevertheless, firm break of 65.05/24 would bring strong rally to 61.8% retracement at 71.15, with risk of bullish trend reversal.
In Europe, at the time of writing, FTSE is up 0.08%. DAX is down -0.45%. CAC is down -0.58%. UK 10-year yield is up 0.025 at 4.674. Germany 10-year yield is up 0.036 at 2.541. Earlier in Asia, Nikkei fell -1.30%. Hong Kong HSI fell -0.57%. Singapore Strait Times fell -0.10%. Japan 10-year JGB yield rose 0.004 to 1.509.
UK PMI manufacturing finalized at 46.4, with tentative signs of stabilization
UK manufacturing activity remained in contraction in May, with PMI finalized at 46.4, up modestly from April’s 45.4.
The data indicate that the sector continues to face “major challenges,” according to S&P Global’s Rob Dobson, citing turbulent domestic and global conditions, trade uncertainty, subdued client confidence, and increased wage costs tied to tax changes.
Still, there are early signs that the worst of the downturn may be easing. The indexes for output and new orders have risen for two consecutive months and were stronger than the initial flash estimates, hinting at possible stabilization.
However, Dobson warned that the sector could either steady or slip further depending on how trading conditions evolve in the coming months.
Eurozone PMI manufacturing finalized at 49.4, recovery progressing
Eurozone PMI manufacturing was finalized at 49.4 in May, up from April’s 49.0 and marking the highest level in 33 months.
Production increased across all four major economies: Germany, France, Italy, and Spain, supporting economist Cyrus de la Rubia's view that the recovery is gaining traction.
De la Rubia also noted that output has now risen for three straight months, reinforcing the view that the recovery is gaining traction. Historical data suggests a 72% chance of another output increase next month.
Falling input costs, driven by lower energy prices, have enabled manufacturers to cut selling prices again, offering the ECB more flexibility for its expected interest rate cuts.
However, the outlook remains clouded by external risks, particularly the threat of higher US tariffs on EU goods. Any escalation in transatlantic trade tensions could quickly derail the fragile rebound.
Swiss GDP grew 0.5% in Q1, pharma exports surge on tariff frontloading
Switzerland's GDP expanded by 0.5% qoq in Q1, beating market expectations of 0.4% qoq. When adjusted for the impact of major sporting events, GDP growth came in even stronger at 0.8% qoq. The State Secretariat for Economic Affairs noted that the services sector posted broad-based gains and domestic demand remained firm, contributing to the overall solid performance.
A standout was the chemical and pharmaceutical sector, which surged 7.5% in the quarter, driven by a sharp rise in pharmaceutical exports. This lifted overall manufacturing output by 2.1% and goods exports by 5.0%. Notably, exports to the US jumped significantly, suggesting possible front-loading in anticipation of evolving US trade policy.
Japan’s PMI manufacturing finalized at 49.5, firms eye recovery despite trade headwinds
Japan's PMI Manufacturing was finalized at 49.5 in May, up from April's 48.7. S&P Global’s Annabel Fiddes noted that business conditions “moved closer to stabilisation,” as declines in sales eased and firms reported improved hiring activity.
Global trade tensions stemming from US tariffs continue to weigh on demand, with businesses citing "increased client hesitancy" and weaker orders.
Despite persistent external challenges around tariffs, sentiment around future output improved, and hiring rose at the fastest pace in over a year.
EUR/USD Mid-Day Outlook
Daily Pivots: (S1) 1.1310; (P) 1.1350; (R1) 1.1387; More...
Intraday bias in EUR/USD is back on the upside as rebound from 1.1064 resumed by breaking through 1.1417. Further rise would be seen to retest 1.1572. Strong resistance could be seen there to limit upside at first attempt. Below 1.1311 minor support will turn intraday bias neutral first. Nevertheless, decisive break of 1.1572 will confirm larger up trend resumption.
In the bigger picture, rise from 0.9534 long term bottom could be correcting the multi-decade downtrend or the start of a long term up trend. In either case, further rise should be seen to 100% projection of 0.9534 to 1.1274 from 1.0176 at 1.1916. This will now remain the favored case as long as 55 W EMA (now at 1.0856) holds.
USD/JPY Declines for the Third Consecutive Day as Safe-Haven Demand Rises
The USD/JPY pair fell to 143.58, marking its third consecutive day of losses. The Japanese yen continues to gain ground as demand for safe-haven assets rises amid escalating global trade tensions.
Trade risks boost yen demand
Demand for safe-haven currencies surged after US President Donald Trump threatened to double tariffs on steel and aluminium imports to 50% from 4 June. This announcement weighed on Japanese steelmakers, with JFE Holdings and Kobe Steel potentially facing headwinds. Nippon Steel may fare better, thanks to Trump’s favourable comments regarding its planned merger with US Steel.
Meanwhile, tensions between the US and China escalated further as Beijing rejected Trump’s accusations of breaching the recently negotiated trade agreement in Geneva.
Domestic data supports the yen
Japan’s latest data revealed stronger-than-expected capital expenditure growth in Q1. Investment activity increased across both the manufacturing and non-manufacturing sectors, reinforcing domestic fundamentals amid global headwinds.
With uncertainty lingering and market preference shifting towards defensive assets, the yen continues to show resilience and may remain firm if current conditions persist.
Technical analysis of USD/JPY
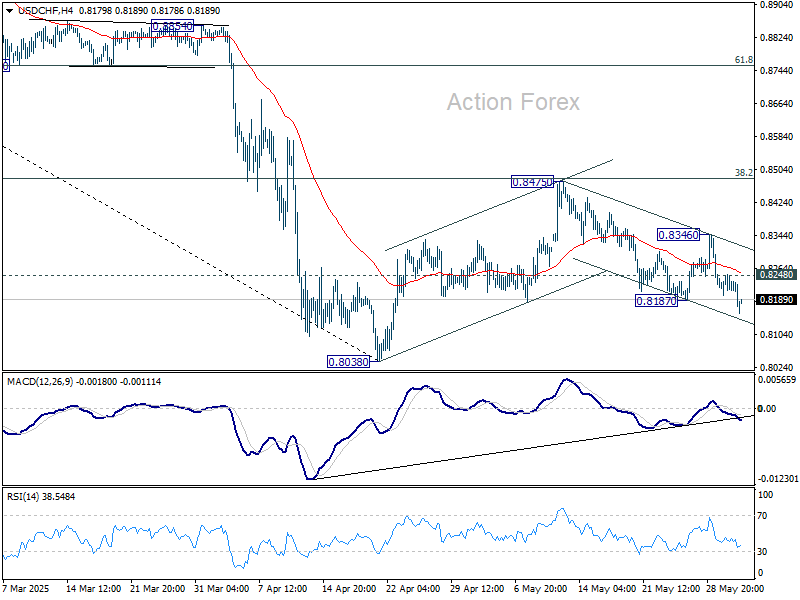
On the H4 chart, USD/JPY formed a narrow consolidation range around 144.22, which the market broke below earlier today. This breakout opens the way for a continued move down towards 142.20. After reaching this level, a corrective rebound to 144.22 is possible. The MACD indicator confirms this scenario, with its signal line below zero and pointing steeply downwards, indicating strong bearish momentum.
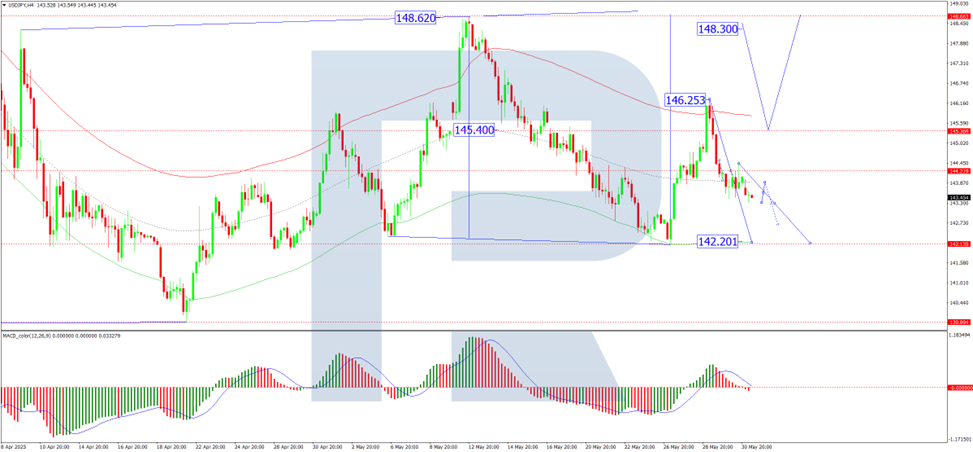
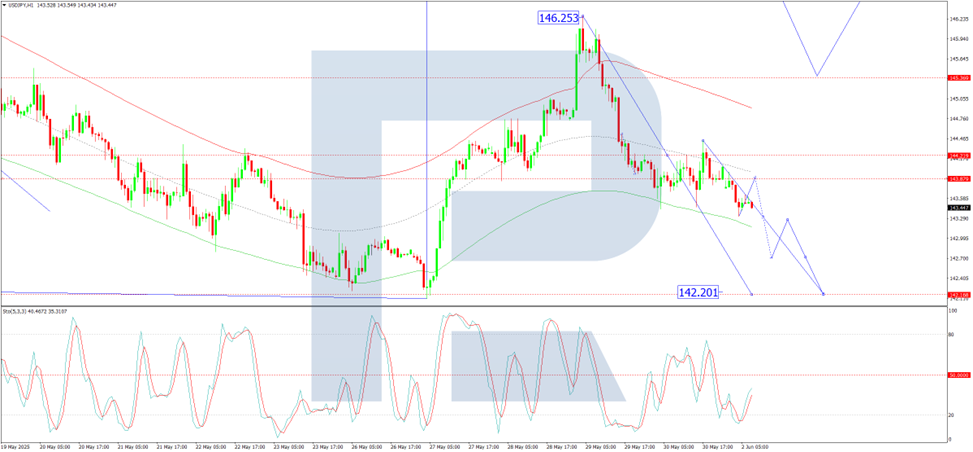
On the H1 chart, the pair is forming the fifth wave of the current downtrend, targeting 142.20. A temporary rebound to 143.88 is expected today, followed by a continuation of the decline to 142.70, with the potential for further movement down to 142.20. The Stochastic oscillator supports this outlook, with its signal line rising above 20 towards 50, suggesting a brief corrective move before further downside.
Conclusion
The USD/JPY pair remains under pressure due to heightened trade-related risk and growing demand for safe-haven assets such as the Japanese yen. Technically, the pair is poised for further decline, with 142.20 as the next key target. While a short-lived rebound may occur, broader sentiment continues to favour yen strength as long as global trade concerns persist.
XAU/USD: Gold Price Surges on Fresh Tariff Worries, Geopolitical Factors
Gold opened with gap higher and surged in early Monday trading, lifted by escalation of war in Ukraine, President Trump’s fresh threats of doubling current tariffs on imports of steel and aluminium and victory of Eurosceptic candidate in Poland’s Presidential election.
Worsened conditions provided fresh boost to safe haven demand, with gold price advancing nearly 1.8% since opening today.
Bulls pressure key barrier at $3365 (May 23 high), break of which to signal an end of near-term corrective phase ($3365/$3245) and further brighten near-term outlook, with targets at $3400 (round figure) and $3437 (May 7 lower top) expected to come in focus.
Daily studies turned to full bullish setup, with thick rising daily cloud (which contained several attack recently) continuing to underpin, along with diverging daily Tenkan/Kijun-sen, after formation of bull-cross, with breach of the upper boundary of triangle ($3343) contributing to positive signals.
Corrective action should be anticipated in the near term as hourly studies are strongly overbought, with dips likely to shallow in current strongly bullish sentiment.
Broken triangle’s upper trendline turned to initial support, followed by supports at $3330/20 zone, which should ideally contain dips and keep fresh bulls intact.
Res: 3358; 3365; 3400; 3414.
Sup: 3343; 3330; 3322; 3311.