
Sample Category Title
EUR/CHF Daily Outlook
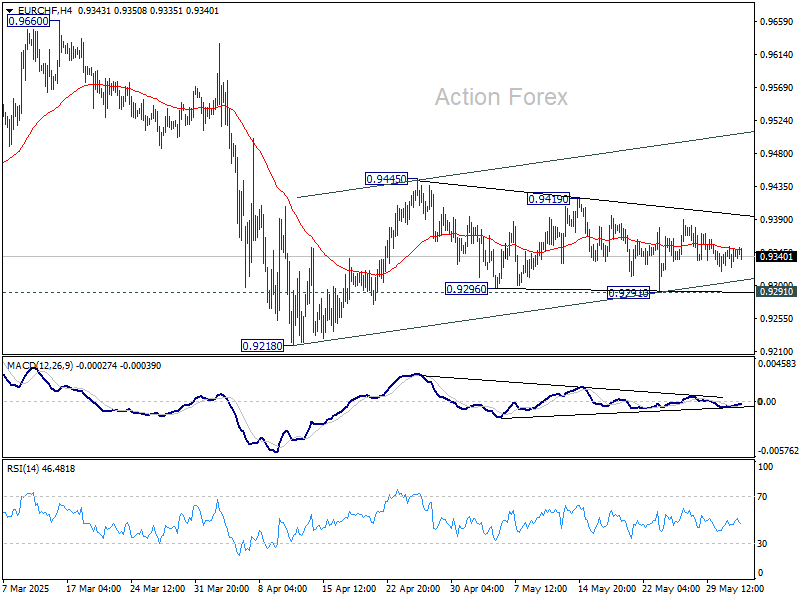
Daily Pivots: (S1) 0.9333; (P) 0.9343; (R1) 0.9361; More....
Sideway trading continues in EUR/CHF and intraday bias remains neutral. Rise from 0.9218 might continue, either as a correction to fall from 0.9660, or the third leg of the pattern from 0.9204. On the upside, above 0.9419 will target 0.9445 resistance and above. Nevertheless, on the downside, firm break of 0.9291 will bring retest of 0.9218 low.
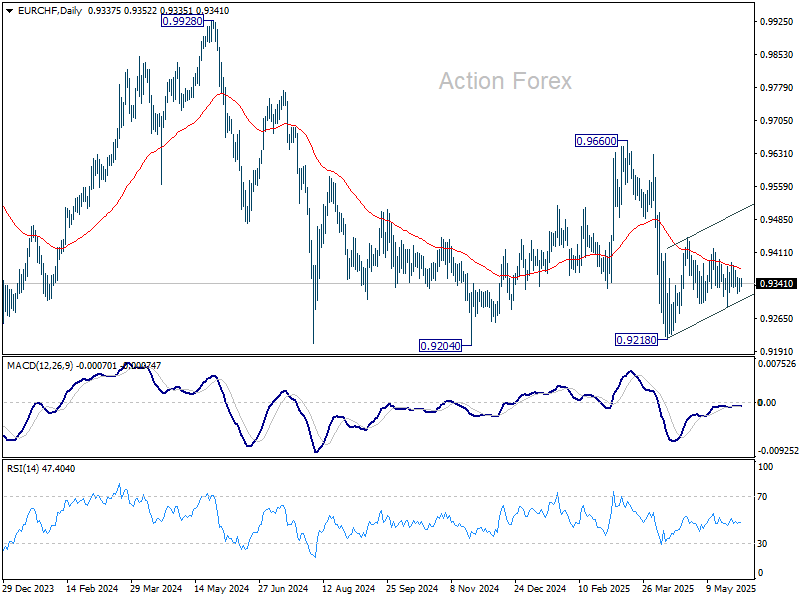
In the bigger picture, prior rejection by long-term falling channel resistance (now at 0.9527) retains medium term bearishness. That is, down trend from 1.2004 (2018 high) is still in progress. Firm break of 0.9204 (2024 low) will confirm resumption. This will remain the favored case as long as 0.9660 resistance holds.
USD/CAD Daily Outlook
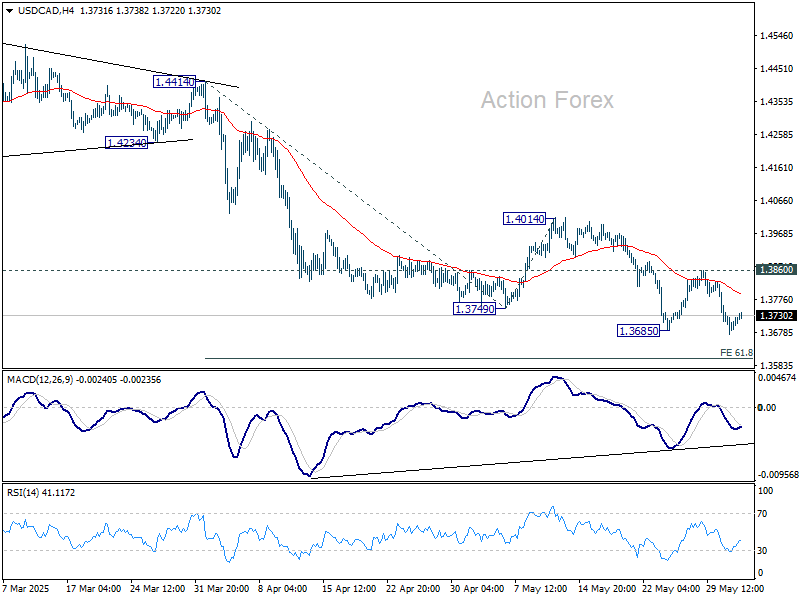
Daily Pivots: (S1) 1.3677; (P) 1.3710; (R1) 1.3745; More...
Intraday bias in USD/CAD is back on the downside with breach of 1.3685 support. Current fall from 1.4791 is resuming. Next target is 61.8% projection of 1.4414 to 1.3749 from 1.4014 at 1.3603. For now, outlook will stay bearish as long as 1.3860 resistance holds, in case of recovery.
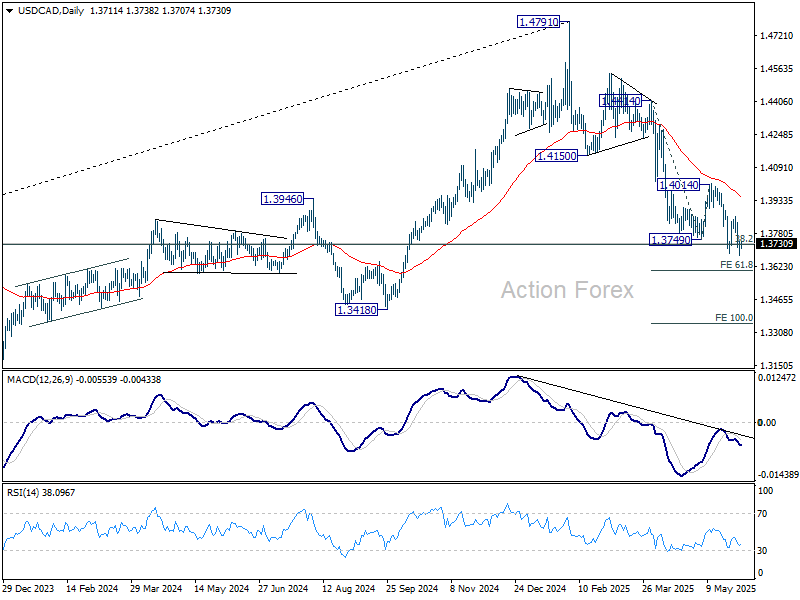
In the bigger picture, price actions from 1.4791 medium term top could either be a correction to rise from 1.2005 (2021 low), or trend reversal. In either case, further decline is expected as long as 1.4014 resistance holds. Firm break of 38.2% retracement of 1.2005 (2021 low) to 1.4791 at 1.3727 will pave the way back to 61.8% retracement at 1.3069.
AUD/USD Daily Report
Daily Pivots: (S1) 0.6453; (P) 0.6477; (R1) 0.6521; More...
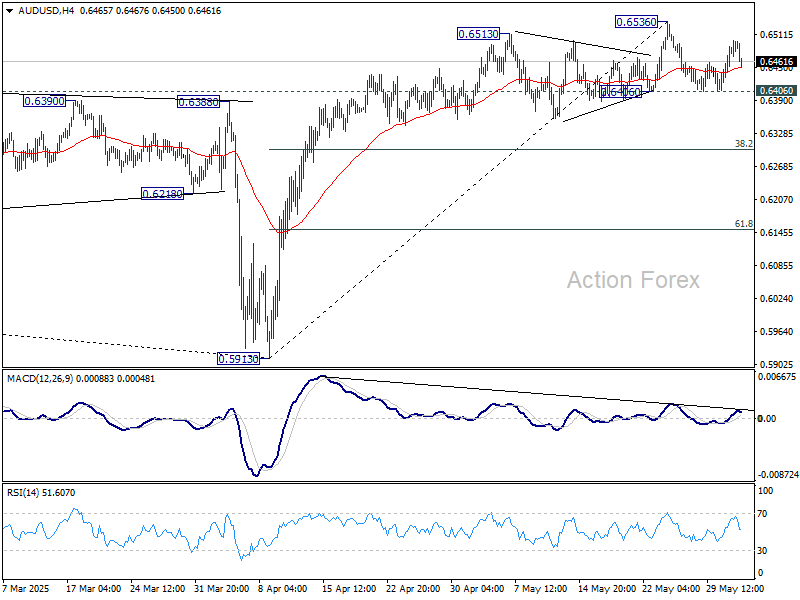
Intraday bias in AUD/USD stays neutral as sideway trading continues. Further rally is expected with 0.6406 support intact. Above 0.6536 will resume the rally from 0.5913 to 61.8% retracement of 0.6941 to 0.5913 at 0.6548. However, firm break of 0.6406 will confirm short term topping, and turn bias back to the downside for 38.2% retracement of 0.5913 to 0.6536 at 0.6298.
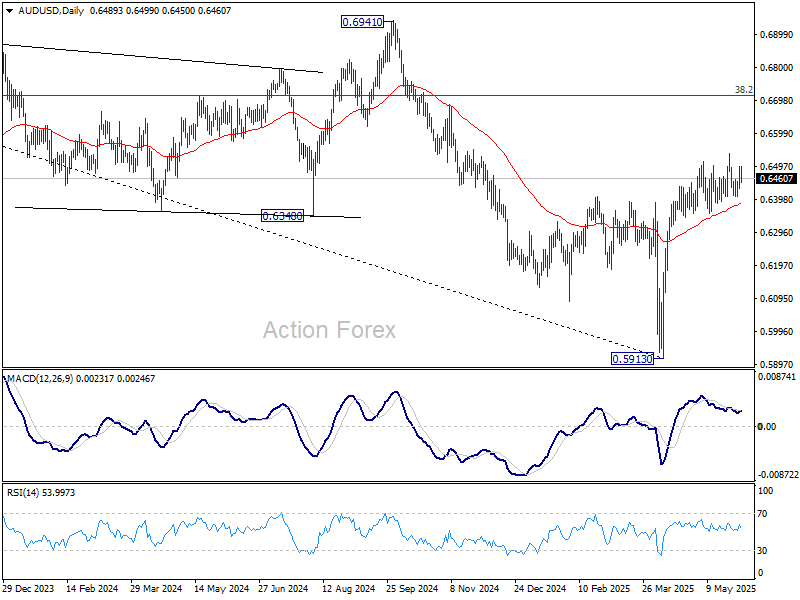
In the bigger picture, AUD/USD is still struggling to sustain above 55 W EMA (now at 0.6441) cleanly, and outlook is mixed. Sustained trading above 55 W EMA will indicate that rise from 0.5913 is at least correcting the down trend from 0.8006 (2021 high), with risk of trend reversal. Further rise should be seen to 38.2% retracement of 0.8006 to 0.5913 at 0.6713. However, rejection by 55 W EMA will revive medium term bearishness for another fail through 0.5913 at a later stage.
EUR/USD Daily Outlook
Daily Pivots: (S1) 1.1377; (P) 1.1413; (R1) 1.1480; More...
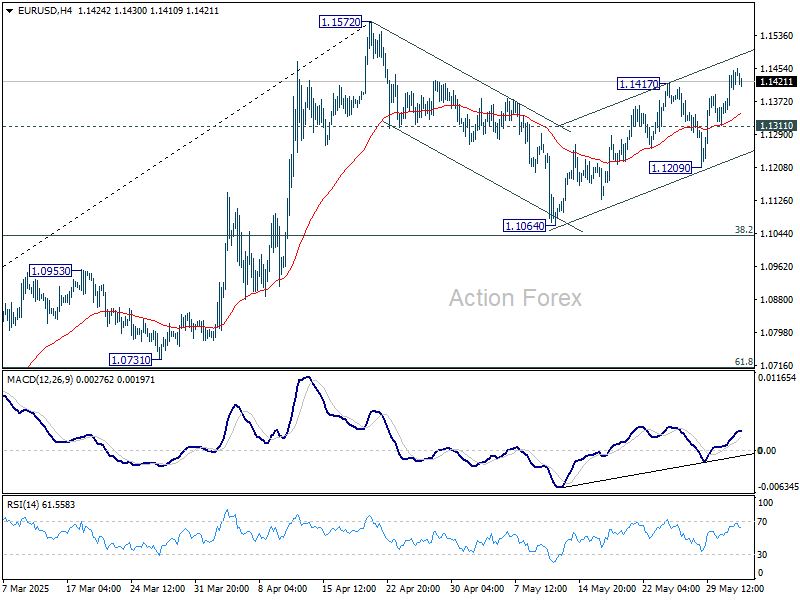
EUR/USD's rebound from 1.1064 is in progress and intraday bias stays mildly on the upside. Further rise would be seen to retest 1.1572. Strong resistance could be seen there to limit upside at first attempt. Below 1.1311 minor support will turn intraday bias neutral first. Nevertheless, decisive break of 1.1572 will confirm larger up trend resumption.
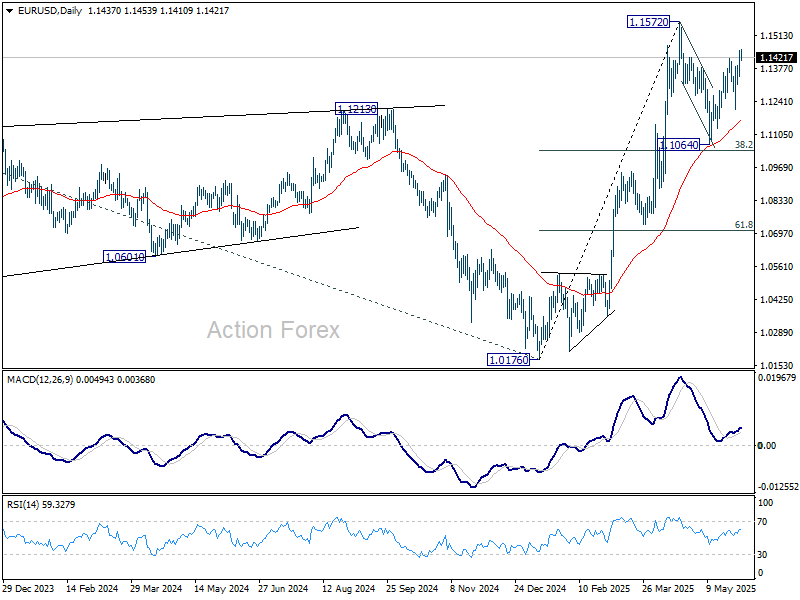
In the bigger picture, rise from 0.9534 long term bottom could be correcting the multi-decade downtrend or the start of a long term up trend. In either case, further rise should be seen to 100% projection of 0.9534 to 1.1274 from 1.0176 at 1.1916. This will now remain the favored case as long as 55 W EMA (now at 1.0856) holds.
GBP/USD Daily Outlook
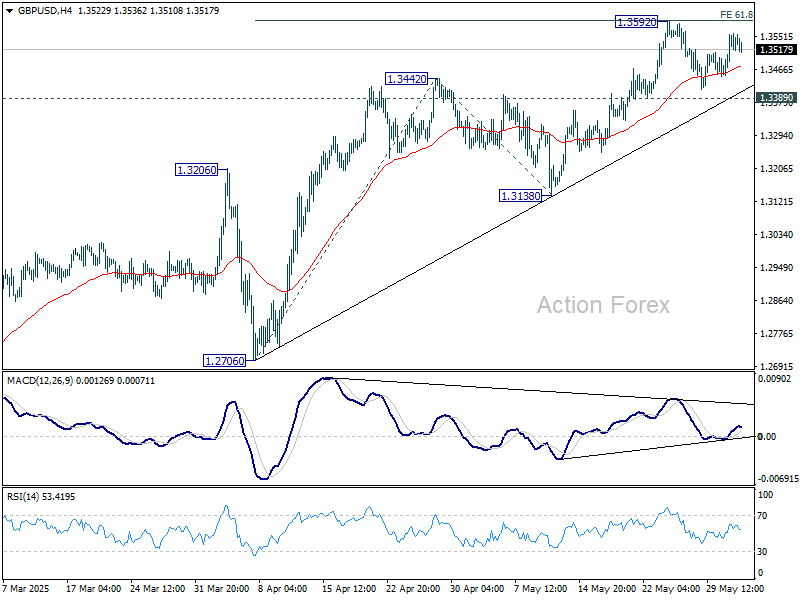
Daily Pivots: (S1) 1.3478; (P) 1.3519; (R1) 1.3585; More...
Intraday bias in GBP/USD stays neutral and further rally is expected with 1.3389 support intact. On the upside, firm break of 1.3592 will resume larger up trend to 100% projection of 1.2706 to 1.3442 from 1.3138 at 1.3874. However, decisive break of 1.3389 will confirm short term topping, and turn bias back to the downside for 1.3138 support instead.
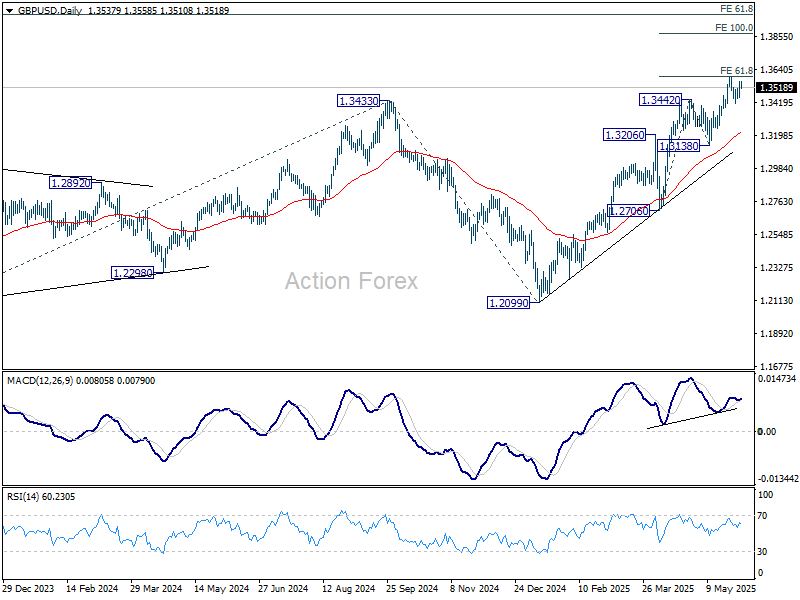
In the bigger picture, up trend from 1.3051 (2022 low) is in progress. Next medium term target is 61.8% projection of 1.0351 to 1.3433 from 1.2099 at 1.4004. Outlook will now stay bullish as long as 55 W EMA (now at 1.2866) holds, even in case of deep pullback.
USD/JPY Daily Outlook
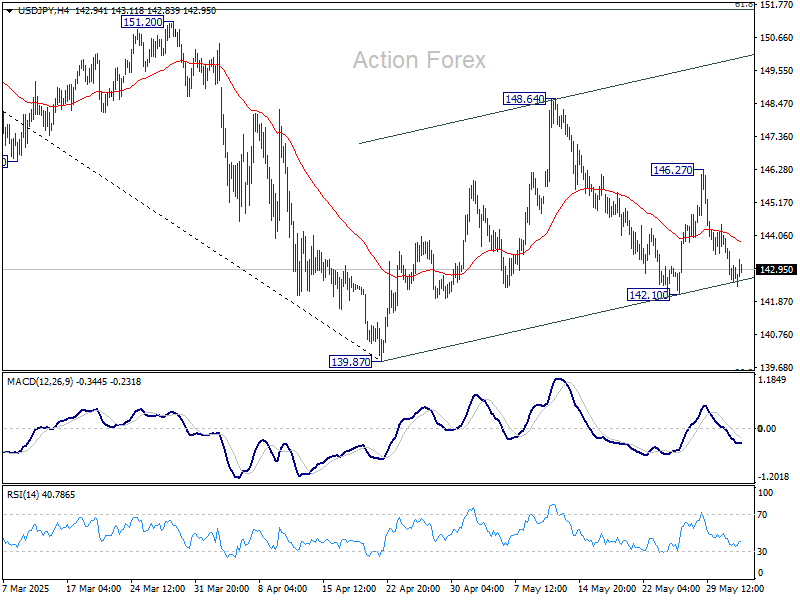
Daily Pivots: (S1) 142.16; (P) 143.08; (R1) 143.61; More...
Intraday bias in USD/JPY remains neutral at this point. On the upside, above 146.27 will target 148.64 resistance first. Firm break there will resume the rebound from 139.87. Nevertheless, break of 142.10 will bring deeper fall back to 139.87 low.
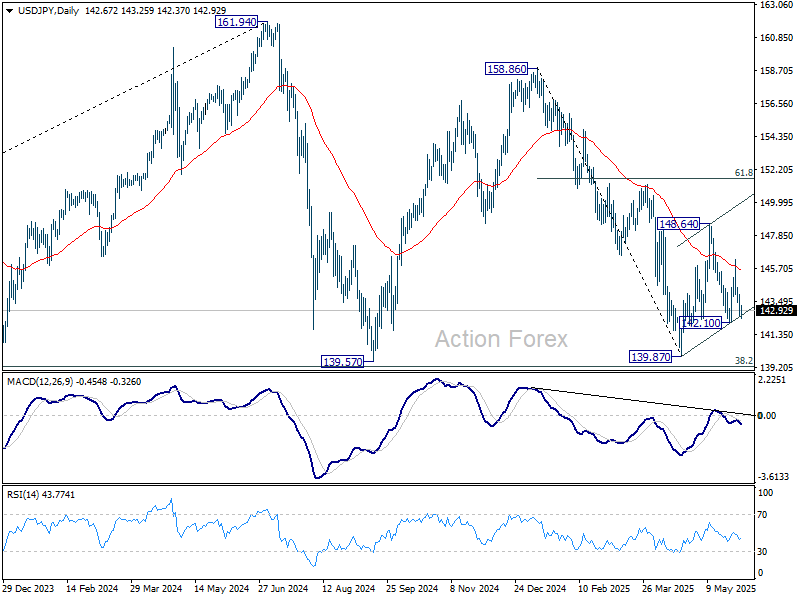
In the bigger picture, price actions from 161.94 are seen as a corrective pattern to rise from 102.58 (2021 low), with fall from 158.86 as the third leg. Strong support should be seen from 38.2% retracement of 102.58 to 161.94 at 139.26 to bring rebound. However, sustained break of 139.26 would open up deeper medium term decline to 61.8% retracement at 125.25.
Cautiously and Predictably, RBA Minutes Confirm a Moderate Path
The minutes for the May 2025 RBA Monetary Policy Board meeting and speech by Assistant Governor Hunter reveal that the RBA is not panicking about the world and recognises the domestic case for policy normalisation, not expansion.
The policy and market volatility since the 2 April ‘Liberation Day’ tariff announcements has all happened since the April RBA meeting. Accordingly, the section of the minutes on financial conditions indicates that the Board received an extensive briefing on these developments. The initial sell-offs and deteriorations in liquidity, both globally and in Australia, had mostly retraced by the time of the May meeting. However, the Board expressed some scepticism about the extent of the rebound, particularly insofar as it relied on stimulatory fiscal or monetary policy globally or deregulation in the US. It sounded a note of scepticism about the US more broadly, highlighting that the US’s poor fiscal position might be contributing to higher term premia. It also noted that reallocation of global investors’ previously overweight US exposures might be weighing on the US dollar. The minutes highlighted that the US dollar depreciation runs against the expected pattern where lower imports induce an appreciation of a tariffing country’s exchange rate.
The Minutes also noted that market pricing on policy rates had initially reacted more sharply to tariff news in Australia than in some peer economies. While some of this might have been a separate reaction to domestic data, some market participants may have viewed Australia as being particularly vulnerable, because of our close economic linkages with China. By contrast, the Board views China as being well placed to withstand the tariff turmoil and maintain growth. The minutes noted that the Chinese authorities ‘authorities there appeared to be both committed to their growth target of around 5 per cent and able to provide more stimulus to the economy if required.’
Turning to the domestic economy, the Minutes highlighted that growth, inflation and the labour market were all evolving broadly as expected. They also noted that the Board ‘welcomed’ the broad-based easing in underlying inflation. These outcomes provided ‘welcome confirmation’ that upside inflationary risks had not crystallised. Contrary to the Governor’s comments in the media conference downplaying the use of shorter-run calculations, the minutes highlighted that on a six-month-annualised basis, trimmed mean inflation was in the middle of the RBA’s 2–3% target range.
The domestic growth outlook was scaled back a little, both because of weaker global demand for Australian exports and some possible uncertainty effects weighing on domestic investment; today’s speech by RBA Assistant Governor Sarah Hunter also touched on these potential uncertainty effects. A lower cash rate assumption offset these external effects to some extent.
Given these developments, the staff forecasts were characterised similarly to the post-meeting communication, with underlying inflation now expected to be around the midpoint of the target range. For a 0.1ppt revision to the forecast relative to the February round, this is a significant change in language. The determination to get exactly to 2.5% declared in the wake of the February meeting, to maximise the chance of being in the target range, was nowhere to be seen in any of the communication after the May meeting.
The minutes also noted comments that wages growth might ‘slow more noticeably than currently forecast’. Although the staff assessment remains that the labour market is tighter than full employment, the minutes again suggested not all Board members were convinced. Members noted signs of easing pressure, such as a greater focus on job security in bargaining agreements. Subsequent to the RBA meeting, the Fair Work Commission (FWC)
handed down its 2025 National Wage Case decision. As Westpac Senior Economist Justin Smirk notes in his commentary on the decision, the 3.5% increase to minimum and award wages is consistent with our forecast moderation in overall wages growth.
The FWC emphasised that slow growth in labour productivity was mostly an outworking of the expansion in the care economy. We have been highlighting this for some time (see here, here and here). It is a multi-decade trend as well as reflecting the more recent ramp-up in the NDIS. Some drag on economy-wide measures of productivity might therefore be expected to continue. Importantly, though, this will have almost no implications for labour costs in the sectors where rising labour costs might actually influence prices and so inflation, such as business services. The RBA has increasingly recognised this over the past year. The minutes did note that productivity growth has yet to pick up and that this is a potential upside risk to inflation. However, this is a far cry from the comments in the August 2024 minutes about ‘the need for productivity growth to recover in order to help reduce growth in unit labour costs.’
Turning to the policy decision, as in the post-meeting media conference, there is a hint in the minutes that the staff went to the meeting with either an open recommendation, or at least a weaker steer than a specific recommendation would normally imply.
The Board clearly considered the case for a hold. This case rests on a view that domestic labour and product markets are still tight and policy not that restrictive. Tactical considerations also entered into the debate, including an argument to ‘wait and see’ given the current uncertainty. The minutes also cited concerns about near-term fluctuations in headline inflation. Note that this argument runs counter to a more standard view that monetary policy should focus on keeping inflation sustainably inside the target range.
Having dismissed the case to hold, the Board acknowledged that ‘trends in domestic conditions could, on their own, justify some degree of reduction in the cash rate target at this meeting.’ It was therefore ‘no longer necessary to be as restrictive’. This was a point we noted in our discussion at the time of the meeting, though it came out less clearly in the post-meeting RBA communication; for example, the Overview of the Statement on Monetary Policy concluded ‘that it was appropriate to ease monetary policy at this meeting. The Board nevertheless remains cautious about the outlook’.
Developments overseas strengthened the case for a rate cut. As we noted post-meeting, the RBA now views the tariffs and broader trade dispute as being more likely to reduce inflation than add to it. This is a shift from the more equivocal language in April, that ‘the implications for inflation would be more complicated’.
The minutes record a fairly open discussion about the appropriate size of the cut. The case for a larger-sized 50bp cut rested on the idea that the downside risks were large enough that some of the future easing path should be front-loaded. Given the Board’s views of the impact on the Australian economy – and especially its views on China – this argument was unlikely to resonate with members. The minutes were also clear that the Board would not want to give the impression that a large cut now meant a larger overall easing phase and lower landing point. As we argued ahead of the meeting, it was a bridge too far to expect the RBA’s thinking to pivot all the way from hawkish cut in February to going hard in May. Consistent with the circumspect reaction we identified then, the Minutes expressed a preference for moving ‘cautiously and predictably’. It also noted members’ judgement that ‘it was not yet time to move monetary policy to an expansionary stance’. This raises the question of where ‘neutral’ is, but for now we expect that the Board will tread carefully from here, given the uncertainties involved in assessing this.
Our read of the RBA’s recent communication remains that it will not rush further cuts. In particular, we expect that it is not looking to follow up the May cut with one at the July meeting. August remains the most likely date for the next cut.
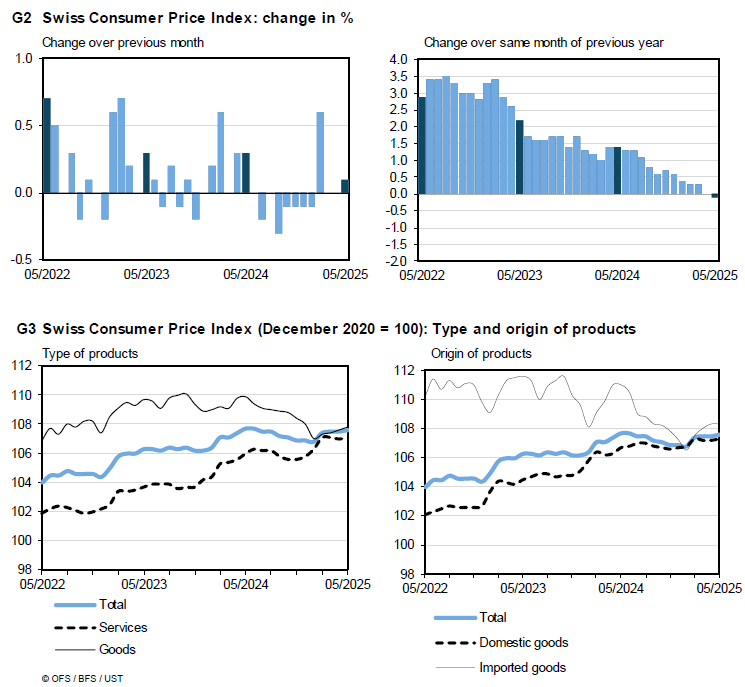
Swiss CPI falls to -0.1% yoy, first negative since 2021
Swiss consumer inflation turned negative in May for the first time since March 2021, with headline CPI falling -0.1% yoy, down from 0.0% in April yoy. Core inflation, which strips out volatile components such as fresh food and energy, slipped to 0.5% yoy from 0.6% yoy previously.
On a monthly basis, both headline and core CPI rose 0.1%, in line with expectations.
The breakdown reveals that domestic product prices grew just 0.2% mom and decelerated to from 0.8% yoy to 0.6% yoy. Imported goods prices were flat on the month and fell -2.4% yoy, ticked up from -2.5% yoy.
Markets Clearly Struggled to Find a Coherent Directional Storyline
Markets
Markets clearly struggled to find a coherent directional storyline yesterday. A new layer of trade uncertainty (US potentially raising steel tariffs to 50%, mutual US-China accusations of not meeting the Geneva agreements) caused investors to start with a guarded risk off bias, weighing on the dollar and on equities. Core yields kept an upward bias (higher risk premia? inflation fears?). The US manufacturing ISM confirmed the stagflationary risk related to US trade policy. Activity data disappointed. The headline index eased further in contraction territory (48.5), showing little relief from the truce in reciprocal tariffs. Some sub-series (production, orders, employment) were less negative but remain sub 50. A sharp decline in imports suggests further supply chain complications. Elevated prices paid (69.4) confirmed ongoing stagflationary risks. In a first reaction, yields, the dollar and equities declined further. Subsequent rebound, especially in equities, was a bit remarkable. US indices reversed losses and closed in positive territory (S&P 500 +0.41%). US yields added about 3-4 bps across the curve. We see the move mainly as technical in nature with markets holding recent ST ranges. In a similar move to the US, German yields added between 1.3 bps (2-y) and 3.2 bps (30-y). With respect to the risk persistent high long term yields, central bankers and government issuers recently indicated they might take action to restore the supply balance. In this respect, BOE’s Catherine Mann addressed the tensions between unwinding the BoE’s balance sheet via QT and at the same time easing policy via (gradual) rate cuts. This suggests some internal debate on the pace of QT to be decided for October. The minutes of a meeting between the BOJ and financial institutions this morning also illustrates this issue. Question is whether changing supply across the curve will be enough to manage the broader issue of excessive deficits risk premia. The dollar post-ISM closed near the intraday lows (DXY 98.7, EUR/USD 1.1441).
Asian markets show no clear trend this morning. A weak Caixin manufacturing PMI (cf infra) triggered further calls for new stimulus. A Japanese 10-y bond auction met decent demand. USD rebounds slightly. Today, the EMU flash May CPI is expected to print at 0.0% M/M and 2.0% Y/Y (core expected at 2.4% from 2.7%). We don’t expect the data to change markets’ assessment the Thursday’s expected 25 bps rate cut. The focus turns to the staff forecast and Lagarde’s guidance (pause?). In the US, JOLTS job openings are interesting, but markets probably will wait for Friday’s payrolls to draw any conclusion on the (length of the) Fed’s current wait-and-see stance. Even as there is some ‘improvement’ this morning YTD lows in the dollar (DXY, EUR/USD) stay within reach.
News & Views
China’s Caixin manufacturing PMI signaled a first deterioration in operating conditions in eight months. The headline figure slumped from 50.4 to 48.3 (lowest since September 2022) with consensus expecting a slight improvement. Manufacturing output declined alongside a renewed fall in new orders. Incoming new work contracted at the quickest pace in over two-and-a-half years. Export orders also shrank at a faster pace. In line with reduced operations, firms cut back on their purchasing activity and lowered their staffing levels. Turning to prices, average input costs and output charges continued to decline. Moreover, the rates of reduction accelerated since April. Finally, optimism picked up since April as firms grew more hopeful that trade conditions can improve and the widening of export markets will help to drive sales in the year ahead. Caixin Insight Group suggested that Chinese policy needs further evaluation. “Follow-up actions should be introduced based on actual conditions. More importantly, boosting domestic demand should be grounded in increasing household incomes by improving employment environment, strengthening social security, raising household disposable income, improving market expectations, and ultimately driving a continued economic recovery.”
Polish PM Tusk will seek a confidence vote – which he’s unlikely to lose - to shore up support for his pro-European coalition government after his candidate narrowly lost presidential election against nationalist PiS-nominee Nawrocki. That way, the biggest opposition party holds on to a key mandate which is more than just ceremonial. PM Tusk said he has an “emergency plan” in case of a continued difficult cooperation with the (new) president. Nawrocki is unlikely to side with Tusk to support legislation and is for example strongly opposed to ease the country’s strict abortion law. Polish markets reacted orderly yesterday to the overall status quo. The zloty temporary spiked to EUR/PLN 4.27 before returning to the 4.24-area.
June Starts With Mixed Feelings
The month of June started on a bearish note, as renewed trade tensions and mixed economic data dominated the headlines. First, tensions between the US and China notched up another level, with both countries accusing each other of violating agreements and implementing discriminatory measures. It’s now uncertain whether Trump and Xi will meet to talk.
Then, not much progress has been made on the European front—aside from growing frustration in Brussels after the US doubled steel and aluminium tariffs to 50%, effective mid-June. Remember, the deadline for US–EU negotiations is July 9th—almost too soon to be optimistic. Meanwhile, tensions between the EU and China are also rising, with the EU deciding not to purchase medical equipment from China, citing ‘reciprocity of purchasing.’ If Europeans start playing by Trump’s rules, the next four years could turn into a global nightmare. At least everyone will get a slice of the horror pie—apparently, that’s what global politicians are aiming for.
Cherry on top, trade tensions are now accompanied by military tensions. The British PM announced yesterday at the government’s Strategic Defense Review that £15bn will be spent to bring Britain up to ‘war-fighting readiness’. Needless to say, European defense stocks cheered the news: Babcock—which makes submarines and warships—rallied more than 8% to a fresh all-time high. The Select Stoxx Europe Aerospace & Defense ETF gained another 1.63%, also reaching a new record, while the rest of the Stoxx 600 remained muted.
Gold rallied to a three-week high on the back of renewed geopolitical jitters, while USDCHF sank below the 0.82 mark amid flight to safety—toward the Swiss economy, which expanded by 2% in Q1. That growth was largely driven by a surge in exports to the US ahead of tariff implementation, suggesting it could be temporary. Swiss inflation data will likely show the first negative print since April 2021—fueling expectations that the Swiss National Bank (SNB) could cut rates back to 0% this month.
Elsewhere, the latest PMI figures signaled continued contraction in German manufacturing but a surprise improvement in Italy and Spain. Overall, the Eurozone’s manufacturing PMI beat expectations, while ISM data in the US hinted at slowing activity. That wasn't enough to stir the Federal Reserve (Fed) doves, though—the US 2-year yield rebounded 4bp on Monday, and the dollar is now poised to retest its YTD lows from April.
Most investors remain bearish on the US dollar, expecting continued debasement due to lackluster growth and a Fed unwilling to offer support amid an uncertain inflation outlook. As a result, EURUSD is consolidating gains above the 1.14 mark. The next natural target for bulls is 1.1573—the level reached on April 21, when the dollar index also touched its 2025 low. The euro outlook remains positive on expectations that near-target inflation will allow the European Central Bank (ECB) to deliver a comfortable 25bp cut this week—and possibly another one this summer. Euro traders will be watching closely for confirmation in today’s flash CPI update for May.
Across the Channel, persistent inflation remains a headache for Bank of England (BoE) doves. But many economists and investors worry that the BoE has fallen behind the curve, and that fiscal measures pose a serious risk to UK growth—demanding closer attention. Either way, dollar weakness is the primary driver of GBPUSD, which has climbed above 1.35 and could extend gains if the greenback continues to slump, as many expect. Interestingly, the FTSE 100 has remained resilient despite sterling’s strength. Defense stocks and gold miners are thriving in this climate—Fresnillo rose 6% yesterday and has been rising exponentially since the start of the year.
In commodities, US crude closed above its 50-day moving average for the first time since March 31. But weaker-than-expected Caixin manufacturing data from China is weighing on sentiment this morning. Copper futures—seen as a barometer of global economic health—are also under pressure. Meanwhile, VanEck’s rare earth and strategic metals ETF is stuck at multi-year lows. Appetite is depressed by Chinese export restrictions, which frustrate Trump’s USA, which needs these materials for its tech sector—and may not get them if trade tensions continue down their current destructive path.
In the US, however, the S&P500 managed to shrug off trade anxieties: steel and aluminium stocks rallied on the extra tariff news, Big Tech remained in demand, and large banks cheered reports that the Trump administration may ease regulations for major lenders. Traders may be explicitly betting that Trump will soften his tariff stance during the 90-day pause—now dubbed the “TACO” trade (Trump Always Chickens Out)—or they may simply be ignoring the trade risks out of FOMO. In either case, the rally looks fragile and risks remain.
Final note: the Japanese 10-year auction saw stronger-than-expected demand and pulled the 10-year JGB yield below the 1.50% mark. Notably, increased demand for Japanese government bonds has tended to coincide with selling pressure in the S&P500 since last summer—largely due to the unwinding of Japanese carry trades, which sent shockwaves through global financial markets. As such, relatively high Japanese yields increase the risk of reverse carry trades and should be watched closely.