Sample Category Title
Markets Today: Euro Area Inflation Drops, OECD Downgrades Growth and Trump-Xi Meeting
Asian Session Market Wrap
Markets failed to hold onto late US session gains as markets were hoping for positive news regarding a potential Trump-Xi meeting.
US Equity Futures are down in the Asian session with the S&P 500 down around approximately 0.6%. In Asia, a key measure of regional stocks went up by 0.1%, breaking a three-day losing streak. Chinese stocks in Hong Kong rose as investors hoped for more government support after factory activity unexpectedly dropped in May.
The US Dollar is on the up this morning, with the greenback gaining against the majority of its G10 counterparts.
Power Currency Balance
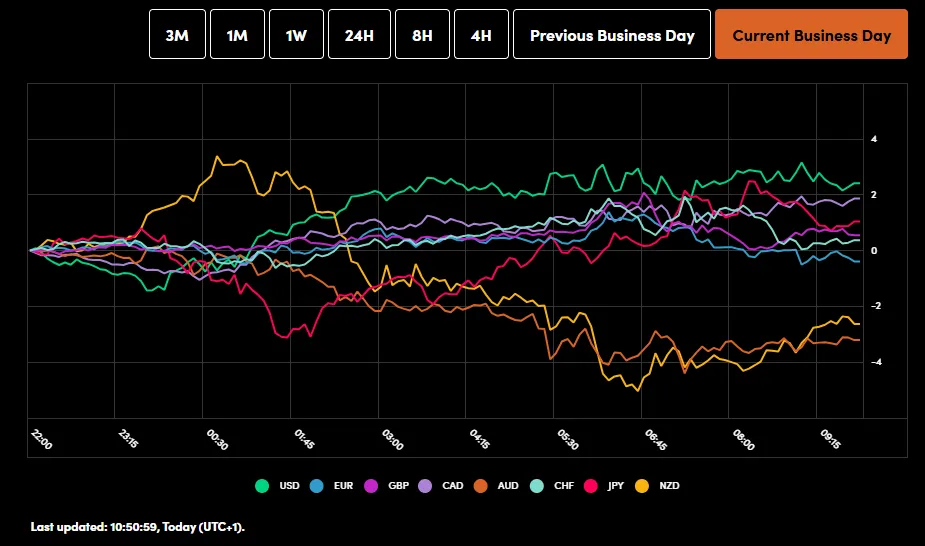
Source: OANDA Labs
The European Open
It has been a busy start to the European Session this morning.
European shares fell on Tuesday, dragged down by banks and mining companies, which are sensitive to economic changes, as investors waited for news on the trade war affecting global growth. The pan-European STOXX 600 index lost 0.5% after an earlier rise, adding to Monday's losses. Banks dropped 1.4%, and mining stocks fell 2.3%.
OECD Downgrades Global Growth Forecast
According to the Organisation for Economic Cooperation and Development (OECD) the global economy is expected to grow more slowly this year, with growth predicted to be 2.9% in both 2025 and 2026, compared to 3.3% last year.
The OECD cited growing uncertainty on the back of US trade policies under the Trump administration as a major cause. If there is one thing that has always been clear, it is that market participants hate uncertainty.
The report warns that more trade barriers could hurt growth, lower incomes, and slow job creation. The U.S. economy is expected to grow only 1.6% this year, down from 3.3% in 2024, due to tariffs, less immigration, and government job cuts.
The OECD noted that higher trade costs, especially in countries raising tariffs, will increase inflation, though weaker commodity prices will help offset this. While inflation is slowing in many areas, service prices remain high, and rising government spending, especially on defense, needs careful management.
These developments will only serve to reinforce the belief that a global slowdown may be on the way and could weigh further on the already fragile market sentiment we have seen at the start of the week.
Potential trade deal announcements are sorely needed to allay the fears of market participants as anticipation and anxiety continue to build.
Euro Area Inflation Drops Below ECB Target, ECB Rate Meeting Next
Inflation in the euro zone dropped below the European Central Bank's target last month, according to data on Tuesday. This supports expectations for another interest rate cut this week, even as global trade tensions create long-term price pressures.
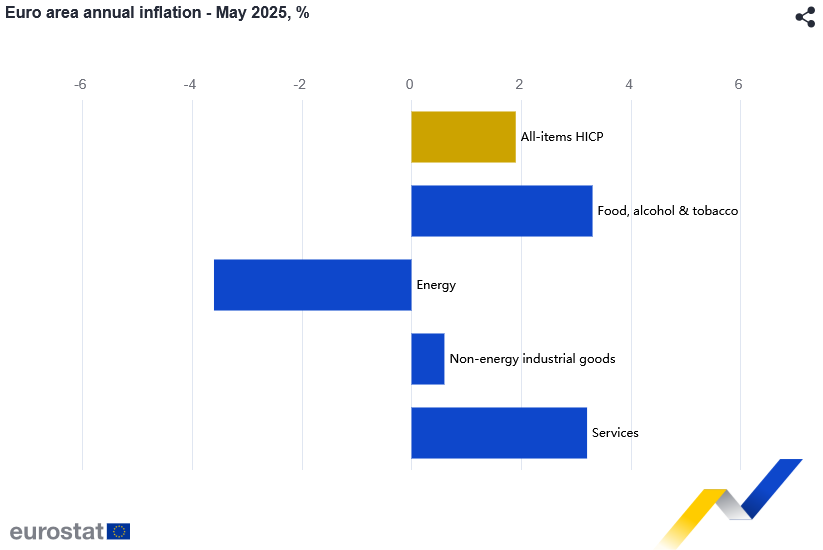
Consumer inflation in the 20 euro-using countries fell to 1.9% in May, down from 2.2% in April, due to lower energy prices and a big drop in services inflation.
Core inflation, which excludes fuel and food prices, also slowed to 2.3% from 2.7%, mainly because services price growth dropped to 3.2% from 4.0%, according to Eurostat, the EU's statistics agency.
Markets were already expecting a rate cut from the ECB on Thursday. The question following today's inflation release is whether or not ECB President Lagarde will adopt a more dovish tone regarding the ECB outlook moving forward. Will market participants begin to price in more aggressive rate cuts from the ECB for the rest of 2025?
ECB Interest Rate Probabilities
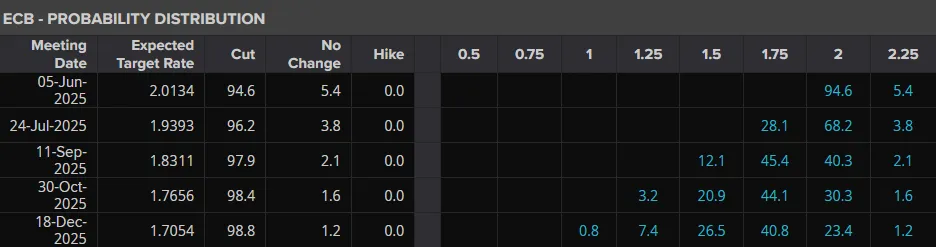
Source: LSEG
Economic Data Releases and Final Thoughts
Looking at the economic calendar, the rest of the day sees focus shift to US data.
The US session will bring JOLTS job openings and US Factory Orders which will give more insight into the US economy from a demand perspective. The question will be whether these numbers may be skewed as consumers rush to purchase ahead of impending tariffs on imported goods and raw materials.
We will also hear comments from a host of Federal Reserve Policymakers and the Chair of the SEC who testifies today before the House Appropriations Committee today. His testimony is part of the House Appropriations Committee's oversight of the SEC and its budget.
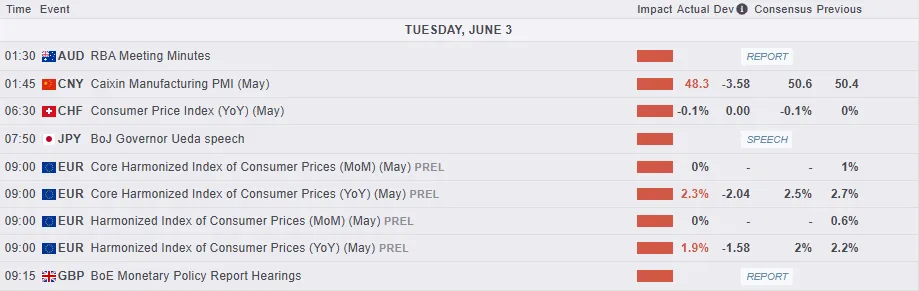
For all market-moving economic releases and events, see the MarketPulse Economic Calendar. (click to enlarge)
Chart of the Day - DAX Index
From a technical standpoint, the Dax had printed a fresh high last week around the 24387 but continues to struggle to hold convincingly above the 24000 handle.
The index is down around 0.4% at the time of writing with the 20-day MA currently providing support at the 23786 handle. This is similar to yesterday where the index bounced of the 20-day MA but failed to build on a daily candle close above the 24000 handle. Is today the day we get a sustainable move?
I would like to believe it is but given all the dynamics at play the move faces significant resistance.
Immediate support rests at 23830, 23500 and the 50 day MA around 22740.
A move beyond 24000 needs to break yesterdays highs at 24090 before a move beyond toward the 24300 and 24500 handles which could provide some resistance to bulls.
DAX Index Daily Chart, June 3, 2025
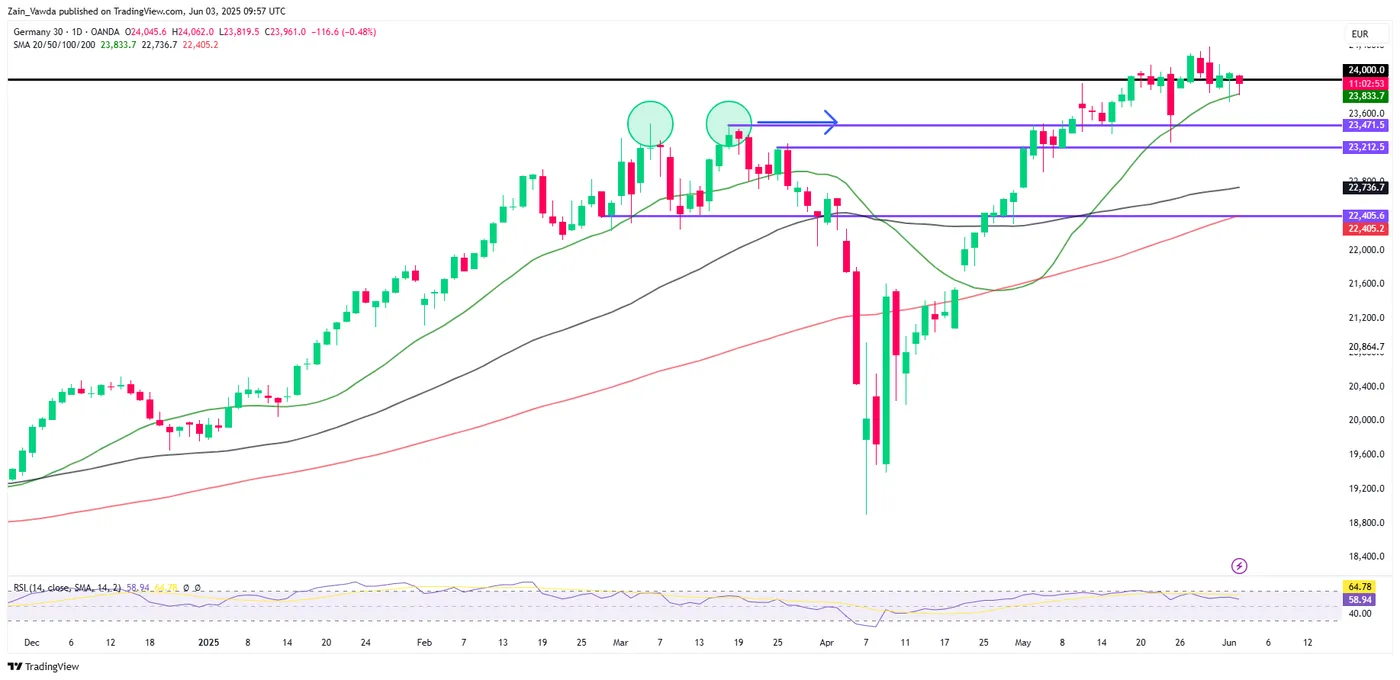
Source: TradingView.com (click to enlarge)
Bitcoin (BTCUSD) Elliott Wave : Buying the Dips at the Blue Box Zone
In this article we’re going to take a quick look at the Elliott Wave charts of Bitcoin BTCUSD published in members area of the website. BTCUSD is showing impulsive bullish sequences in the cycles from the 74,535 low, that are calling for a further strength. Recently we got a pull back that has reached the Blue Box zone,our buying area. In the following text, we will explain the Elliott Wave trading setup, including the target areas.
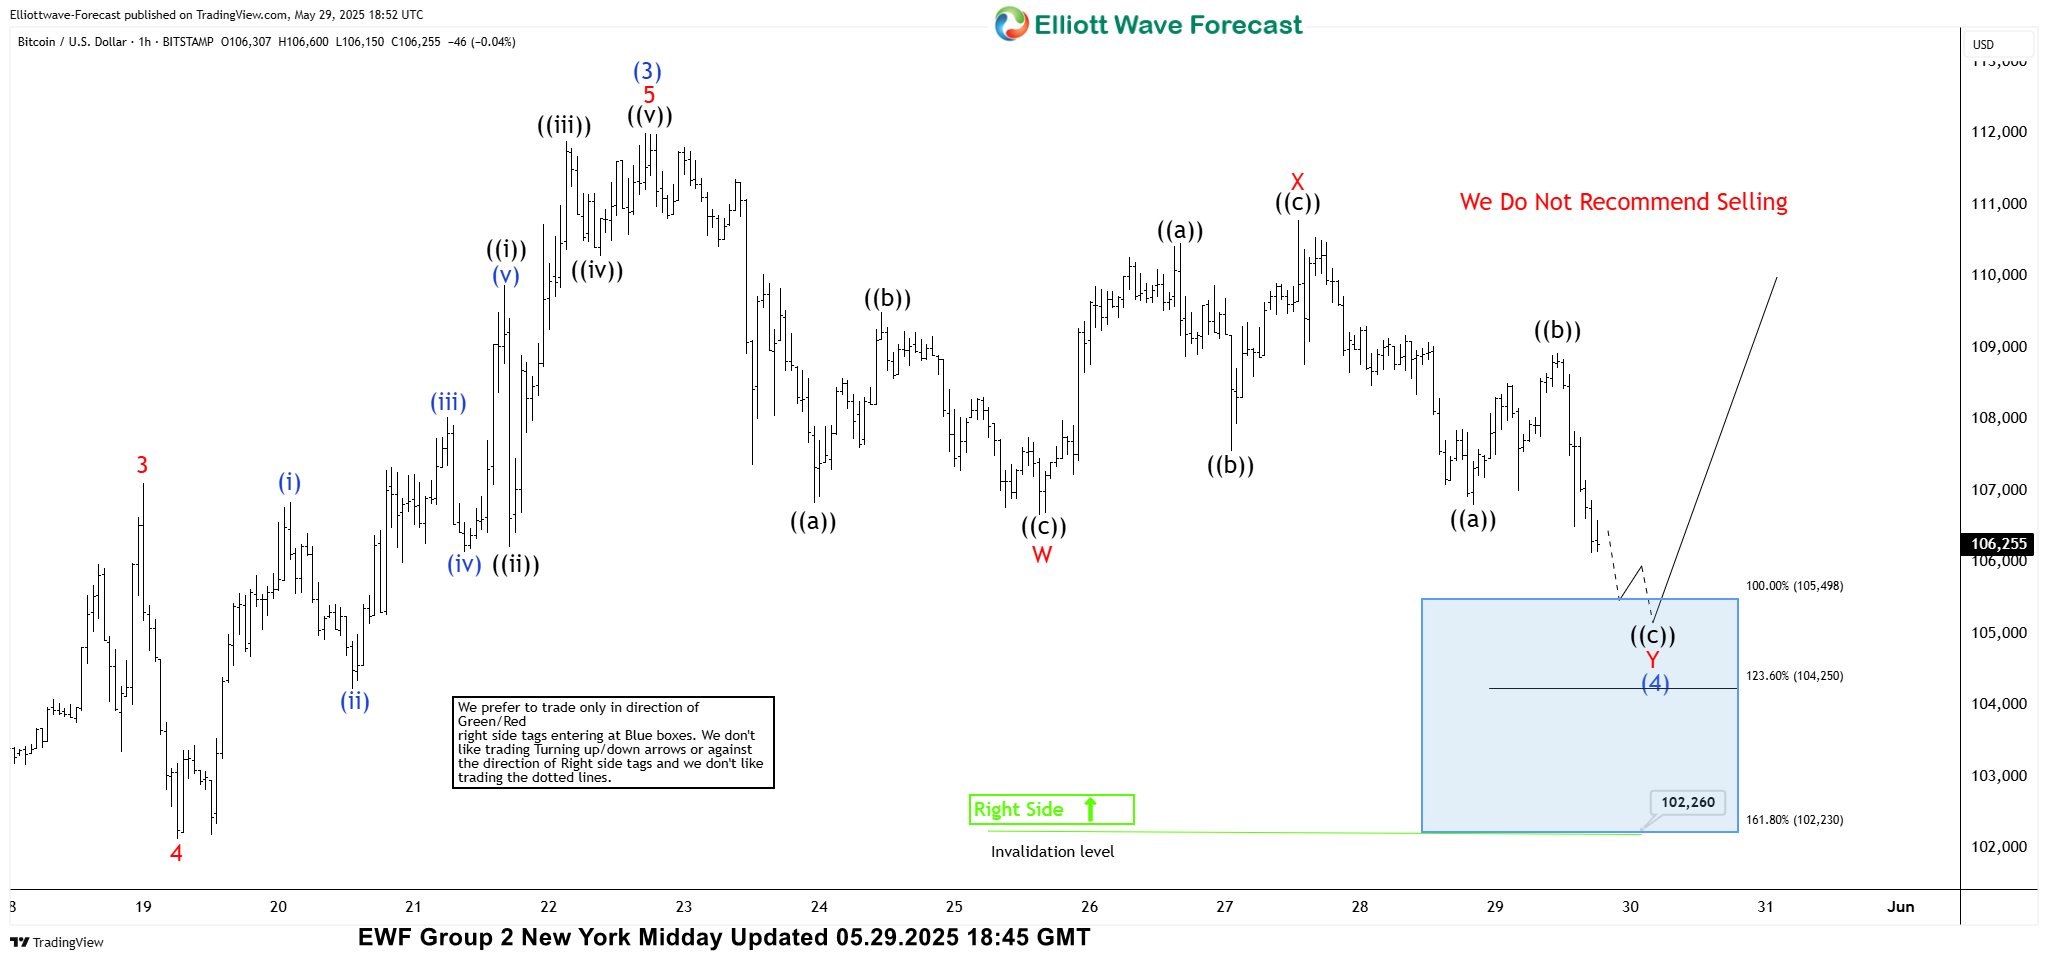
BTCUSD Elliott Wave 1 Hour Chart 05.29.2025
BTCUSD is showing an incomplete structure from the May 22nd high . The current Elliott Wave count suggests we should ideally see more downside in the short term, toward the 105,498-102,230 area -Blue Box (buying zone). As the main trend is bullish, we expect to see at least a 3 waves bounce from the buying zone. This setup could ideally lead to a rally toward new highs. We advise against selling and prefer the long side from the marked blue box (buying zone).
Official trading strategy on How to trade 3, 7, or 11 swing and equal leg is explained in details in Educational Video, available for members viewing inside the membership area.
Trading Setup Reminder
Quick reminder on how to trade our charts :
- Red bearish stamp + blue box = Selling Setup
- Green bullish stamp + blue box = Buying Setup
- Charts with Black stamps are not tradable.
BTCUSD Elliott Wave 4 Hour Chart 06.03.2025
BTCUSD made an extension toward our buying zone: 105,498-102,230 . The crypto found buyers at the Blue Box as expected, and we got a good reaction from there. With the price holding above the 103,150 low, we expect further strength to follow. Next technical area to the upside comes at 114,085
EUR/USD Set to Rise as Sentiment Turns Against the US Dollar
The EUR/USD pair rose to 1.1418 before pausing, as bearish sentiment towards the US dollar intensified following the release of disappointing US macroeconomic data and escalating trade tensions.
The dollar is under pressure from weak data and trade uncertainty
The dollar came under renewed pressure after the release of weaker-than-expected US manufacturing activity data for May, which pointed to a deeper-than-anticipated slowdown. These figures indicate that economic risks remain elevated, particularly amid continued trade policy uncertainty under President Donald Trump.
Trump’s recent decision to raise steel import tariffs to 50% sparked fresh concerns and drew sharp criticism from major trading partners, further heightening investor unease.
Tensions with China have also escalated, with Beijing rejecting Trump’s accusations of violating the interim trade deal and vowing retaliatory measures to defend its interests.
Looking ahead, markets will closely monitor a series of US macroeconomic releases due on Tuesday, including job openings, durable goods orders, and factory orders – all of which will help assess the health of the US economy.
The eurozone is also set to publish preliminary inflation data for May, which may influence euro sentiment. However, for now, investors remain optimistic about EUR/USD. Barring any surprises, the pair appears well-supported.
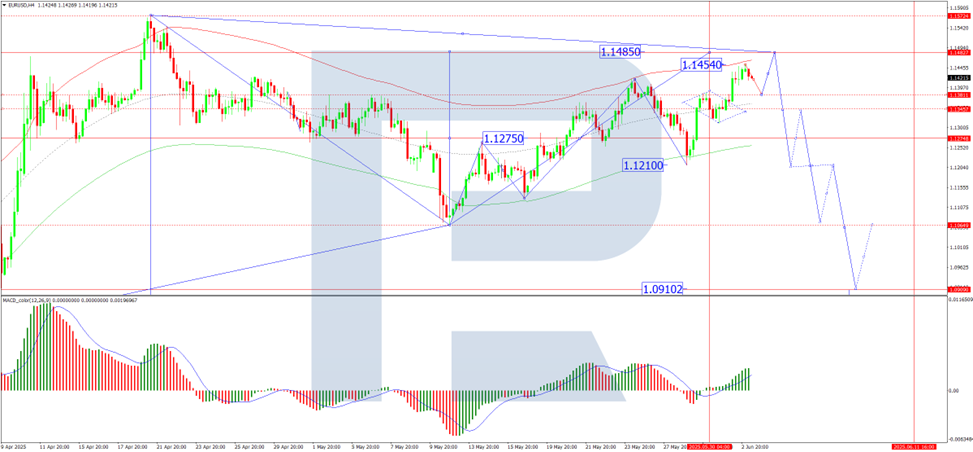
Technical analysis of EUR/USD
On the H4 chart, EUR/USD is extending the fifth wave of growth towards 1.1485. The market has already met the local target at 1.1450, and a short-term correction to 1.1380 is expected next. Once this pullback concludes, a final push towards 1.1485 is likely, marking the end of the current growth wave. From there, a new downward phase may begin, with a target at 1.1210. The MACD indicator supports this scenario, with its signal line above zero and pointing sharply upwards, indicating continued bullish momentum.
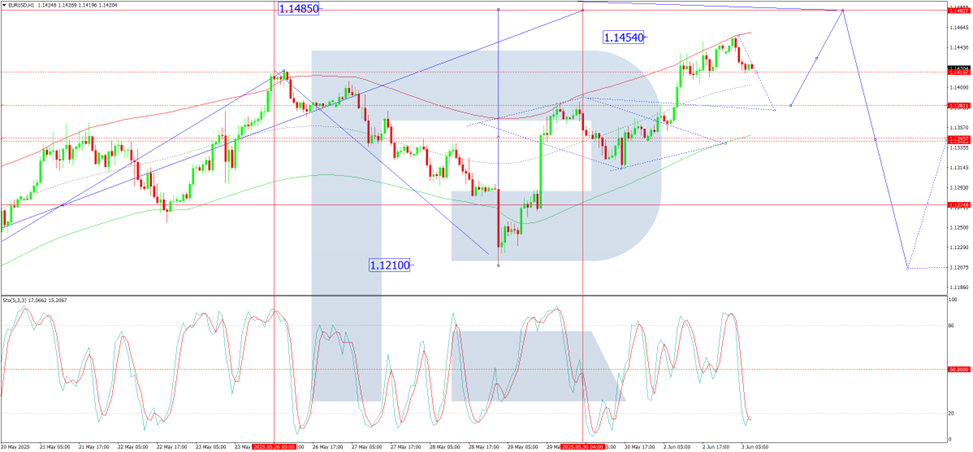
On the H1 chart, EUR/USD formed a consolidation range around 1.1350, broke to the upside, and completed the growth structure, reaching a local target of 1.1450 within the fifth wave. A correction to 1.1380 is anticipated, followed by another growth wave towards 1.1485. The Stochastic oscillator confirms this outlook, with its signal line below 20 and preparing to rise towards 80, signalling a potential bullish continuation after the correction.
Conclusion
EUR/USD remains well-positioned for further gains amid mounting US economic concerns and renewed trade tensions. The pair has short-term support at 1.1380 and faces resistance at 1.1485. A reversal could occur once the current growth wave is exhausted, with 1.1210 as a longer-term downside target. For now, technical indicators and market sentiment continue to point to further upside, particularly if upcoming US data confirms a weakening economic outlook.
Eurozone CPI falls to 1.9%, below ECB target for first time since Sep 2024
Eurozone inflation dipped back below the ECB’s 2% target for the first time since September 2024. Headline CPI fell from 2.2% yoy to 1.9% yoy in May, undershooting expectations of 2.0%. Core CPI (ex-energy, food, alcohol & tobacco) also eased more than forecast to 2.3% from 2.7%.
The disinflation was led by a sharp slowdown in services inflation, which dropped from 4.0% yoy to 3.2% yoy. Non-energy industrial goods remained unchanged at 0.6% yoy. Energy prices continued to contract at -3.6% yoy, reinforcing the broader downward pressure. Despite a slight uptick in food and alcohol inflation to 3.3% yoy, the overall picture confirms easing price momentum across key sectors.
GBP/USD Takes a Breather Before Next Bullish Move
- GBP/USD consolidates gains near 3-year high.
- Short-term bias remains positive; focus on 1.3597 resistance.
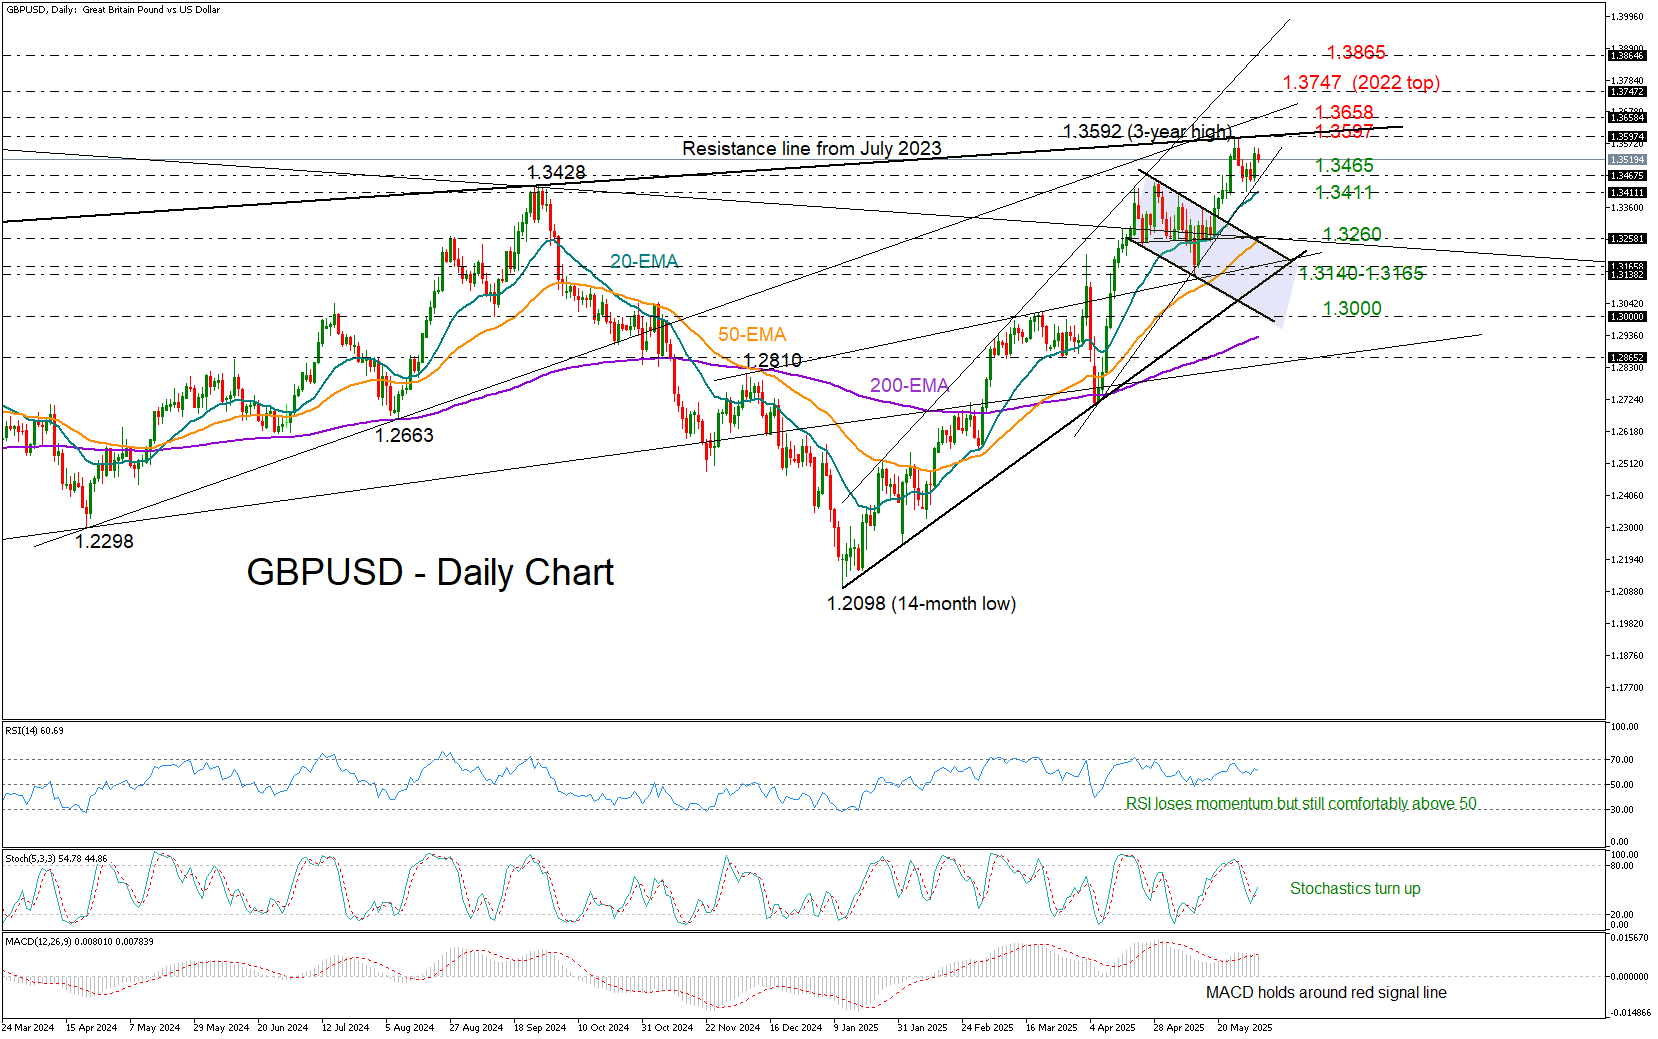
GBPUSD has eased slightly below May’s three-year high of 1.3592, but Monday’s solid rebound has renewed optimism that the bulls are still in control.
For further upside momentum, the price needs a decisive close above the resistance line from July 2023 at 1.3597, which capped gains last week. A breakout above the key constraining zone of 1.3658 could trigger a more exciting rally toward the 2022 peak at 1.3747. Beyond that, attention could shift to the ascending trendline around 1.3865.
From a technical perspective, the short-term risk remains skewed to the upside, supported by the upturn in the stochastic oscillator and the fact that the RSI continues to hover comfortably above its neutral 50 level, despite showing signs of fatigue.
Should the support trendline near 1.3465 or the 20-day exponential moving average (EMA) provide a solid base—much like in mid-May—the bulls may regain control. Otherwise, increased selling pressure could push the pair down to the 1.3260 area, where the 50-day EMA currently lies. The 1.3240–1.3165 trendline zone may serve as the last line of defense before the broader uptrend entirely loses its shine.
In summary, GBP/USD remains in a consolidation phase, with the potential for fresh highs if the 1.3597 resistance is convincingly broken.
Silver Price Hits Year-to-Date High
As shown on the XAG/USD chart, silver prices rose on Monday, surpassing the previous high of the year, which was set on 28th March at around $33.50 per ounce.
Why Is Silver Rising?
A bullish driver came from statements made by the White House. According to media reports:
→ US President Donald Trump announced on Friday evening plans to double tariffs on steel and aluminium imports to 50%, starting 4th June. This intervention in the global metals market may have also impacted silver prices, given silver’s significant industrial value.
→ Trump's claims that China violated the trade agreement reached in Geneva last month further cast doubt on the prospects of a phone call between Trump and Chinese President Xi Jinping.
Technical Analysis of the XAG/USD Chart
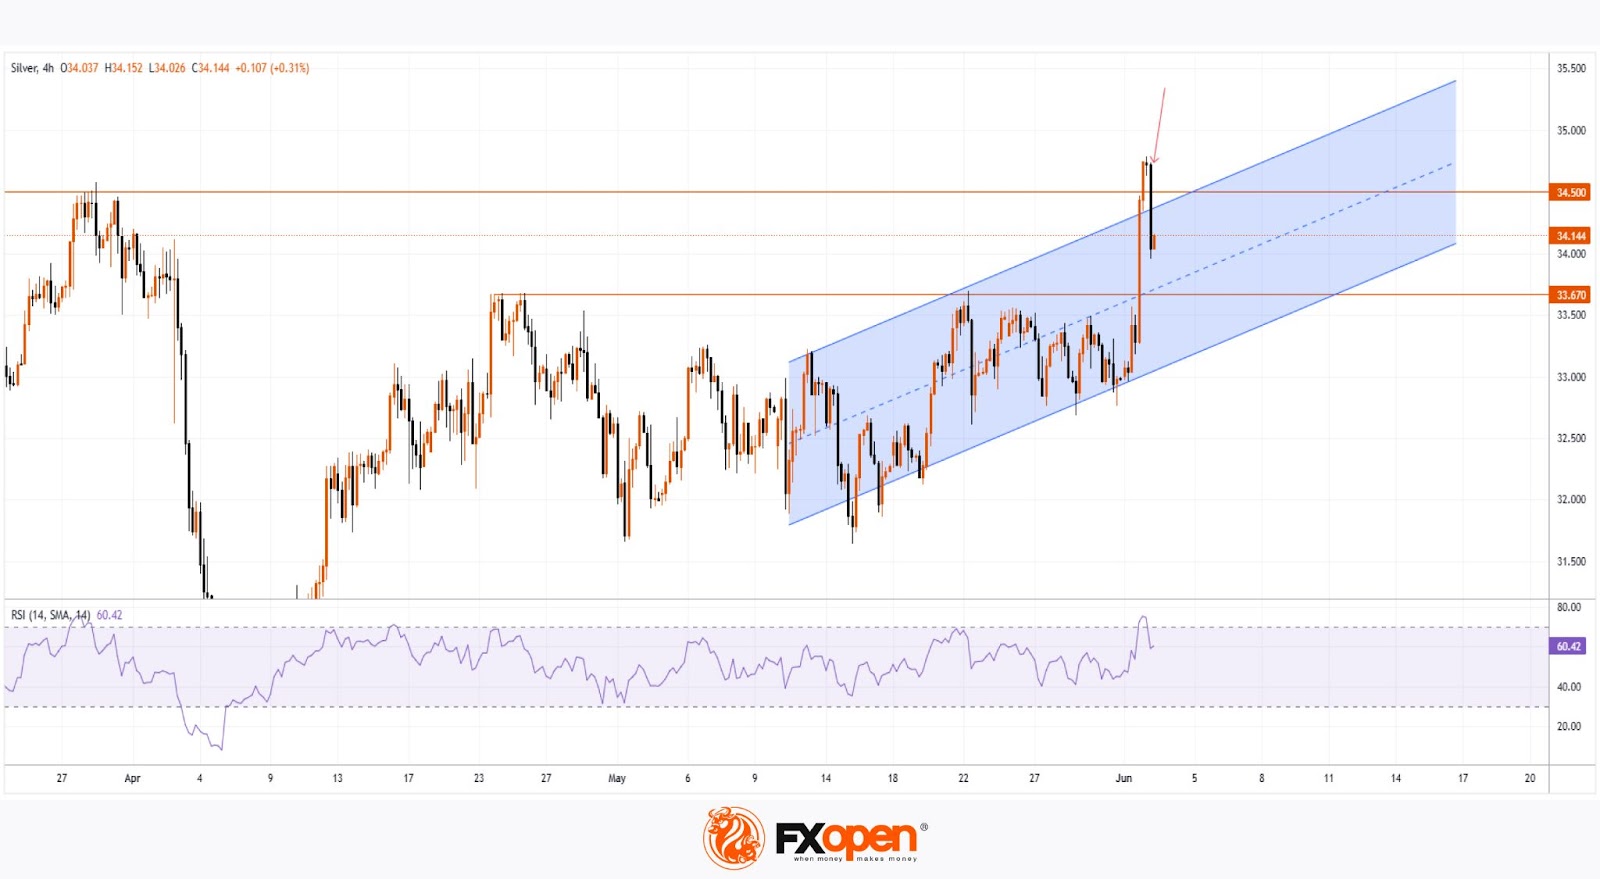
Today’s bearish candlestick (marked with a red arrow) indicates that sellers are becoming active, willing to open short positions near the 2025 high. From a technical analysis perspective, there are signs of:
→ a bearish engulfing candlestick pattern forming;
→ a false breakout above the March high (trapping bullish traders).
However, the bulls may attempt to keep the price in the upper half of the emerging ascending channel (shown in blue), relying on support from the former resistance level at $33.67.
Start trading commodity CFDs with tight spreads. Open your trading account now or learn more about trading commodity CFDs with FXOpen.
This article represents the opinion of the Companies operating under the FXOpen brand only. It is not to be construed as an offer, solicitation, or recommendation with respect to products and services provided by the Companies operating under the FXOpen brand, nor is it to be considered financial advice.
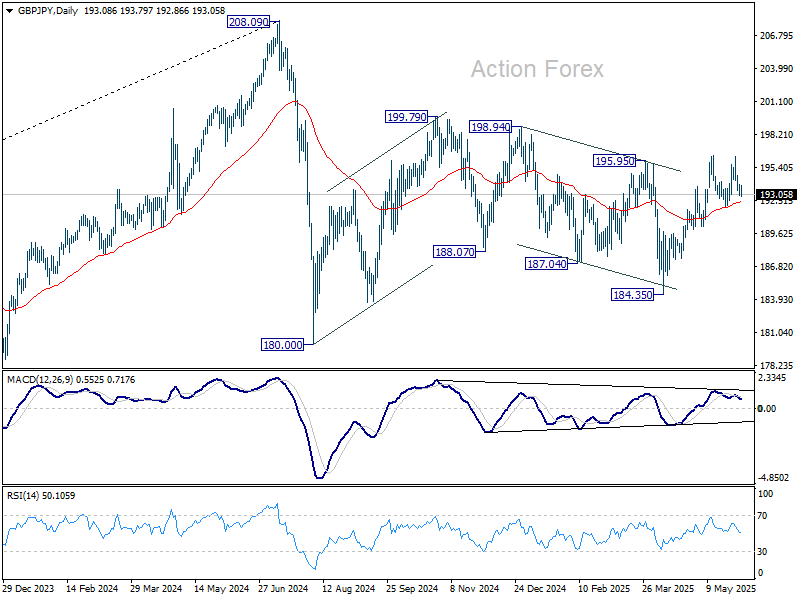
GBP/JPY Daily Outlook
Daily Pivots: (S1) 192.88; (P) 193.40; (R1) 193.78; More...
Range trading continues in GBP/JPY and intraday bias stays neutral. Further rise is in favor as long as 191.86 support holds. Firm break of 196.38 will resume whole rally from 184.35. However, firm break of 191.86 will indicate near term reversal and turn bias back to the downside.
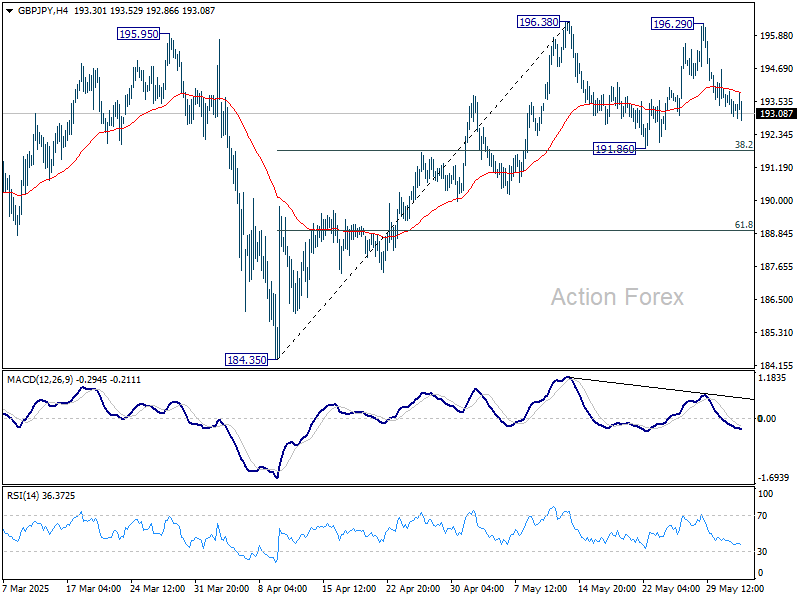
In the bigger picture, price actions from 208.09 are seen as a correction to rally from 123.94 (2020 low). Strong support should be seen from 38.2% retracement of 123.94 to 208.09 at 175.94 to contain downside. However, sustained break of 175.94 will bring deeper fall even still as a correction.
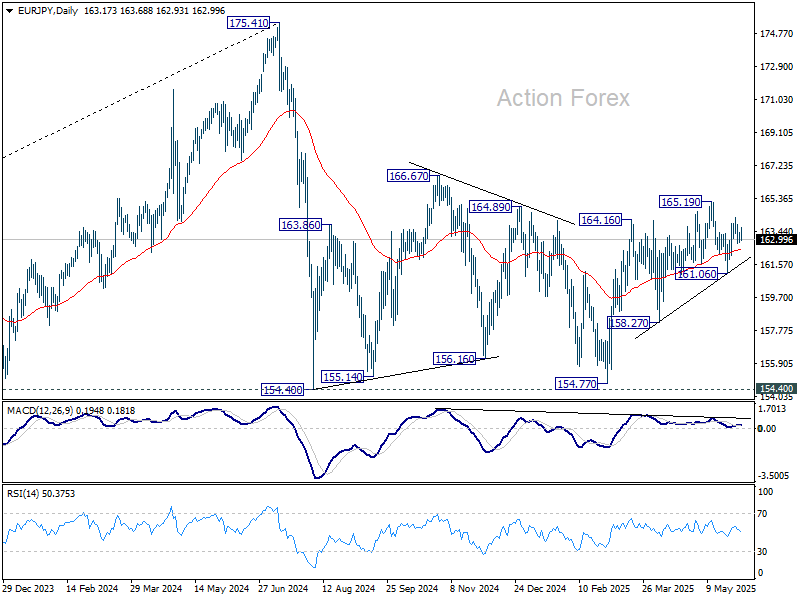
EUR/JPY Daily Outlook
Daily Pivots: (S1) 162.95; (P) 163.20; (R1) 163.55; More...
Range trading continues in EUR/JPY and intraday bias remains neutral. On the upside, above 164.24 will bring retest of 165.19 resistance first. Firm break there will resume while rise from 154.77 to 166.67 resistance. On the downside, however, break of 161.06 will resume the decline from 165.19 instead.
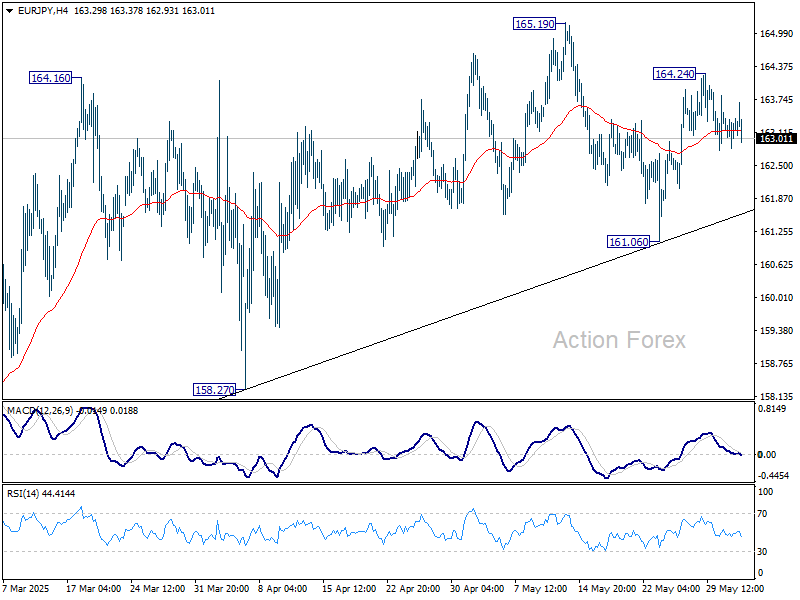
In the bigger picture, price actions from 175.41 are seen as correction to rally from 114.42 (2020 low). Strong support should be seen from 38.2% retracement of 114.42 to 175.41 at 152.11 to contain downside. However, sustained break of 152.11 will bring deeper fall even still as a correction.
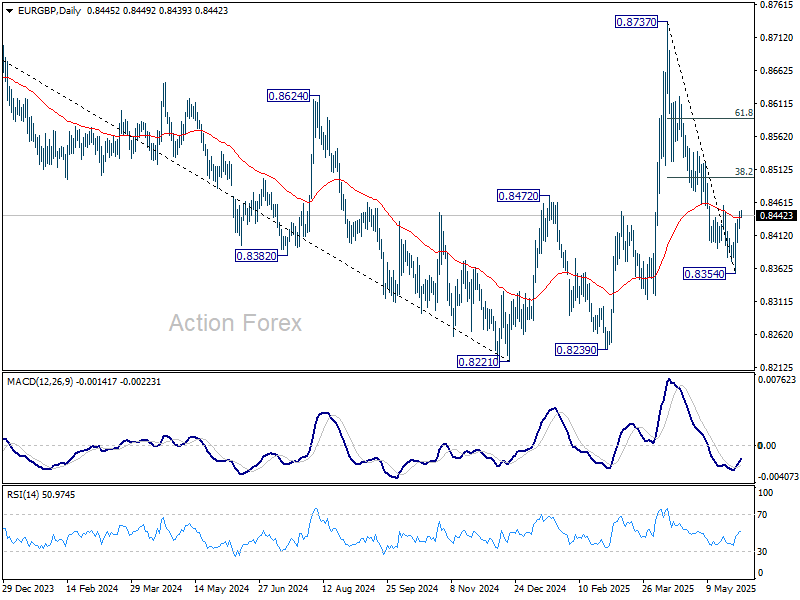
EUR/GBP Daily Outlook
Daily Pivots: (S1) 0.8432; (P) 0.8441; (R1) 0.8459; More...
EUR/GBP's rebound from 0.8354 short term bottom is in progress. Intraday bias stays on the upside for 0.8458 resistance, and then 38.2% retracement of 0.8737 to 0.8354 at 0.8500. On the downside, however, break of 0.8401 minor support will bring retest of 0.8354 low.
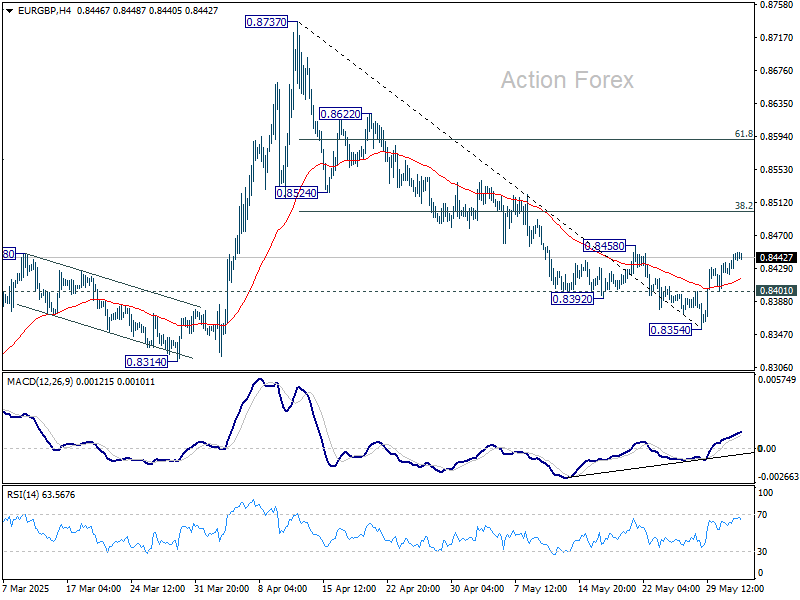
In the bigger picture, price actions from 0.8221 medium term bottom are merely forming a corrective pattern. There is no clear momentum to break through 0.8201 key support (2022 low) yet. Hence, range trading is expected between 0.8221/8737 for now.
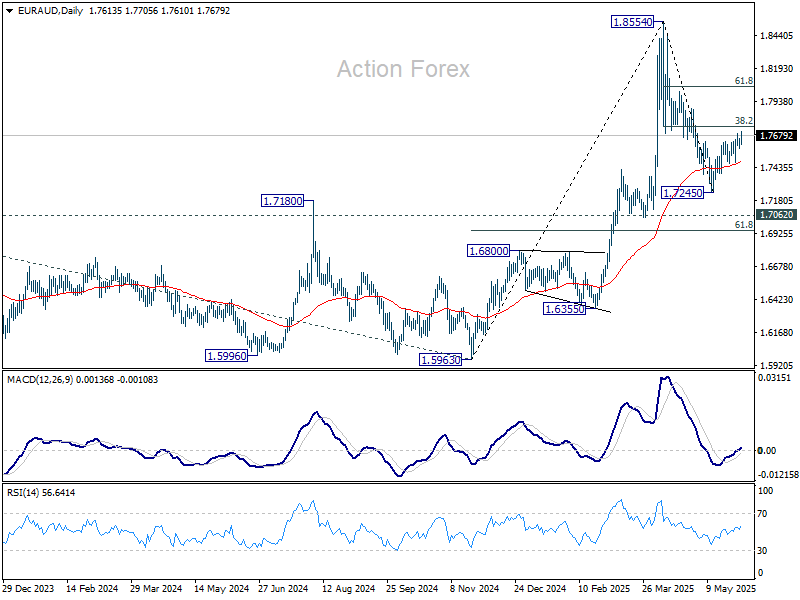
EUR/AUD Daily Outlook
Daily Pivots: (S1) 1.7577; (P) 1.7617; (R1) 1.7652; More...
EUR/AUD's rebound from 1.7245 continues today and intraday bias stays on the upside. . Firm break of 38.2% retracement of 1.8554 to 1.7245 at 1.7745 will solidify the case that fall from 1.8554 has completed as a correction. Next target is 61.8% retracement at 1.8054. On the downside, however, break of 1.7460 support will bring retest of 1.7245 instead.
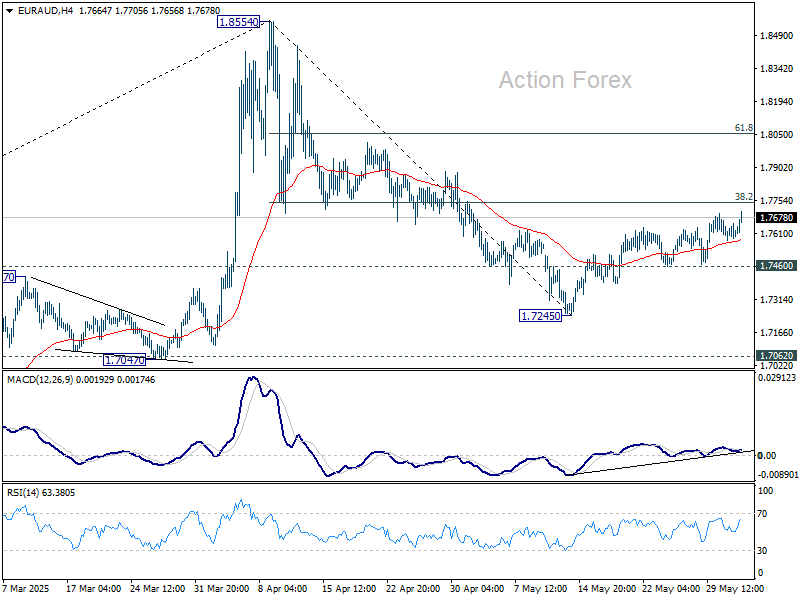
In the bigger picture, as long as 1.7062 resistance turned support (2023 high) holds, up trend from 1.4281 (2022 low) should still be in progress. Break of 1.8554 is expected after the whole corrective pattern from there completes. However, sustained break of 1.7062 will bring deeper fall back to 1.5963 support.