Sample Category Title
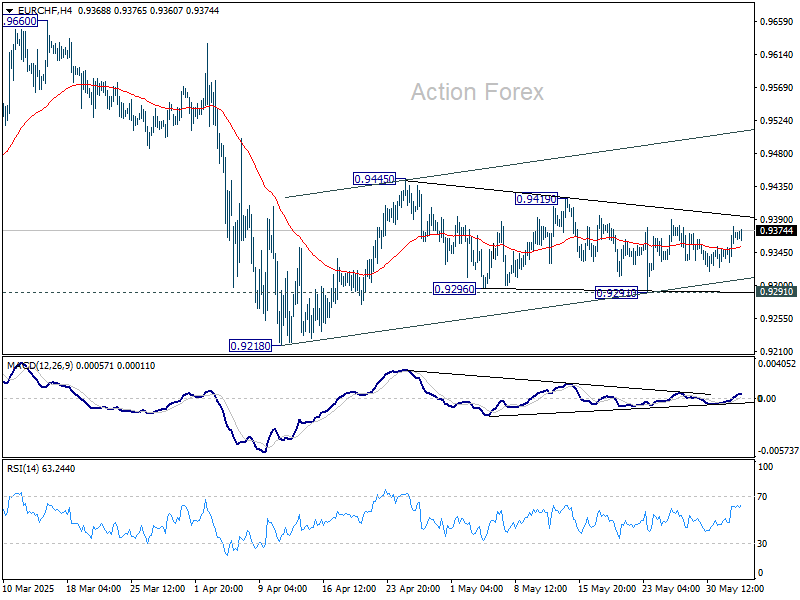
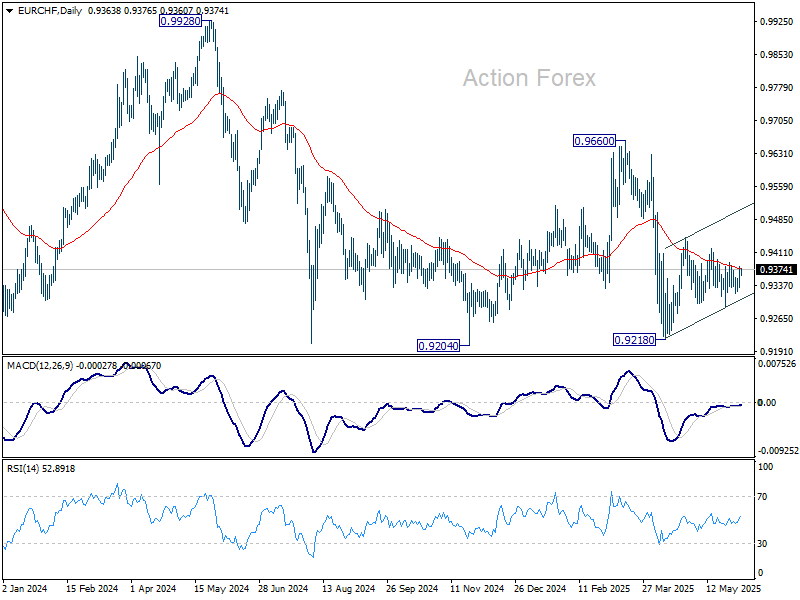
EUR/CHF Daily Outlook
Daily Pivots: (S1) 0.9343; (P) 0.9362; (R1) 0.9392; More....
Intraday bias in EUR/CHF remains neutral as range trading continues. Rise from 0.9218 might continue, either as a correction to fall from 0.9660, or the third leg of the pattern from 0.9204. On the upside, above 0.9419 will target 0.9445 resistance and above. Nevertheless, on the downside, firm break of 0.9291 will bring retest of 0.9218 low.
In the bigger picture, prior rejection by long-term falling channel resistance (now at 0.9527) retains medium term bearishness. That is, down trend from 1.2004 (2018 high) is still in progress. Firm break of 0.9204 (2024 low) will confirm resumption. This will remain the favored case as long as 0.9660 resistance holds.
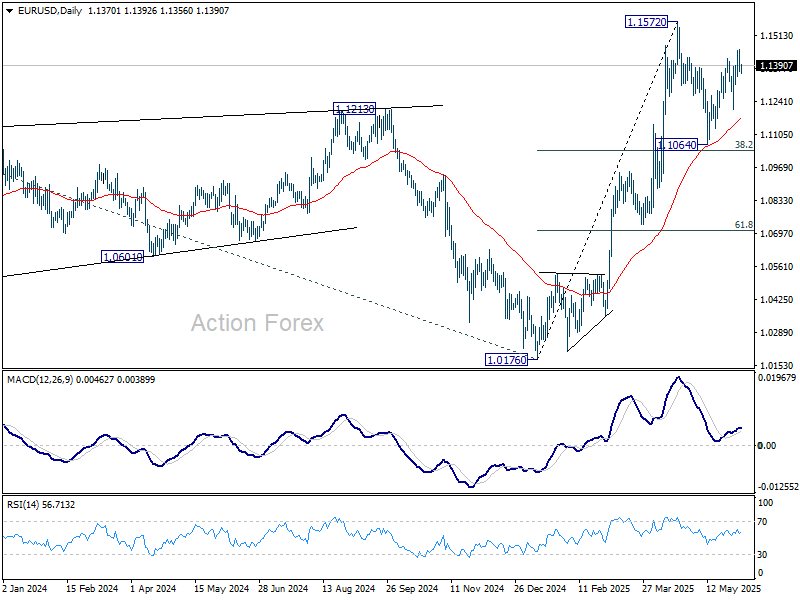
EUR/USD Daily Outlook
Daily Pivots: (S1) 1.1338; (P) 1.1397; (R1) 1.1429; More...
Intraday bias in EUR/USD remains neutral for the moment. Rebound from 1.1064 could extend higher, but strong resistance should be seen from 1.1572 to limit upside, at least on first attempt. On the downside, break of 1.1209 support will indicate that the corrective pattern from 1.1572 has started the third leg, and target 1.1064 support.
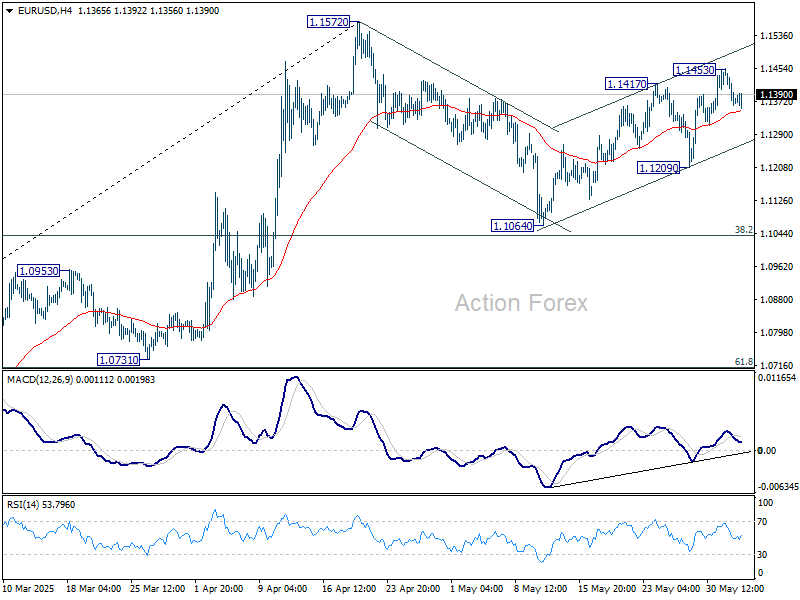
In the bigger picture, rise from 0.9534 long term bottom could be correcting the multi-decade downtrend or the start of a long term up trend. In either case, further rise should be seen to 100% projection of 0.9534 to 1.1274 from 1.0176 at 1.1916. This will now remain the favored case as long as 55 W EMA (now at 1.0856) holds.
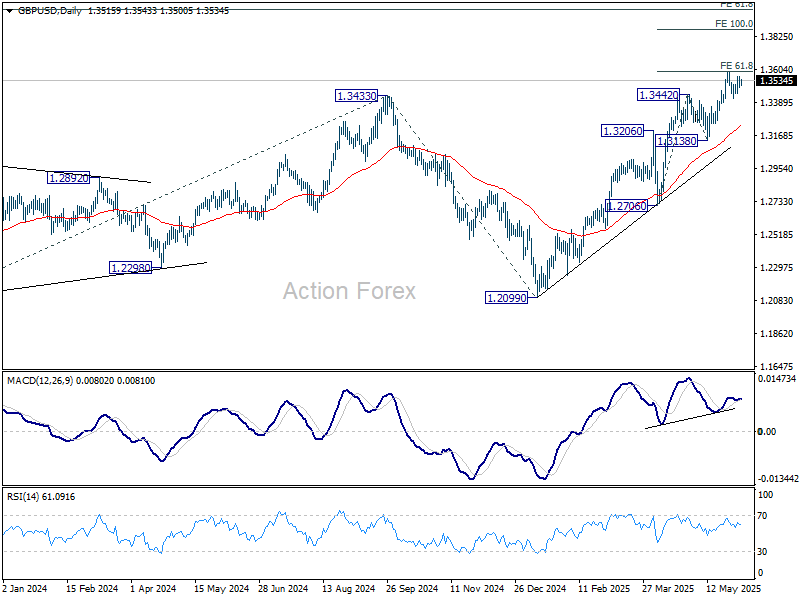
GBP/USD Daily Outlook
Daily Pivots: (S1) 1.3488; (P) 1.3523; (R1) 1.3555; More...
Intraday bias in GBP/USD remains neutral at this point. With 1.3389 support intact, further rise is expected. On the upside, firm break of 1.3592 will resume larger up trend to 100% projection of 1.2706 to 1.3442 from 1.3138 at 1.3874. However, decisive break of 1.3389 will confirm short term topping, and turn bias back to the downside for 1.3138 support instead.
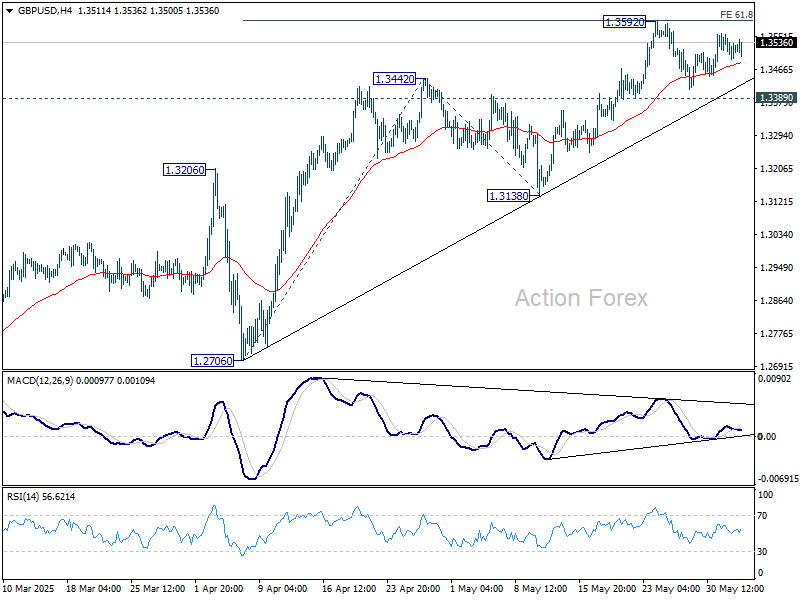
In the bigger picture, up trend from 1.3051 (2022 low) is in progress. Next medium term target is 61.8% projection of 1.0351 to 1.3433 from 1.2099 at 1.4004. Outlook will now stay bullish as long as 55 W EMA (now at 1.2866) holds, even in case of deep pullback.
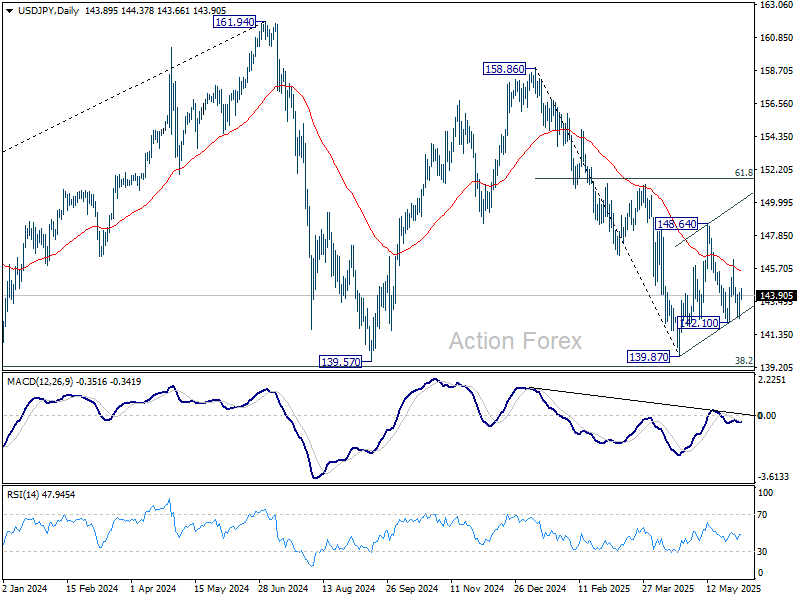
USD/JPY Daily Outlook
Daily Pivots: (S1) 142.89; (P) 143.50; (R1) 144.62; More...
Intraday bias in USD/JPY stays neutral at this point. On the upside, above 146.27 will target 148.64 resistance first. Firm break there will resume the rebound from 139.87. Nevertheless, break of 142.10 will bring deeper fall back to 139.87 low.
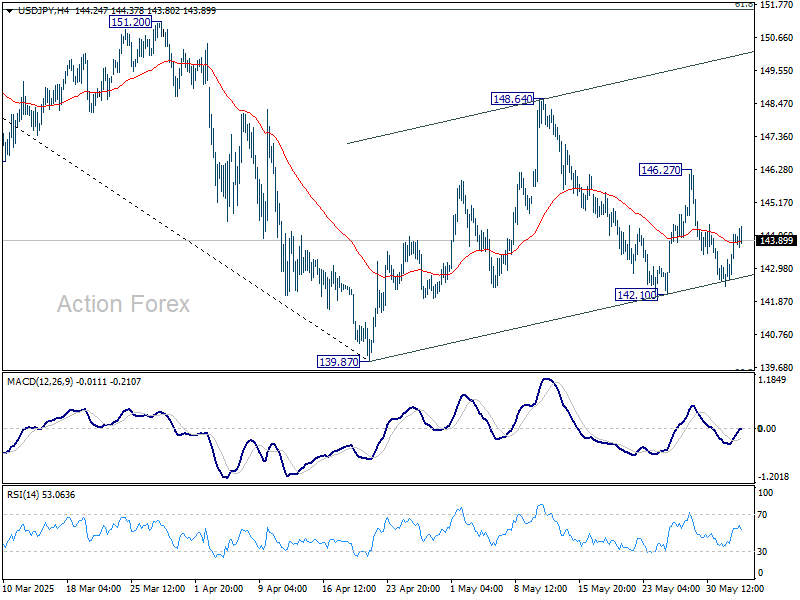
In the bigger picture, price actions from 161.94 are seen as a corrective pattern to rise from 102.58 (2021 low), with fall from 158.86 as the third leg. Strong support should be seen from 38.2% retracement of 102.58 to 161.94 at 139.26 to bring rebound. However, sustained break of 139.26 would open up deeper medium term decline to 61.8% retracement at 125.25.
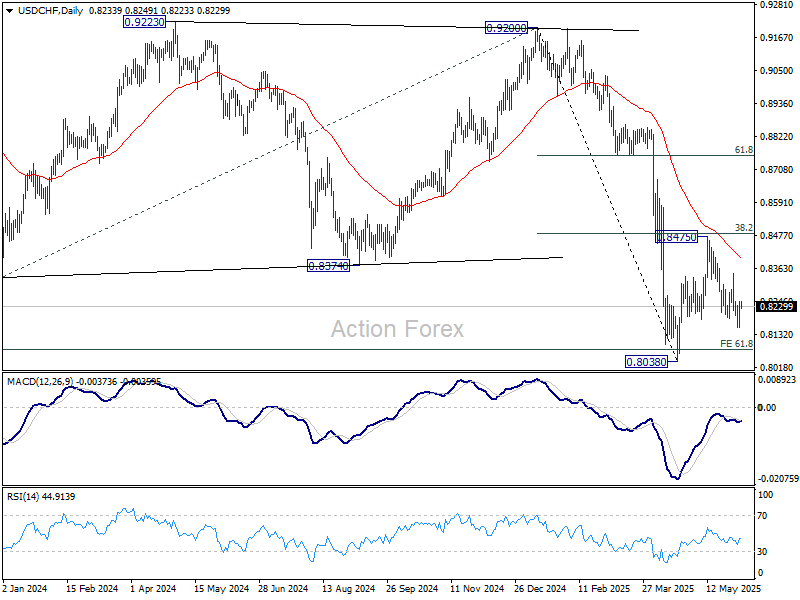
USD/CHF Daily Outlook
Daily Pivots: (S1) 0.8184; (P) 0.8216; (R1) 0.8273; More….
Intraday bias in USD/CHF remains neutral for the moment. . Fall from 0.8475 could still extend lower, and break of 0.8156 will target 0.8038 low. But strong support should be seen from there to bring rebound, at least on first attempt. On the upside, break of 0.8346 resistance will extend the corrective pattern from 0.8038 with another rising leg.
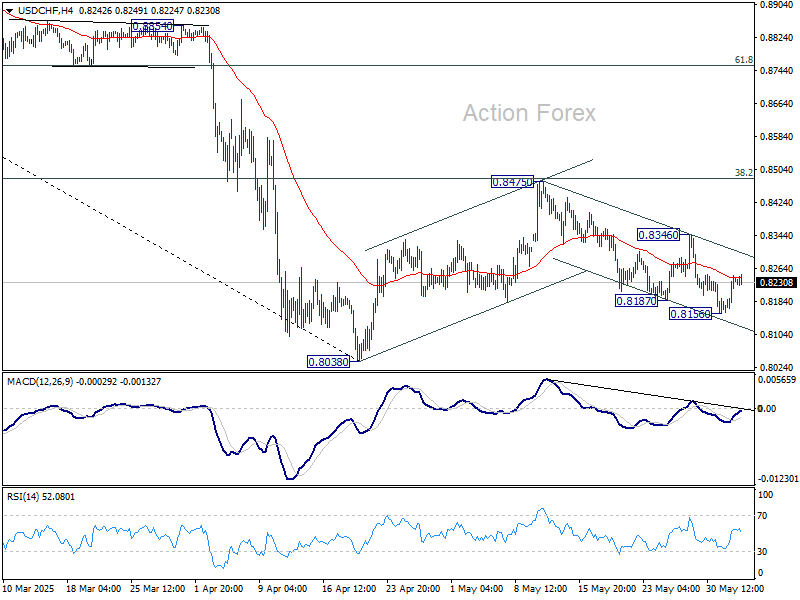
In the bigger picture, long term down trend from 1.0342 (2017 high) is still in progress and met 61.8% projection of 1.0146 (2022 high) to 0.8332 from 0.9200 at 0.8079 already. In any case, outlook will stay bearish as long as 55 W EMA (now at 0.8732) holds. Sustained break of 0.8079 will target 100% projection at 0.7382.
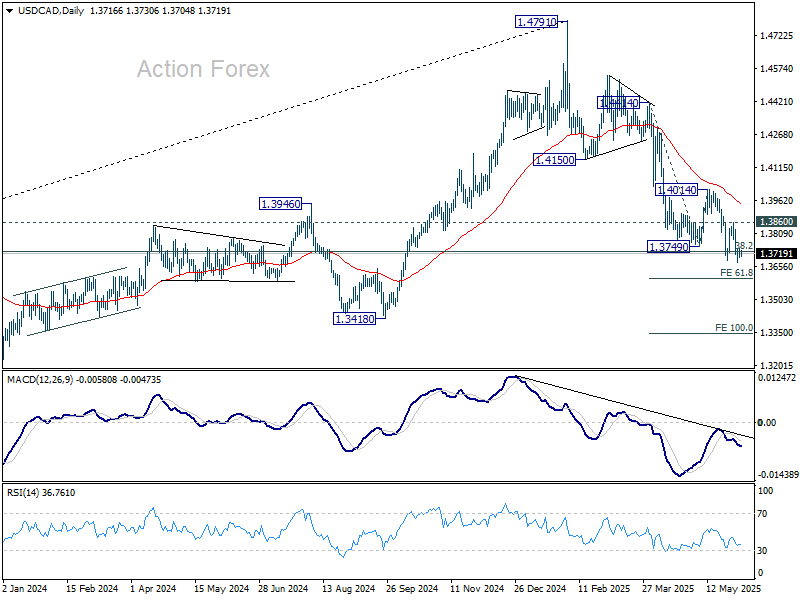
USD/CAD Daily Outlook
Daily Pivots: (S1) 1.3677; (P) 1.3710; (R1) 1.3745; More...
Intraday bias in USD/CAD remains on the downside this point. Current fall from 1.4791 should target 61.8% projection of 1.4414 to 1.3749 from 1.4014 at 1.3603. For now, outlook will stay bearish as long as 1.3860 resistance holds, in case of recovery.
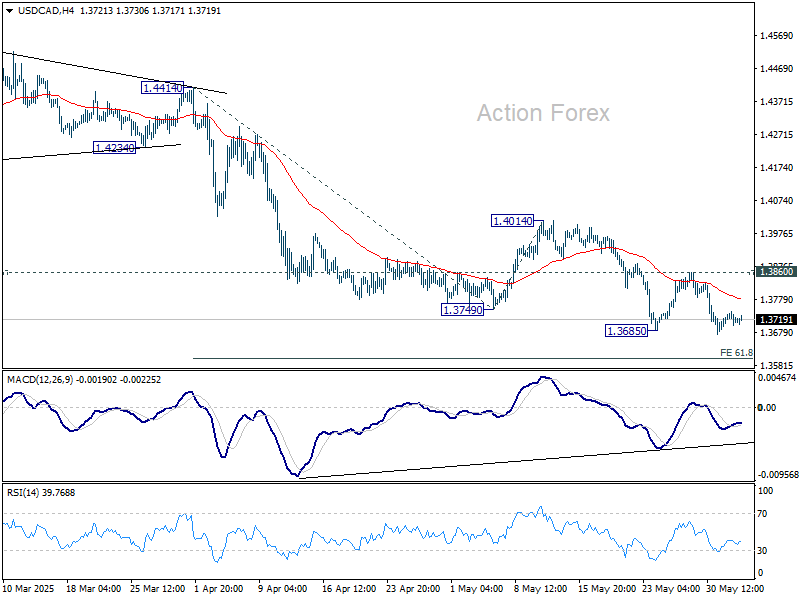
In the bigger picture, price actions from 1.4791 medium term top could either be a correction to rise from 1.2005 (2021 low), or trend reversal. In either case, further decline is expected as long as 1.4014 resistance holds. Firm break of 38.2% retracement of 1.2005 (2021 low) to 1.4791 at 1.3727 will pave the way back to 61.8% retracement at 1.3069.
Trump’s Import Tariff Raise on Steel and Aluminum Kicks in Today
Markets
Strong JOLTS data kicked of the US economic calendar yesterday. Job openings in April unexpectedly rose from an upwardly revised 7.2 mln to just shy of 7.4 mln. The broader trend – fluctuating between 7-8 mln and near the pre-pandemic high – is indicative of ongoing labour market resilience and strengthens ongoing Fed talk of “wait and see”. US yields turned a small intraday 2-3 bps decline into 1-2 bps rise. European yield changes were negligible on a net daily basis. Below-consensus European inflation numbers barely changed money market rate cut bets. Tomorrow’s 25 bps reduction is fully priced in with at least another such move discounted for later this year. Gilts outperformed both Bunds and Treasuries with the long end of the curve showing declines of up to 4.3 bps. We suspect it is related to Bank of England Mann’s speech that opened the debate for a slower QT pace. The US dollar advanced against all of its most important peers in a technically insignificant move that was drawn out across the session. The trade-weighted index rose from 98.6 to 99.24, EUR/USD ventured from 1.144 to 1.137. Sterling withstood the relative interest rate support loss well. EUR/GBP slid from 0.844+ to 0.841.
Trump’s import tariff raise on steel and aluminum to 50% from 25% kicks in from today. It sets a challenging stage for the freshly elected South Korean president Lee Jae-myung. SK is a key steel exporter to the US and additionally faces an across-the-board Liberation Day 25% levy if trade talks with the US fail. Lee during his campaign over the last couple of weeks promised a $25bn stimulus package (>1% of GDP) to revive the economy and created a sense of a generally looser fiscal policy than under his predecessor. Lee’s victory is sending reflationary vibes through SK markets. Stocks outperform (2.5%), the SK currency leads the Asian scoreboard and government bond yields rise up to 14 bps at the long end. Moves in core bond and FX markets are muted ahead of another batch of US eco data. The ADP job report (+114k expected) serves as a prelude to the official payrolls report this Friday. The May services ISM (seen at 52.0 from 51.6) is of bigger importance to markets. A stagflation narrative similar to Monday’s manufacturing ISM could again weigh both the dollar and US Treasuries. EUR/USD 1.1473 is intermediate resistance ahead of the April 1.1573 high. The Fed’s Beige Book release marks the start of the June policy meeting cycle.
News & Views
Australian GDP growth slowed down more than expected in Q1 2025: from 0.6% Q/Q in Q4 2024 to 0.2% Q/Q (+1.3% Y/Y). The Bureau of Statistics indicated that public spending recorded the largest detraction from growth since the Q3 2017. Government spending remained flat while investments declined by 2% on the quarter. Extreme weather events reduced domestic final demand and exports. Weather impacts were particularly evident in mining, tourism and shipping. Household spending slowed from 0.7% Q/Q to 0.4% with spending on essentials continuing to be amongst the highest contributors. Households also spent more on energy because of warmer than average weather and a decline in electricity rebates. The household saving ratio rose from 3.9% to 5.2% with gross disposable income up 2.4%. Net trade detracted 0.1 ppt from growth especially as coal and LNG exports were impacted by weather disruptions to production and shipping. Private investments rose by 0.7% Q/Q, led by housing. The weather-influenced GDP data don’t rule anything in or out for the Reserve Bank of Australia. They cut the policy rate twice now (February & May), with money markets convinced that the central bank has room to accelerate with first back-to-back action in July. AUD/USD sticks within the extremely tight 0.6350-0.6550 range in place since mid-April.
German Finance minister Klingbeil will today present corporate tax incentives at a cabinet meeting which could cost around €46bn in total by 2029 according to government estimates seen by the Financial Times. The tax breaks come on top of the >€1tn debt-funded public spending plans. According to the FT, companies would be able to deduct 30% of the cost of new machinery and other equipment from their tax bill annually between 2025 and 2027 (starting July 1st). From 2028, the federal corporate tax rate of 15% would then decrease by one point each year to 10%. Companies will also be allowed to depreciate 75% of the purchase price of new electric vehicles on year one, and thus reduce their taxable income. The government also intends to introduce more advantageous tax incentives for R&D spending.
Equities Up Regardless of Trade Worries, Mixed Data
Market performance was surprisingly strong yesterday, especially considering the day began in the US with a sharp downgrade in global growth projections from the OECD. The organization cited ‘substantial increases in trade barriers, tighter financial conditions, and weakened business and consumer confidence’ as key concerns. That neatly sums up why many expect a global economic slowdown this year—led by the US.
As such, the OECD expects the US to be the hardest hit among major economies. Japan is also seen feeling the pinch of trade tensions, while projections for Europe remain relatively steady. The euro area is expected to continue growing slowly, and the gap between US and European growth should narrow as the US economy decelerates. That’s also what the euro’s appreciation against the dollar has been signaling since the start of the year.
The EURUSD pair struggles to break through the 1.15 psychological level, with strong offers above 1.1450. But if US trade disruptions persist, those offers could give way, sending the pair into the 1.15–1.20 range by summer. Judging by the latest developments, that scenario looks increasingly plausible—if undesirable. As of today, Trump’s new tariffs on steel and aluminium—doubling the rate from 25% to 50%—take effect.
So why are US stocks still being bought? There are several explanations: FOMO: Fear of missing out on the rally, TACO: Trump Always Chickens Out, or economic data/Federal Reserve (Fed) hopes?
But trade headlines were negative yesterday while the economic data was mixed and the Federal Reserve (Fed) is reluctant to move due to rising inflation expectations. So it’s probably FOMO—and it feels fragile.
Today, investors will watch the ADP employment report and ISM non-manufacturing data for fresh insights into US economic strength. Strong numbers may support further gains while soft figures Maybe could trigger a pullback. Or maybe not. Markets seem to have their own agenda, and the fear of missing a potential rally appears enough to fuel optimism—no matter how weak the forecasts, or the data.
And the economic data is more concerning than encouraging: following a surprise contraction in Chinese manufacturing PMI earlier this week, Australia reported softer-than-expected Q1 growth this morning. The Bank of Canada (BoC) also meets today, with some expecting a 25bp rate cut. Since surveys are split, the move isn’t fully priced in. A cut could lift the loonie by fueling growth optimism, while a hold could prompt a bit of re-positioning. But with the US dollar under pressure, the USDCAD looks ready for further declines. In June 2021—four years ago—the pair traded near the 1.20 level. It now sits at a critical juncture. A break below 1.37—the 38.2% Fibonacci retracement of the four-year rise - would put the pair into a long-term bearish consolidation phase, possibly driving it toward the 1.30–1.33 range. That would fit the broader narrative of expected US dollar weakness.
In equities, US stocks remain in demand, with tech leading the charge. The Nasdaq is inching toward its February all-time high, driven by Nvidia’s rally past $140. Nvidia has now overtaken Microsoft to become the world’s most valuable company, with a market cap around $3.45 trillion. Its P/E ratio sits near 45—not extreme for a speculative tech name with real earnings behind the story. For AI investors, Nvidia remains a strong conviction play. In Europe, luxury goods are losing ground to defense names. Germany’s Rheinmetall has joined the Euro Stoxx 50, while Kering has dropped out. Weak demand from Chinese consumers and higher US import taxes are weighing on the luxury sector. Meanwhile, rising geopolitical risks and European pledges to boost defense spending are attracting flows into defense stocks. Beyond that, softer inflation and looming European Central Bank (ECB) rate cuts continue to support Stoxx 600 valuations, though the upside in most of these names can’t match the momentum of US tech leaders, and there are concerns that the European defense spending plans may have already been mostly priced in.
EA Inflation Declined, and US JOLTS Surprised to the Topside
In focus today
In the US, the ADP private sector employment report will provide markets with the first sense of what to expect from Friday's upcoming May Jobs Report. The ISM services index for May will also be released, the flash PMI pointed towards a small uptick. Atlanta Fed's Bostic is scheduled to give remarks at a local Fed Listens event.
In the euro area, we receive the final services and composite PMI data for May. The final manufacturing PMI on Monday showed the same reading as the preliminary release, namely 49.4, so we also expect the composite PMI to be close to the preliminary data.
In Canada, the Bank of Canada will publish its interest rate decision. Analysts are split on an unchanged decision and a 25bp cut. We lean towards the former but highlight that it is a low-conviction call amid continued trade uncertainty.
In China, PMI service from Caixin will be released overnight.
In Denmark, we will receive the unemployment indicator for May from the Danish Agency for Labour Market, our first status on the Danish labour market in May.
In Sweden, we will receive services PMI for May at 8.30 CET. The manufacturing sector saw a slight decline (staying nearly unchanged on Monday), maintaining a solid figure of 53.6. The service sector has been weaker compared to manufacturing, staying below 50 for two consecutive months. Employment has risen in manufacturing but has been weak in the service sector.
The Danske Morning Mail will not be released tomorrow, 5 June, due to Constitution Day, but we are back with an update on Friday. Tomorrow, we will look out for the ECB monetary policy meeting, where we anticipate a 25bp cut in the leading policy rate to 2.0%. Also, in the US, the May Challenger report for layoff announcements as well as the weekly jobless claims will provide further sense of the status of labour markets.
Economic and market news
What happened overnight
At Danske Bank, we published our new macro forecasts for the Nordic countries and the major economies. Read more in Nordic Outlook - Normalisation with tariff risks, 4 June.
What happened yesterday
In the euro area, inflation declined to 1.9% y/y in May, in line with most recent forecasts following country data but below the initial consensus forecast of 2.0% y/y. Core inflation declines to 2.3% y/y from 2.7% y/y, below expectations of a decline to 2.4%. The decline in both headline and core inflation was mainly due to services inflation, that fell from 4.0% y/y to 3.2% y/y. Euro area unemployment in April remained unchanged at 6.2%, in line with expectations.
In the US, JOLTS job openings surprised to the topside, coming in at 7.391M in April (prior: 7.2M., cons.: 7.1M). Hiring also ticked a bit higher against expectations after 'Liberation Day'. That said, involuntary layoffs edged modestly higher as well (1.79M, from 1.59M).
In Switzerland, inflation decreased in line with expectations, reaching deflationary territory for the first time since 2021. Headline inflation came in at -0.1% y/y (cons: -0.1%, prior: 0.0%) and core inflation at 0.5% y/y (prior: 0.6% y/y). With this print, inflation has come in lower than SNB projections yet again and we expect a 25bp cut at the next meeting on 19 June, bringing the policy rate to 0%.
The OECD has lowered its global growth forecast to 2.9% for 2025-2026, citing the impact of Trump's trade policies. US growth is expected to slow to 1.6% this year due to tariff-related uncertainties. China's growth is partly offset by subsidies and welfare spending, while the euro area's outlook remains stable. Increased protectionism could further weaken growth and heighten inflation pressures.
In the Netherlands, the Dutch government collapsed after Geert Wilders' PVV party left the coalition, likely leading to new elections in October or November. Wilders accused coalition partners of not supporting his strict immigration policies. Prime Minister Dick Schoof resigned, leaving a caretaker administration that may delay NATO-related defence spending decisions. The political landscape remains divided, with immigration a longstanding contentious issue in Dutch politics.
Equities: Equities were higher, and cyclicals made a comeback on Tuesday. S&P 500 added 0.6% (Russell 2000 1.6%) while Europe lagged with Stoxx 600 0.1%. This was the first time in a week that cyclicals did better than defensives on a global scale. It has been three weeks since cyclicals beat defensives numerous sessions in a row. Similarly, investors looked for beta in small caps for the first time in a long time yesterday, with small caps outperforming cyclicals by the double. Although headline indices have carried on, the de-risking taking place in sectors and styles has brought technicals to more sustainable levels. Just take the Fear and Greed index which has returned to almost neutral levels. Asian markets are in risk-on this morning (Taiwan and Kospi up 2-3%) as investors are cheering the election outcome, as it is likely to entail more fiscal stimulus. US futures are a notch lower this morning, while European futures indicate some catch-up.
FI and FX: Stronger domestic data, with hirings advancing to the highest level in almost a year, prompted a turnaround in the greenback yesterday. EUR/USD fell back below 1.14 again and USD/JPY breached 144 anew. 30Y US treasuries are once again testing the 5%-level, which we expect to be breached as investors require a higher premium for buying US treasuries currently. EUR/CHF rose on the back of deflationary Swiss inflation data, opening the door for a potential 50bp cut at the SNB meeting later this month. The SEK underperformed G10 peers with selling persisting through the session, making NOK/SEK briefly trading above 0.9500 before falling back slightly. We have updated our Riksbank call and now expect the rate to be cut by 25bp, to 2%, in August. As for NBP, we expect them to leave the key rate unchanged at 5.25% at today's monetary policy meeting. This morning, we have released updated macro forecasts, to be found in Nordic Outlook - June 2025.
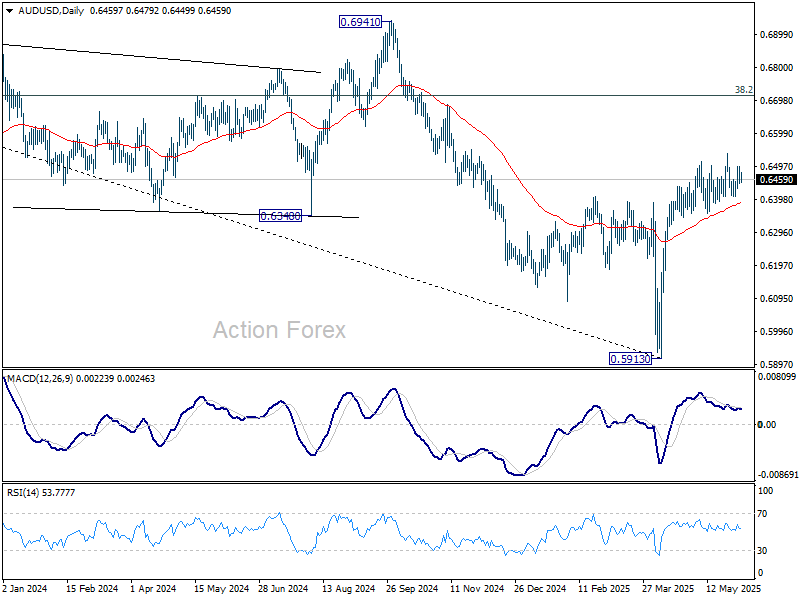
AUD/USD Daily Report
Daily Pivots: (S1) 0.6439; (P) 0.6470; (R1) 0.6492; More...
Intraday bias sin AUD/USD remains neutral for the moment. With 0.6406 support intact, further rally is expected. ON the upside, firm break of 0.6536 will resume the rally from 0.5913 to 61.8% retracement of 0.6941 to 0.5913 at 0.6548. However, decisive break of 0.6406 will confirm short term topping, and turn bias back to the downside for 38.2% retracement of 0.5913 to 0.6536 at 0.6298.
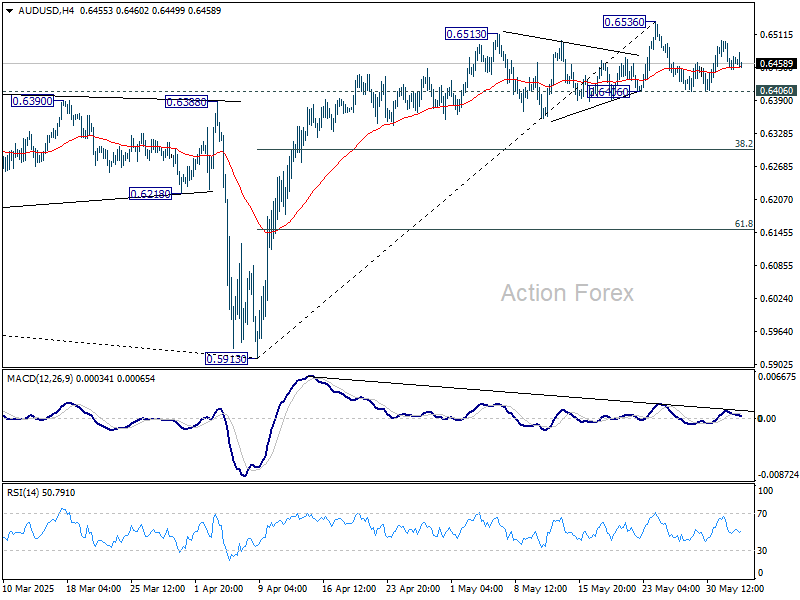
In the bigger picture, AUD/USD is still struggling to sustain above 55 W EMA (now at 0.6441) cleanly, and outlook is mixed. Sustained trading above 55 W EMA will indicate that rise from 0.5913 is at least correcting the down trend from 0.8006 (2021 high), with risk of trend reversal. Further rise should be seen to 38.2% retracement of 0.8006 to 0.5913 at 0.6713. However, rejection by 55 W EMA will revive medium term bearishness for another fail through 0.5913 at a later stage.