
Sample Category Title
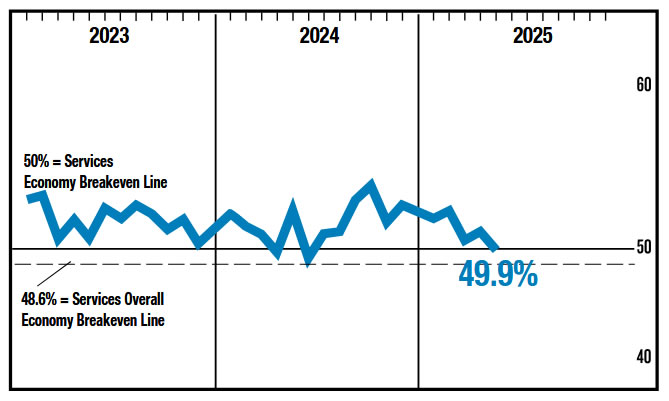
US ISM services falls to 49.9, prices jump to highest since late 2022
US ISM Services PMI slipped unexpectedly into contraction territory in May, falling from 51.6 to 49.9, its first sub-50 reading since June 2024 and well below market expectations of 52.0.
The drop was driven by sharp declines in both business activity, which fell from 53.7 to the breakeven 50.0, and new orders, which plunged from 52.3 to 46.4, indicating a broad-based pullback in demand. On the brighter side, employment rebounded into slight expansion at 50.7.
The ISM noted that the weakness is "not indicative of a severe contraction", but rather widespread uncertainty, particularly related to trade policy. The average PMI reading over the past three months, at 50.8, suggests overall stagnation and marks a notable shift lower from the 52.8 average of the prior nine months.
Most concerning is the sustained upward pressure on costs. The Prices Index rose to 68.7, its highest level since November 2022. That's the time when CPI rose 7.1%.
Sunset Market Commentary
Markets
The award for fastest analysis of today’s ADP employment report goes to… US President Trump. “ADP NUMBER OUT!!! “Too Late” Powell must now LOWER THE RATE. He is unbelievable!!! Europe has lowered NINE TIMES!” We break the analysis down into three parts. First we forgive him the mistake that Europe has lowered rates SEVEN times (by 25 bps) so far. If they do so again tomorrow, it’s nevertheless cumulatively (200 bps) double the amount than the Fed (100 bps in Q4 2024). Second, he’s stepping up the pressure against Fed chair Powell again, a mistake that cost him/his administration dearly earlier this year through loss of investor confidence. Both met in person on May 29. According to the Federal Reserve, the meeting did not include discussions about interest rates. Instead, it focused on general economic developments such as growth, employment, and inflation. Anyway, Fed Chair Powell reiterated that the Fed solely focuses on economic data and won’t abide to political pressure. The US central bank is in wait-and-see mode with the needle currently stuck on (upside) inflation (risks) instead of (downside) employment (risks). Once the unemployment rate starts shooting higher, the Powell Fed nevertheless won’t hesitate to shift its focus in a reactive rather than an anticipative manner. They did the same in September last year when they kicked off the policy normalisation process with a bumper 50 bps rate cut after the Sahm rule recession indicator was triggered in Summer months. The rule suggests high recession risks if the 3-month moving average of the unemployment rate exceeds its lowest level from the past 12 months by more than 0.5 percentage points. For that to happen on Friday with May payrolls, the unemployment rate needs to rise from 4.2% in April to 5.2%. Consensus expects a stabilization… Finally, there’s the ADP employment report which keeps the stagflation narrative intact. Private sector employment increased by 37k in May, less than 114k expected and the lowest tally since March 2023, but hiring still. While hiring is losing momentum after a strong start to the year, pay growth was little changed, holding a robust level for both job-stayers (4.5% Y/Y) and job-changers (7% Y/Y). Whereas the US Treasury market focused on the “FLATION” part of the story following Monday’s manufacturing ISM, they now eyed the “STAG” part going into Friday’s payrolls. US Treasuries rallied with the curve bull flattening. US yields currently cede 3.7 bps (2-yr) to 6.6 bps (30-yr) in a move which has more potential in case of a weak non-manufacturing ISM to be released later today. The outcome for the US dollar is the same as on Monday: downhill with EUR/USD currently trading back above the 1.14 handle. Losses for US equity futures remained limited.
News & Views
Czech consumer prices rose by 0.5% m/m in May, driving the annual rate from 1.8% to 2.4%. That’s more than the market (2%) and the Czech central bank (2.3%) expected. May's upside surprise was largely due to food, which together with alcohol had risen more sharply month over month (1.3% vs. 0.9%). There’s no detailed structure yet, but it seems that services’ inflation momentum was increasing while energy became somewhat cheaper. Looking ahead, KBC Economics expects a short-term inflation peak of close to 2.8% in June. Subsequently, inflation should start to gradually return to the inflation target over the summer and autumn. KBC Economics is keeping the 2025 annual estimate at 2.3%. In a separate release, wage growth slowed only slightly at the start of 2025. According to today's release, annual average wage growth slowed from 6.9% at the end of 2024 to 6.7% in 2025Q1. The numbers suggest a still relatively tight labour market with only gradually fading strong wage dynamics that so far continue to outpace labour productivity dynamics. It’s a key concern and reason for the central bank to tread carefully on future (if any) rate cuts. The Czech crown rallied on the release with EUR/CZK touching a new one-year low. Czech swap yields sprint between 5 and 11 bps higher across the curve.
Bulgaria took another key hurdle in adopting the euro by securing the European Commission’s positive recommendation today. The EC together with the ECB finished the convergence report and both concluded that the one remaining obstacle – above-target inflation – was cleared. It is now up to EU government leaders to discuss Bulgaria’s ascension bid at the June 26-27 summit before finance ministers giving the final approval on July 8. That would leave the country enough time for adoption by 2026.
BoC holds at 2.75% as economy softens and inflation surprises
BoC kept its overnight rate unchanged at 2.75% as expected, opting for caution amid lingering uncertainty over US trade policy. While acknowledging a “softer but not sharply weaker” economy, the Governing Council pointed to recent inflation data that showed “unexpected firmness,” warranting a wait-and-see approach before committing to further policy moves.
In its accompanying statement, BoC emphasized that it is carefully weighing both "downward" and "upward" pressures on inflation. A slower economy is expected to restrain price growth, but tariff-related cost increases could do the opposite.
Key concerns for the central bank include the potential drag from reduced US demand for Canadian exports, spillovers into business confidence and employment, and whether cost increases are being passed on to consumers.
(BOC) Bank of Canada holds policy rate at 2¾%
The Bank of Canada today maintained its target for the overnight rate at 2.75%, with the Bank Rate at 3% and the deposit rate at 2.70%.
Since the April Monetary Policy Report, the US administration has continued to increase and decrease various tariffs. China and the United States have stepped back from extremely high tariffs and bilateral trade negotiations have begun with a number of countries. However, the outcomes of these negotiations are highly uncertain, tariff rates are well above their levels at the beginning of 2025, and new trade actions are still being threatened. Uncertainty remains high.
While the global economy has shown resilience in recent months, this partly reflects a temporary surge in activity to get ahead of tariffs. In the United States, domestic demand remained relatively strong but higher imports pulled down first-quarter GDP. US inflation has ticked down but remains above 2%, with the price effects of tariffs still to come. In Europe, economic growth has been supported by exports, while defence spending is set to increase. China’s economy has slowed as the effects of past fiscal support fade. More recently, high tariffs have begun to curtail Chinese exports to the US. Since the financial market turmoil in April, risk assets have largely recovered and volatility has diminished, although markets remain sensitive to US policy announcements. Oil prices have fluctuated but remain close to their levels at the time of the April MPR.
In Canada, economic growth in the first quarter came in at 2.2%, slightly stronger than the Bank had forecast, while the composition of GDP growth was largely as expected. The pull-forward of exports to the United States and inventory accumulation boosted activity, with final domestic demand roughly flat. Strong spending on machinery and equipment held up growth in business investment by more than expected. Consumption slowed from its very strong fourth-quarter pace, but continued to grow despite a large drop in consumer confidence. Housing activity was down, driven by a sharp contraction in resales. Government spending also declined. The labour market has weakened, particularly in trade-intensive sectors, and unemployment has risen to 6.9%. The economy is expected to be considerably weaker in the second quarter, with the strength in exports and inventories reversing and final domestic demand remaining subdued.
CPI inflation eased to 1.7% in April, as the elimination of the federal consumer carbon tax reduced inflation by 0.6 percentage points. Excluding taxes, inflation rose 2.3% in April, slightly stronger than the Bank had expected. The Bank’s preferred measures of core inflation, as well as other measures of underlying inflation, moved up. Recent surveys indicate that households continue to expect that tariffs will raise prices and many businesses say they intend to pass on the costs of higher tariffs. The Bank will be watching all these indicators closely to gauge how inflationary pressures are evolving.
With uncertainty about US tariffs still high, the Canadian economy softer but not sharply weaker, and some unexpected firmness in recent inflation data, Governing Council decided to hold the policy rate as we gain more information on US trade policy and its impacts. We will continue to assess the timing and strength of both the downward pressures on inflation from a weaker economy and the upward pressures on inflation from higher costs.
Governing Council is proceeding carefully, with particular attention to the risks and uncertainties facing the Canadian economy. These include: the extent to which higher US tariffs reduce demand for Canadian exports; how much this spills over into business investment, employment and household spending; how much and how quickly cost increases are passed on to consumer prices; and how inflation expectations evolve.
We are focused on ensuring that Canadians continue to have confidence in price stability through this period of global upheaval. We will support economic growth while ensuring inflation remains well controlled.
Information note
The next scheduled date for announcing the overnight rate target is July 30, 2025. The Bank will publish its next MPR at the same time.
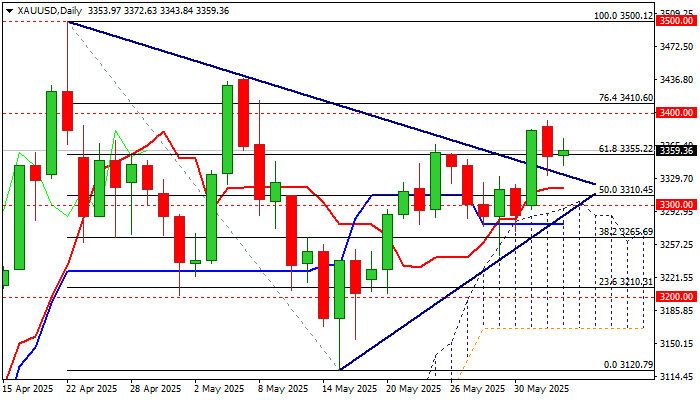
GOLD: Bullish Bias Above Broken Triangle’s Upper Boundary
Gold price moves within a tight range on Wednesday but remains bullishly aligned following limited corrective dip on Tuesday.
Broken Fibo level at $3355 (61.8% of $3200/$3120 pullback) reverted to solid support which keeps the downside protected so far and guards lower trigger at $3328 (broken triangle’s upper boundary, reinforced by 10DMA).
Technical picture on daily chart remains bullish overall, with the action being strongly underpinned by thick daily cloud (top of the cloud currently lays at psychological $3000 level), but warnings from fading positive momentum and Stochastic entering overbought zone, should not be ignored.
Near-term bias, however, is expected to remain with bulls as long as the price stays above broken triangle resistance, with extended consolidation likely to precede fresh attacks at key $3400 resistance zone (Tuesday’s peak / psychological / Fibo 76.4%) violation of which would unmask key $3500 level (new record high).
The notion is supported by overall favorable fundamental conditions, mainly due to persisting uncertainty over the US trade tariffs, particularly on negotiations with China and EU, as well as doubled tariffs on metal imports that fuel worries about further turmoil in global trading.
US economic data were so far mixed, as two of three US May labor reports (JOLTS 7.39M vs 7.11M f/c and ADP 37K vs 111K f/c) conflicted, as the markets await release of NFP report on Friday, to get more details about the condition in the US labor sector.
Also, growing concerns about US fiscal growth on signals that enormous US debt would be boosted by recently passed spending and tax cut bills, is likely to provide fresh tailwinds to the yellow metal, along with persistently unstable and overheated geopolitical situation.
Res: 3372; 3392; 3400; 3410
Sup: 3343; 3328; 3318; 3310
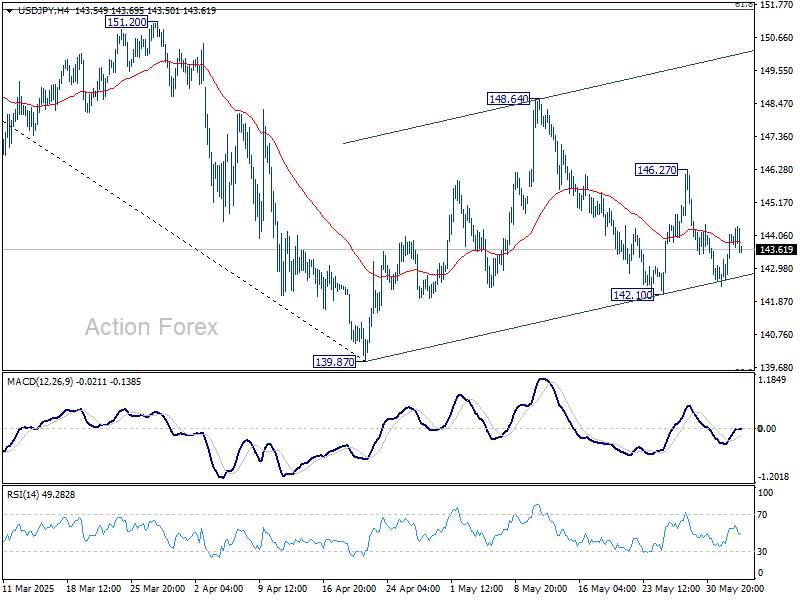
USD/JPY Mid-Day Outlook
Daily Pivots: (S1) 142.89; (P) 143.50; (R1) 144.62; More...
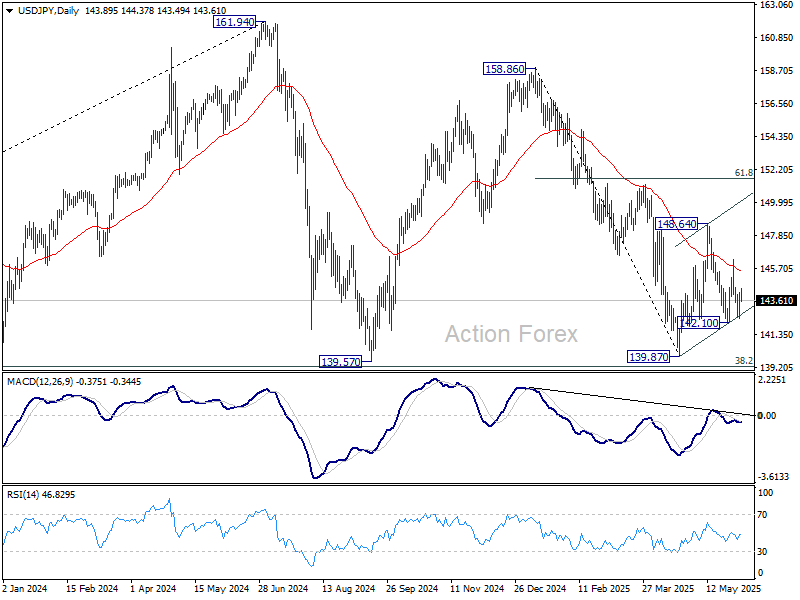
Intraday bias in USD/JPY stays neutral for the moment. On the upside, above 146.27 will target 148.64 resistance first. Firm break there will resume the rebound from 139.87. Nevertheless, break of 142.10 will bring deeper fall back to 139.87 low.
In the bigger picture, price actions from 161.94 are seen as a corrective pattern to rise from 102.58 (2021 low), with fall from 158.86 as the third leg. Strong support should be seen from 38.2% retracement of 102.58 to 161.94 at 139.26 to bring rebound. However, sustained break of 139.26 would open up deeper medium term decline to 61.8% retracement at 125.25.
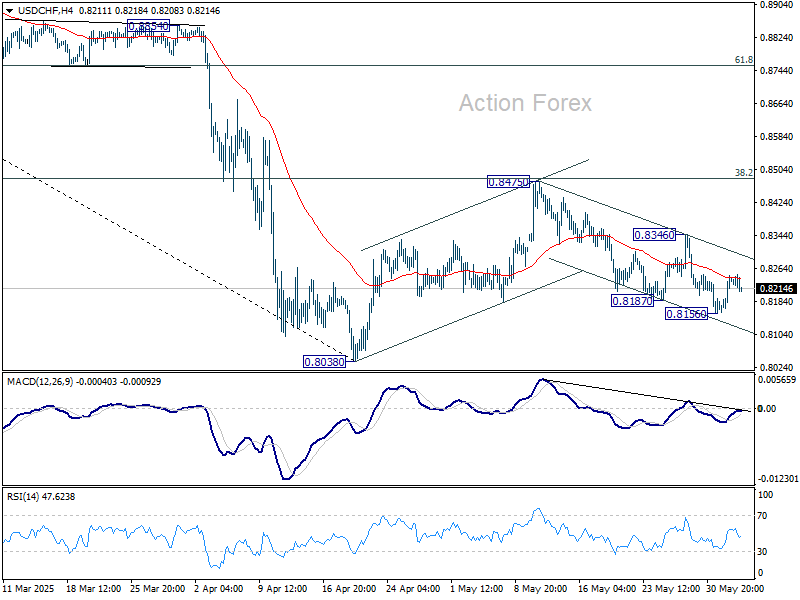
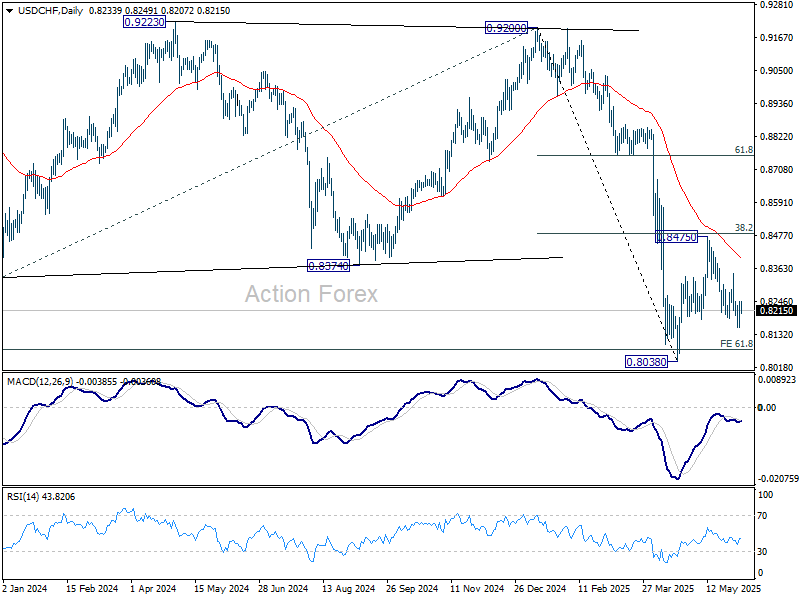
USD/CHF Mid-Day Outlook
Daily Pivots: (S1) 0.8184; (P) 0.8216; (R1) 0.8273; More….
Intraday bias in USD/CHF stays neutral at this point. Fall from 0.8475 could still extend lower, and break of 0.8156 will target 0.8038 low. But strong support should be seen from there to bring rebound, at least on first attempt. On the upside, break of 0.8346 resistance will extend the corrective pattern from 0.8038 with another rising leg.
In the bigger picture, long term down trend from 1.0342 (2017 high) is still in progress and met 61.8% projection of 1.0146 (2022 high) to 0.8332 from 0.9200 at 0.8079 already. In any case, outlook will stay bearish as long as 55 W EMA (now at 0.8732) holds. Sustained break of 0.8079 will target 100% projection at 0.7382.
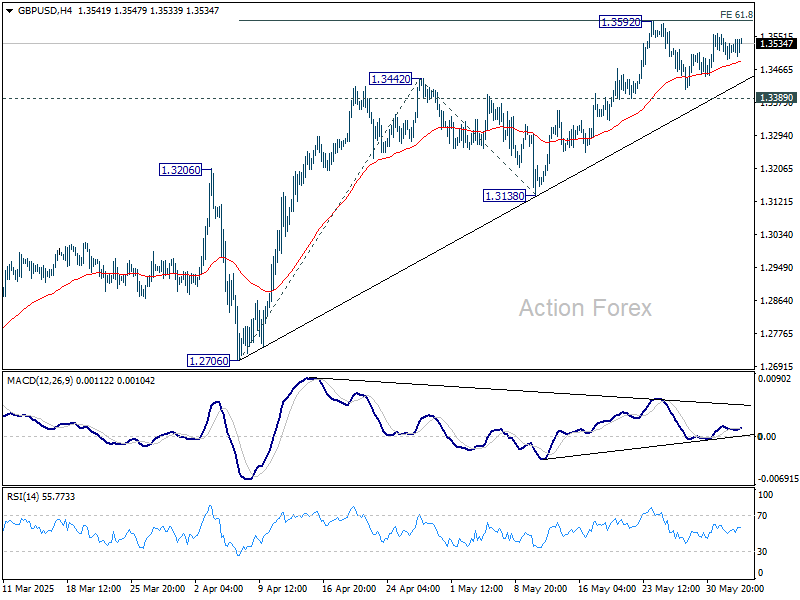
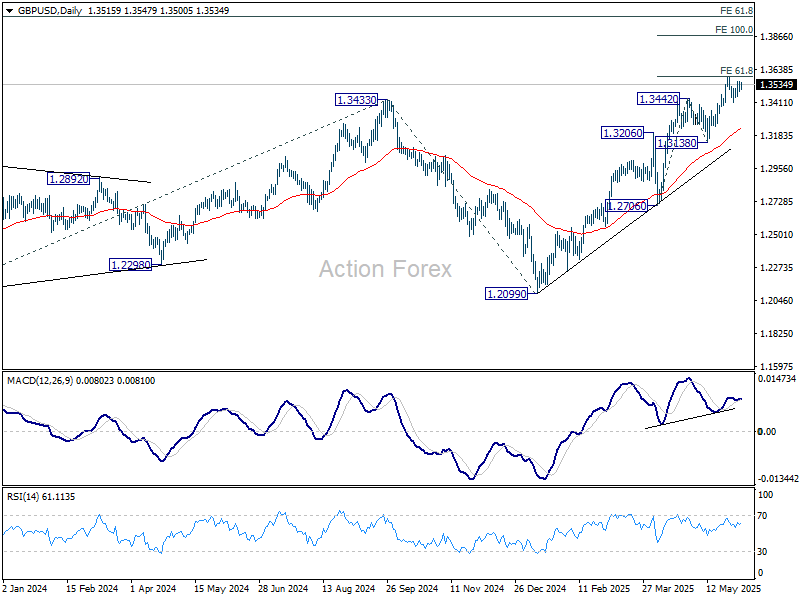
GBP/USD Mid-Day Outlook
Daily Pivots: (S1) 1.3488; (P) 1.3523; (R1) 1.3555; More...
GBP/USD is still bounded in range below 1.3592 and intraday bias remains neutral. With 1.3389 support intact, further rise is expected. On the upside, firm break of 1.3592 will resume larger up trend to 100% projection of 1.2706 to 1.3442 from 1.3138 at 1.3874. However, decisive break of 1.3389 will turn bias back to the downside for 1.3138 support instead.
In the bigger picture, up trend from 1.3051 (2022 low) is in progress. Next medium term target is 61.8% projection of 1.0351 to 1.3433 from 1.2099 at 1.4004. Outlook will now stay bullish as long as 55 W EMA (now at 1.2866) holds, even in case of deep pullback.
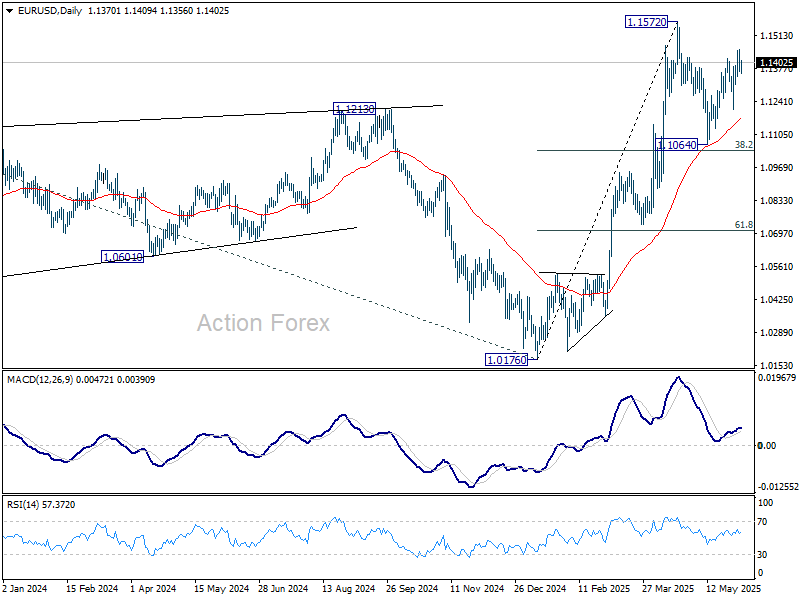
EUR/USD Mid-Day Outlook
Daily Pivots: (S1) 1.1338; (P) 1.1397; (R1) 1.1429; More...
EUR/USD is staying in consolidations below 1.1453 temporary top and intraday bias remains neutral. Rebound from 1.1064 could extend higher, but strong resistance should be seen from 1.1572 to limit upside, at least on first attempt. On the downside, break of 1.1209 support will indicate that the corrective pattern from 1.1572 has started the third leg, and target 1.1064 support.
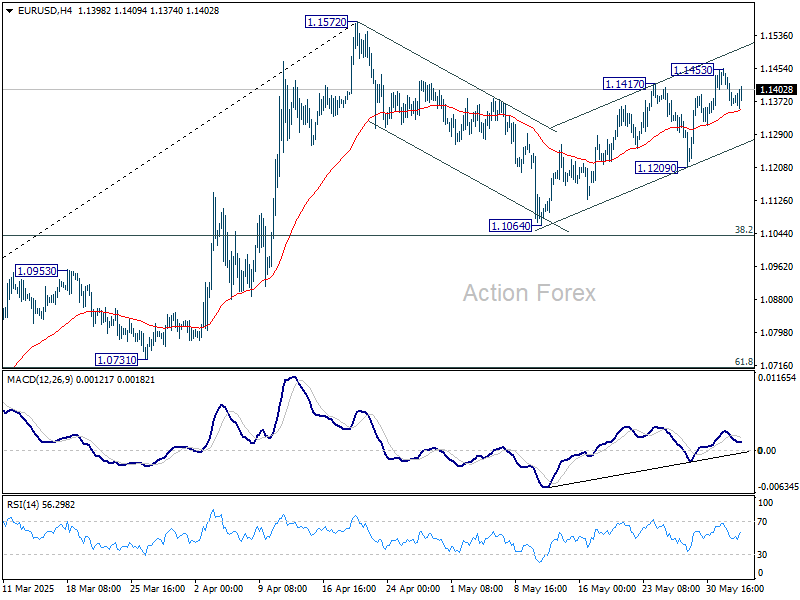
In the bigger picture, rise from 0.9534 long term bottom could be correcting the multi-decade downtrend or the start of a long term up trend. In either case, further rise should be seen to 100% projection of 0.9534 to 1.1274 from 1.0176 at 1.1916. This will now remain the favored case as long as 55 W EMA (now at 1.0856) holds.
Muted Trading Persists as Trump Pressures Fed after ADP Miss
Trading remains subdued as markets drift into the US session, with little conviction across asset classes. US futures dipped slightly after a dismal ADP employment report showing only 37k job additions in May, sharply below expectations. Still, the reaction was contained, with no clear evidence of a broad risk-off move.
US President Donald Trump added to the noise with another jab at Fed on Truth Social: “ADP NUMBER OUT!!! ‘Too Late’ Powell must now LOWER THE RATE.” While such commentary adds political pressure, Fed officials have consistently stated they need to remain patient given the elevated uncertainty surrounding US tariff policies and ongoing trade talks. Fed is clearly reluctant to act prematurely.
Trade remains a key driver of sentiment. The latest round of higher US tariffs on steel and aluminium took effect on Wednesday, affecting all partners except the UK, which has a preliminary agreement in place. Today also marks the Trump administration’s self-imposed deadline for trading partners to submit their “best offers” to avoid sweeping tariffs set to begin in early July. Markets are likely to see a pickup in volatility as the tariff pause approaches its final weeks.
In the currency markets, Dollar is currently the worst performer for the day so far, followed by Loonie and Yen. At the other end, Aussie is leading gains, followed by Kiwi and Swiss Franc. Euro and Pound are holding steady in the middle of the pack. Despite some movement, major currency pairs remain trapped within last week’s ranges.
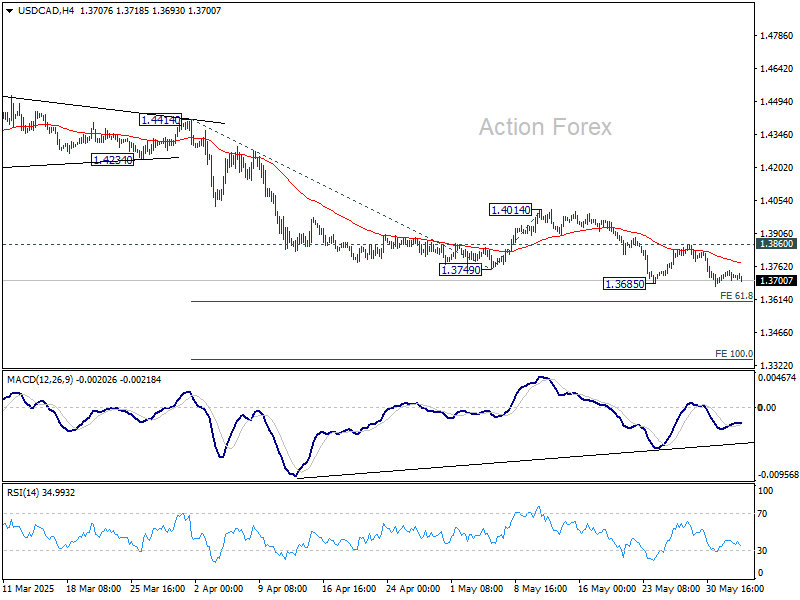
USD/CAD may come into sharper focus later in the session as BoC delivers its rate decision, alongside the release of the US ISM Services report.
Technically, USD/CAD remains on the defensive and poised for further decline as long as the 1.3860 resistance level holds. 61.8% projection of 1.4414 to 1.3749 from 1.4014 at 1.3603 might provide some support to bring rebound. However, decisive break there could prompt downside acceleration to 100% projection at 1.3349 rather quickly.
In Europe, at the time of writing, FTSE is up 0.22%. DAX is up 0.39%. CAC is up 0.57%. UK 10-year yield is down -0.041 at 4.606. Germany 10-year yield is flat at 2.523. Earlier in Asia, Nikkei rose 0.80%. Hong Kong HSI rose 0.60%. China Shanghai SSE rose 0.42%. Singapore Strait Times is up 0.24%. Japan 10-year JGB yield rose 0.023 to 1.505.
US ADP jobs rise only 37k, but wages growth stays firm
The US private sector added just 37k jobs in May, sharply below expectations of 120k, according to the ADP report.
Weakness was most apparent in goods-producing sectors, which shed -2k jobs, while service providers managed a modest gain of 36k. By company size, medium-sized businesses led with 49k new jobs, while small firms lost -13k and large firms shed -3k.
Despite the hiring slowdown, wage pressures remained firm. Annual pay growth for job-stayers held steady at 4.5%, while job-changers saw a 7% increase, unchanged from April.
Nela Richardson, ADP’s chief economist, acknowledged the slowdown in hiring but noted that wage pressures have not yet eased meaningfully—suggesting lingering tightness in segments of the labor market even as overall momentum weakens.
UK PMI services finalized at 50.9, rebound as tariff concerns ease
The UK services sector returned to modest growth in May, with PMI Services finalized at 50.9, rebounding from April’s 27-month low of 49.0. Composite PMI also edged into expansion at 50.3, up from 48.5.
Tim Moore of S&P Global highlighted that easing fears over US tariffs, firmer global markets, and renewed client confidence underpinned the service sector’s recovery. Business sentiment for the year ahead climbed to a seven-month high, driven by investment plans and improved sales expectations.
However, the underlying job market remains soft. The eight-month stretch of declining employment in the sector now marks the longest non-pandemic downturn since the global financial crisis.
But encouragingly, input cost inflation eased from April’s peak, while competitive pricing pressures led to the slowest increase in service charges since October.
Eurozone PMI composite finalized at 50.2, ECB cuts and Germany to suhion tariffs impact ahead
Eurozone’s services sector contracted modestly in May, with the final PMI Services reading falling to 49.7, down from April’s 50.1, marking a six-month low. This decline pulled the Composite PMI down to 50.2, indicating only marginal overall growth in private sector activity.
The divergence in national performance was notable: Italy led with a 13-month high of 52.5, while Germany and France both remained in contraction, with Germany posting a five-month low of 48.5 and France improving to a nine-month high of 49.3.
Cyrus de la Rubia, Chief Economist at Hamburg Commercial Bank, expressed confidence that expected ECB rate cuts and anticipated fiscal support from Germany would help cushion the impact of rising tariffs and growing uncertainty.
However, inflation signals from the PMI survey were mixed. Services sector sales price growth moderated again, which may reassure the ECB on the disinflation front. Still, cost pressures picked up slightly, which could complicate the ECB’s job over the longer term. Nevertheless, with goods prices easing more quickly and overall inflation slipping below target.
Australia’s GDP grows only 0.2% qoq in Q1, as weather and public investment drag
Australia’s GDP expanded just 0.2% qoq in Q1, falling short of expectations for 0.4% qoq growth. On an annual basis, GDP rose 1.3% yoy. However, GDP per capita declined by -0.2% qoq, marking a renewed contraction in individual economic output.
The ABS noted that severe weather disrupted key sectors including mining, tourism, and shipping, while also impacting domestic demand and exports.
The most notable drag came from public investment, which fell -2.0%, contributing to the largest negative impact from public spending since Q3 2017. Net exports also weighed slightly, subtracting -0.1 percentage points from quarterly growth.
Japan’s PMI composite finalized at 50.2, growth momentum falters
Japan’s private sector lost steam in May as final PMI Services reading slipped to 51.0 from April’s 52.4, while Composite PMI declined to 50.2 from 51.2. The data point to only marginal growth in overall activity, with a slowdown in services combining with a mild deterioration in manufacturing output.
S&P Global’s Annabel Fiddes noted that the rise in total new orders "moved closer to stagnation, as service sector sales grew at their slowest pace in six months and factory demand continued to decline. This moderation suggests that Japan’s private sector "may struggle to bounce back in the near-term".
Underlying concerns were linked to external and structural factors, including an uncertain global demand outlook, persistent labor shortages, and mounting cost pressures.
EUR/USD Mid-Day Outlook
Daily Pivots: (S1) 1.1338; (P) 1.1397; (R1) 1.1429; More...
EUR/USD is staying in consolidations below 1.1453 temporary top and intraday bias remains neutral. Rebound from 1.1064 could extend higher, but strong resistance should be seen from 1.1572 to limit upside, at least on first attempt. On the downside, break of 1.1209 support will indicate that the corrective pattern from 1.1572 has started the third leg, and target 1.1064 support.
In the bigger picture, rise from 0.9534 long term bottom could be correcting the multi-decade downtrend or the start of a long term up trend. In either case, further rise should be seen to 100% projection of 0.9534 to 1.1274 from 1.0176 at 1.1916. This will now remain the favored case as long as 55 W EMA (now at 1.0856) holds.