
Sample Category Title
Subdued Markets Drift as Tariff Tensions Resurface and BoC Decision Looms
Global markets remain subdued as investors struggle to find a firm direction. US stocks closed higher overnight, with NASDAQ extending to fresh multi-week highs, suggesting some resilience in tech-led risk appetite. Asian equities followed suit to some extent, but the overall momentum has been tepid.
In the currency markets, Dollar is attempting to recover from recent losses, though the rebound so far lacks strong conviction. Loonie and Kiwi are mildly firmer. However, Aussie and Yen are both underperforming, sitting at the bottom of the performance table and highlighting the absence of a coherent risk-on or risk-off narrative. European majors are positioned in the middle of the pack, with Swiss Franc slightly outperforming.
The trade backdrop remains tense. US President Donald Trump’s decision to double tariffs on most imported steel and aluminum to 50% took effect on today, marking a new escalation in the global trade conflict. According to economic adviser Kevin Hassett, the initial 25% steel tariffs delivered partial support, but "more help is needed," hence the decision to double the rates. The move came just as the White House also demanded "best offers" from trade partners ahead of a self-imposed early July deadline. Attention now turns to the European Union, with markets awaiting any formal response or retaliatory measures.
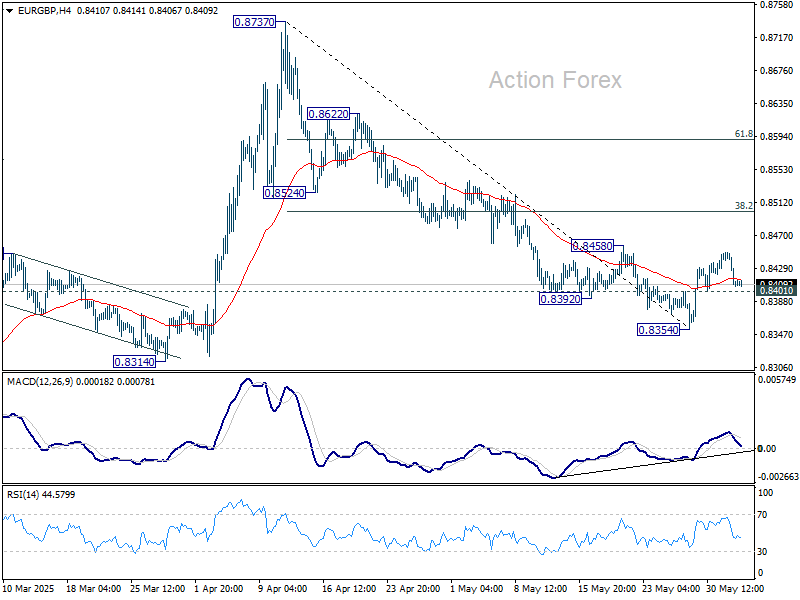
Technically, EUR/GBP's recovery has stalled ahead of 0.8458 resistance and retreated notably. Focus is back on 0.8401 support. Firm break there will argue that fall from 0.8737 might be ready to resume through 0.8354. That, if happens, might be accompanied by extended pullback in EUR/USD or upside break out in GBP/USD, or both.
In Asia, at the time of writing, Nikkei is up 0.92%. Hong Kong HSI is up 0.47%. China Shanghai SSE is up 0.36%. Singapore Strait Times is down -0.07%. Japan 10-year JGB yield is up 0.014 at 1.495. Overnight, DOW rose 0.51%. S&P 500 rose 0.58%. NASDAQ rose 0.81%. 10-year yield fell -0.002 to 4.460.
Looking ahead, final PMI Services data from both the Eurozone and the UK will be released in European session. In the US, markets will closely watch the ADP employment report and ISM services index for clues on labor market momentum and service sector resilience. Still, the day’s main event is BoC policy decision, where the central bank is widely expected to hold, but guidance could lean dovish as trade risks intensify.
BoC to hold rates at 2.75%, maintain dovish bias
BoC is widely expected to leave interest rate unchanged at 2.75% for the second consecutive meeting today.
While Q1 GDP surprised to the upside at 2.2% annualized, the growth was heavily front-loaded by export activity as US buyers rushed to stockpile Canadian goods ahead of impending tariffs. That one-off boost is unlikely to alter the central bank’s cautious stance in light of growing global and domestic uncertainties. Meanwhile, core inflation rose back to near the top of BoC’s 1-3% target range, offering a reasonable basis for a continued pause.
Overall, expectations are firmly anchored toward further easing later this year. A Reuters poll found that 75% (17 of 23) of economists anticipate at least two more cuts in 2025, with two of them forecasting as many as four.
Given the high degree of trade uncertainty, particularly around tariffs, BoC is likely to keep a flexible tone in its communication. While the rate is on hold today, policymakers are expected to leave the door open for adjustments ahead, depending on how the trade situation evolves.
In the currently markets, today's BoC decision may not be the key driver for USD/CAD. Instead, market direction is still largely dictated by sentiment around US trade policy.
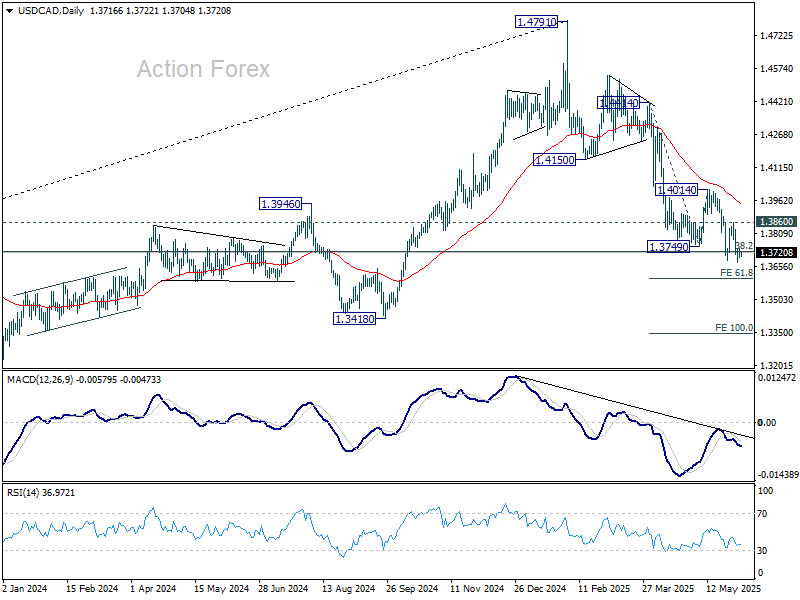
Technically, further decline is expected as long as 1.3860 resistance holds, to 61.8% projection of 1.4414 to 1.3749 from 1.4014 at 1.3603. There might be some support from 1.3603 to contain downside and bring a rebound, as a correction to the five wave decline from 1.4791 high. However, decisive break there could prompt downside acceleration to 100% projection at 1.3349 rather quickly.
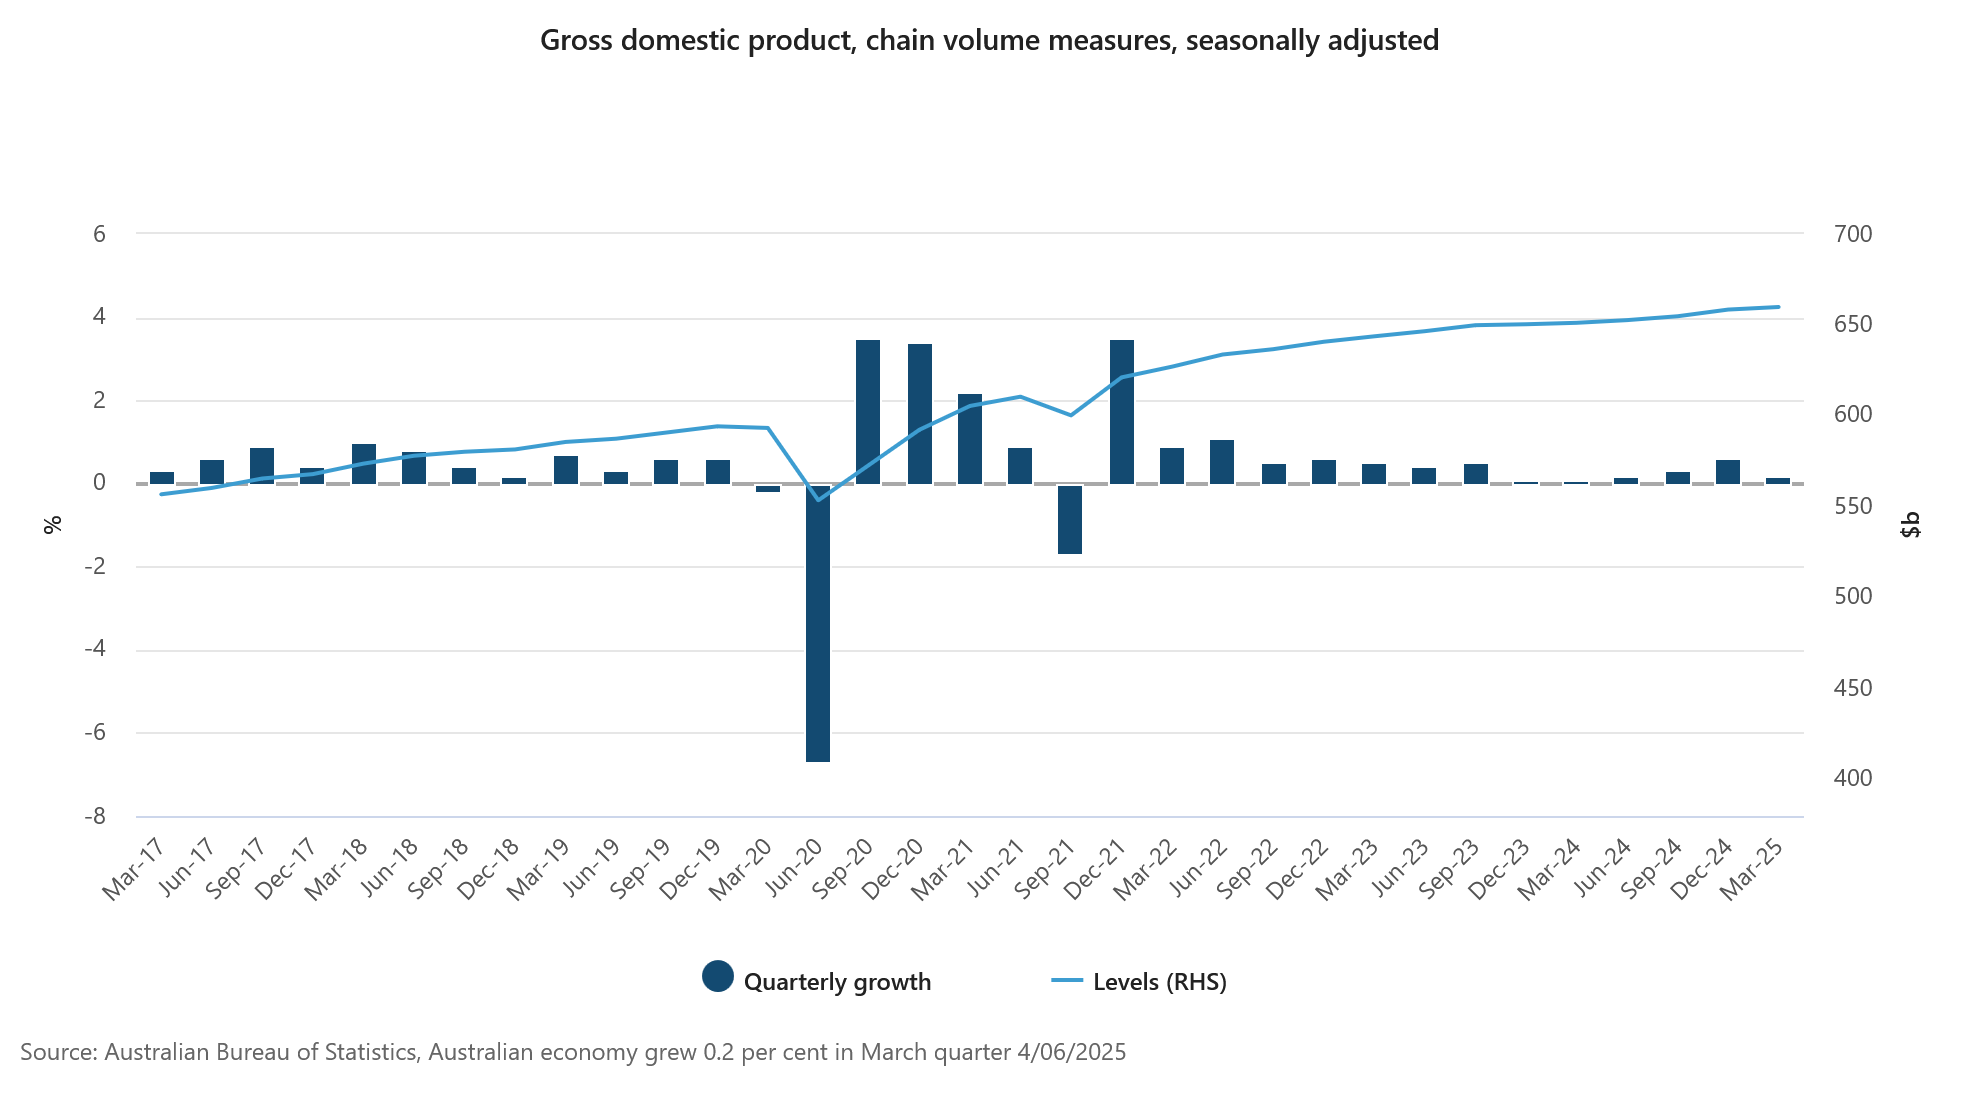
Australia’s GDP grows only 0.2% qoq in Q1, as weather and public investment drag
Australia’s GDP expanded just 0.2% qoq in Q1, falling short of expectations for 0.4% qoq growth. On an annual basis, GDP rose 1.3% yoy. However, GDP per capita declined by -0.2% qoq, marking a renewed contraction in individual economic output.
The ABS noted that severe weather disrupted key sectors including mining, tourism, and shipping, while also impacting domestic demand and exports.
The most notable drag came from public investment, which fell -2.0%, contributing to the largest negative impact from public spending since Q3 2017. Net exports also weighed slightly, subtracting -0.1 percentage points from quarterly growth.
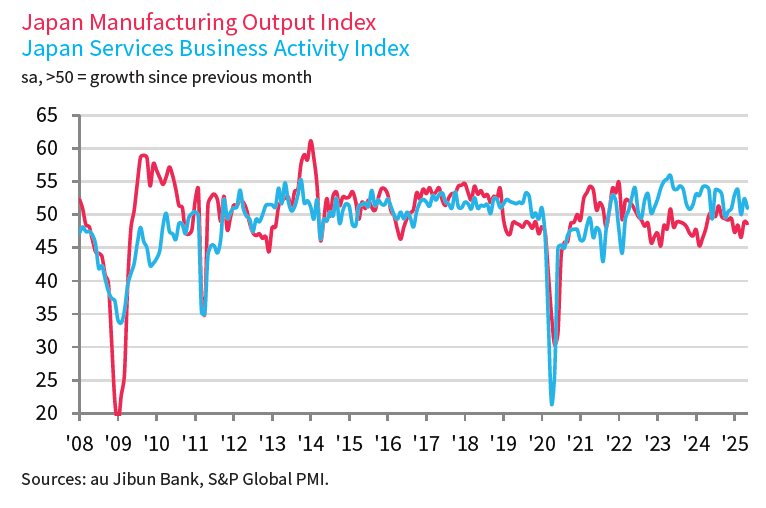
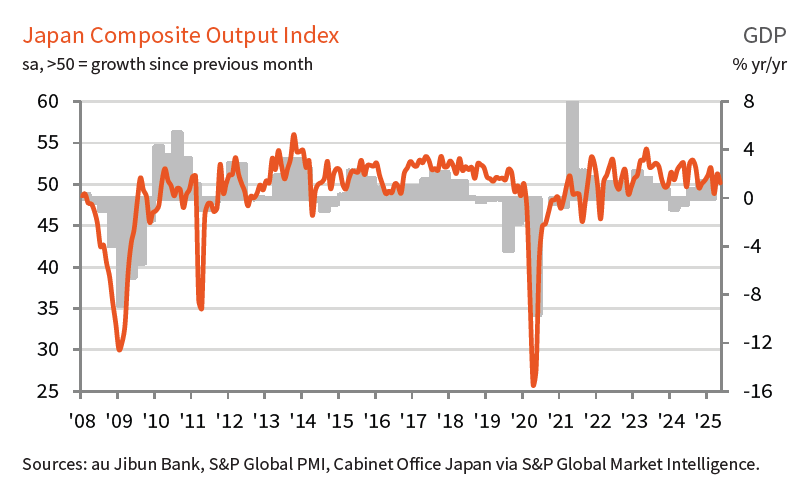
Japan’s PMI composite finalized at 50.2, growth momentum falters
Japan’s private sector lost steam in May as final PMI Services reading slipped to 51.0 from April’s 52.4, while Composite PMI declined to 50.2 from 51.2. The data point to only marginal growth in overall activity, with a slowdown in services combining with a mild deterioration in manufacturing output.
S&P Global’s Annabel Fiddes noted that the rise in total new orders "moved closer to stagnation, as service sector sales grew at their slowest pace in six months and factory demand continued to decline. This moderation suggests that Japan’s private sector "may struggle to bounce back in the near-term".
Underlying concerns were linked to external and structural factors, including an uncertain global demand outlook, persistent labor shortages, and mounting cost pressures.
AUD/USD Daily Report
Daily Pivots: (S1) 0.6439; (P) 0.6470; (R1) 0.6492; More...
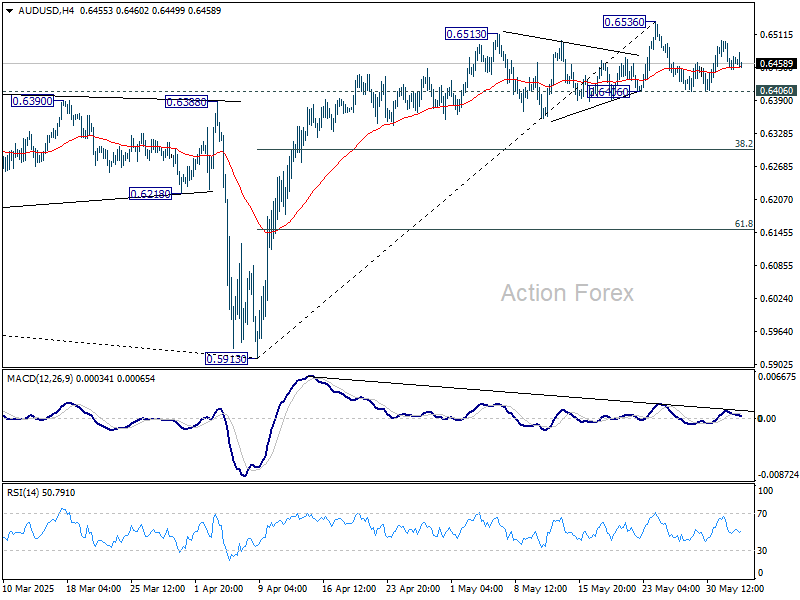
Intraday bias sin AUD/USD remains neutral for the moment. With 0.6406 support intact, further rally is expected. ON the upside, firm break of 0.6536 will resume the rally from 0.5913 to 61.8% retracement of 0.6941 to 0.5913 at 0.6548. However, decisive break of 0.6406 will confirm short term topping, and turn bias back to the downside for 38.2% retracement of 0.5913 to 0.6536 at 0.6298.
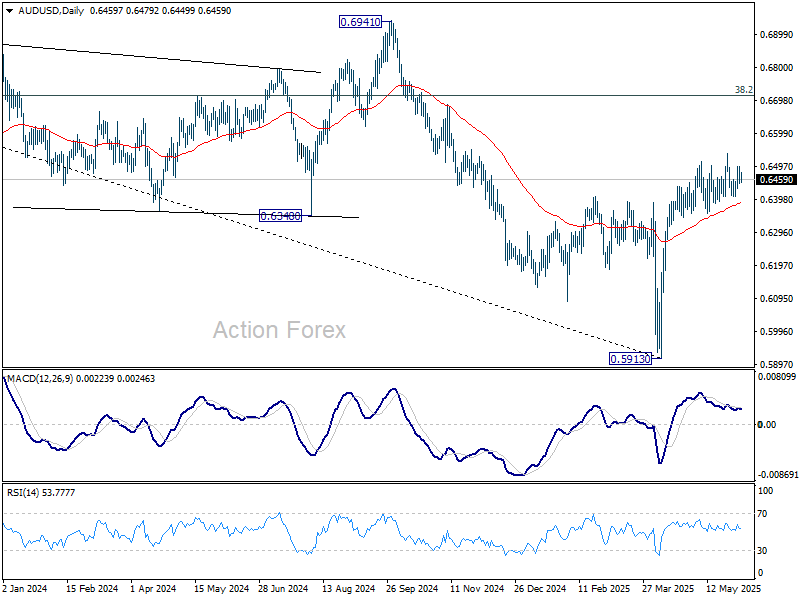
In the bigger picture, AUD/USD is still struggling to sustain above 55 W EMA (now at 0.6441) cleanly, and outlook is mixed. Sustained trading above 55 W EMA will indicate that rise from 0.5913 is at least correcting the down trend from 0.8006 (2021 high), with risk of trend reversal. Further rise should be seen to 38.2% retracement of 0.8006 to 0.5913 at 0.6713. However, rejection by 55 W EMA will revive medium term bearishness for another fail through 0.5913 at a later stage.
BoC to hold rates at 2.75%, maintain dovish bias
BoC is widely expected to leave interest rate unchanged at 2.75% for the second consecutive meeting today.
While Q1 GDP surprised to the upside at 2.2% annualized, the growth was heavily front-loaded by export activity as US buyers rushed to stockpile Canadian goods ahead of impending tariffs. That one-off boost is unlikely to alter the central bank’s cautious stance in light of growing global and domestic uncertainties. Meanwhile, core inflation rose back to near the top of BoC’s 1-3% target range, offering a reasonable basis for a continued pause.
Overall, expectations are firmly anchored toward further easing later this year. A Reuters poll found that 75% (17 of 23) of economists anticipate at least two more cuts in 2025, with two of them forecasting as many as four.
Given the high degree of trade uncertainty, particularly around tariffs, BoC is likely to keep a flexible tone in its communication. While the rate is on hold today, policymakers are expected to leave the door open for adjustments ahead, depending on how the trade situation evolves.
In the currently markets, today's BoC decision may not be the key driver for USD/CAD. Instead, market direction is still largely dictated by sentiment around US trade policy.
Technically, further decline is expected as long as 1.3860 resistance holds, to 61.8% projection of 1.4414 to 1.3749 from 1.4014 at 1.3603. There might be some support from 1.3603 to contain downside and bring a rebound, as a correction to the five wave decline from 1.4791 high. However, decisive break there could prompt downside acceleration to 100% projection at 1.3349 rather quickly.
Japan’s PMI composite finalized at 50.2, growth momentum falters
Japan’s private sector lost steam in May as final PMI Services reading slipped to 51.0 from April’s 52.4, while Composite PMI declined to 50.2 from 51.2. The data point to only marginal growth in overall activity, with a slowdown in services combining with a mild deterioration in manufacturing output.
S&P Global’s Annabel Fiddes noted that the rise in total new orders "moved closer to stagnation, as service sector sales grew at their slowest pace in six months and factory demand continued to decline. This moderation suggests that Japan’s private sector "may struggle to bounce back in the near-term".
Underlying concerns were linked to external and structural factors, including an uncertain global demand outlook, persistent labor shortages, and mounting cost pressures.
Australia’s GDP grows only 0.2% qoq in Q1, as weather and public investment drag
Australia’s GDP expanded just 0.2% qoq in Q1, falling short of expectations for 0.4% qoq growth. On an annual basis, GDP rose 1.3% yoy. However, GDP per capita declined by -0.2% qoq, marking a renewed contraction in individual economic output.
The ABS noted that severe weather disrupted key sectors including mining, tourism, and shipping, while also impacting domestic demand and exports.
The most notable drag came from public investment, which fell -2.0%, contributing to the largest negative impact from public spending since Q3 2017. Net exports also weighed slightly, subtracting -0.1 percentage points from quarterly growth.
Ethereum Poised To Surge — Key Resistance In Sight
Key Highlights
- Ethereum started a fresh increase above the $2,500 resistance.
- ETH is following a short-term contracting triangle forming with resistance at $2,800 on the daily chart.
- Bitcoin price is facing hurdles near the $107,000 resistance.
- XRP is showing positive signs and might soon aim for a move above $2.35.
Ethereum Technical Analysis
Ethereum remained stable above $1,800 and started a fresh increase. ETH cleared a few key hurdles near $2,200 to start a fresh surge.
Looking at the daily chart, the price surpassed the 50% Fib retracement level of the downward wave from the $3,740 swing high to the $1,379 low. ETH settled above the 100-day simple moving average (red) and now approaches the 200-day simple moving average (green).
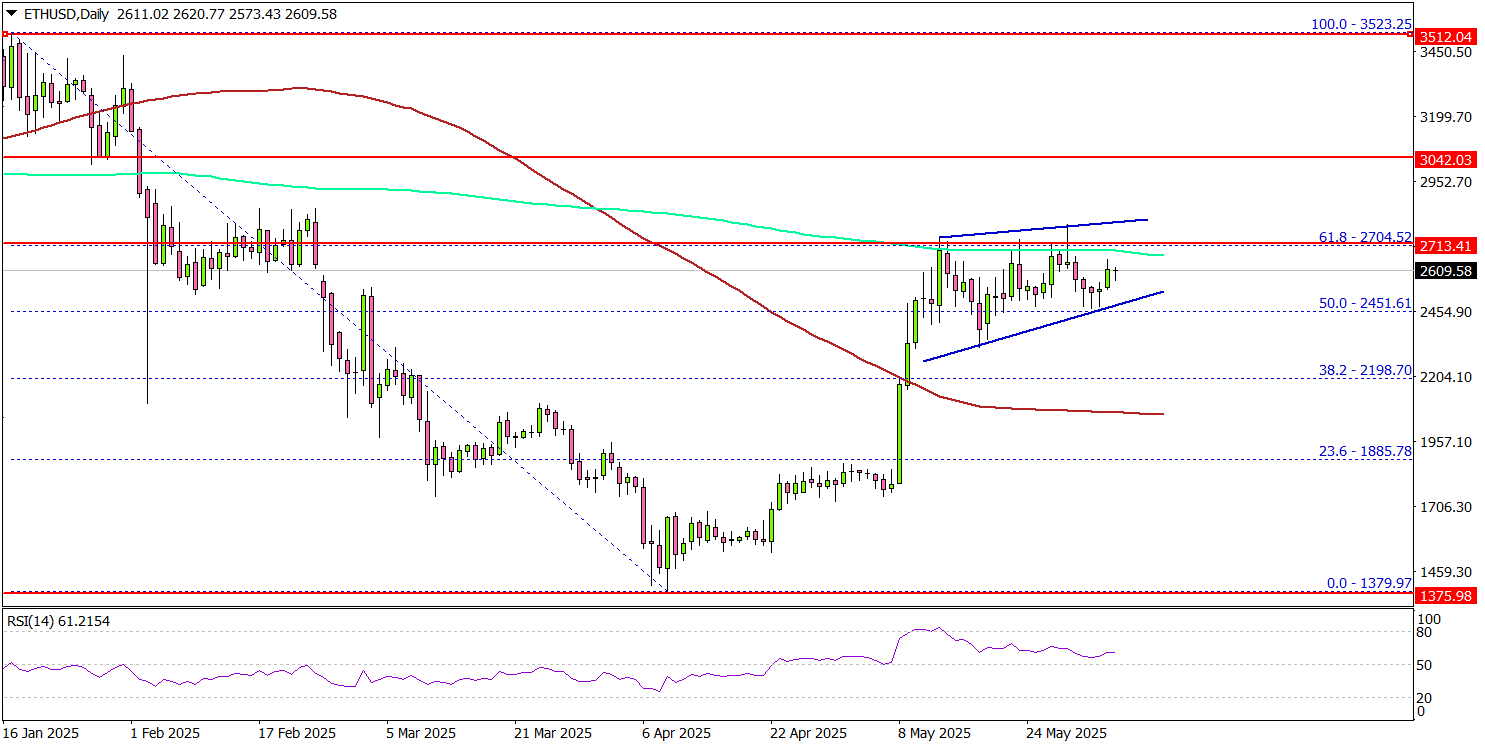
It is now facing resistance near the $2,700 zone and the 61.8% Fib retracement level of the downward wave from the $3,740 swing high to the $1,379 low.
The next major resistance is near the $2,800 level. There is also a short-term contracting triangle forming with resistance at $2,800 on the daily chart. A daily close above the $2,800 resistance zone could start another steady increase.
In the stated case, the price may perhaps rise toward the $3,000 level. The next stop for the bulls may perhaps be $3,120. On the downside, Ethereum might find support near the $2,450 level.
The next major support is $2,320, below which the price could slide toward $2,120. Any more losses might call for a move toward the $2,000 level.
Looking at Bitcoin, there was a steady increase above the $103,200 level, and the price is now facing hurdles near the $107,000 level.
Economic Releases
- Fed's Bostic speech.
- Fed's Cook speech.
Elliott Wave Analysis: Nasdaq (NQ) Set to Complete 5 Waves Impulse, Defining Bullish Trend
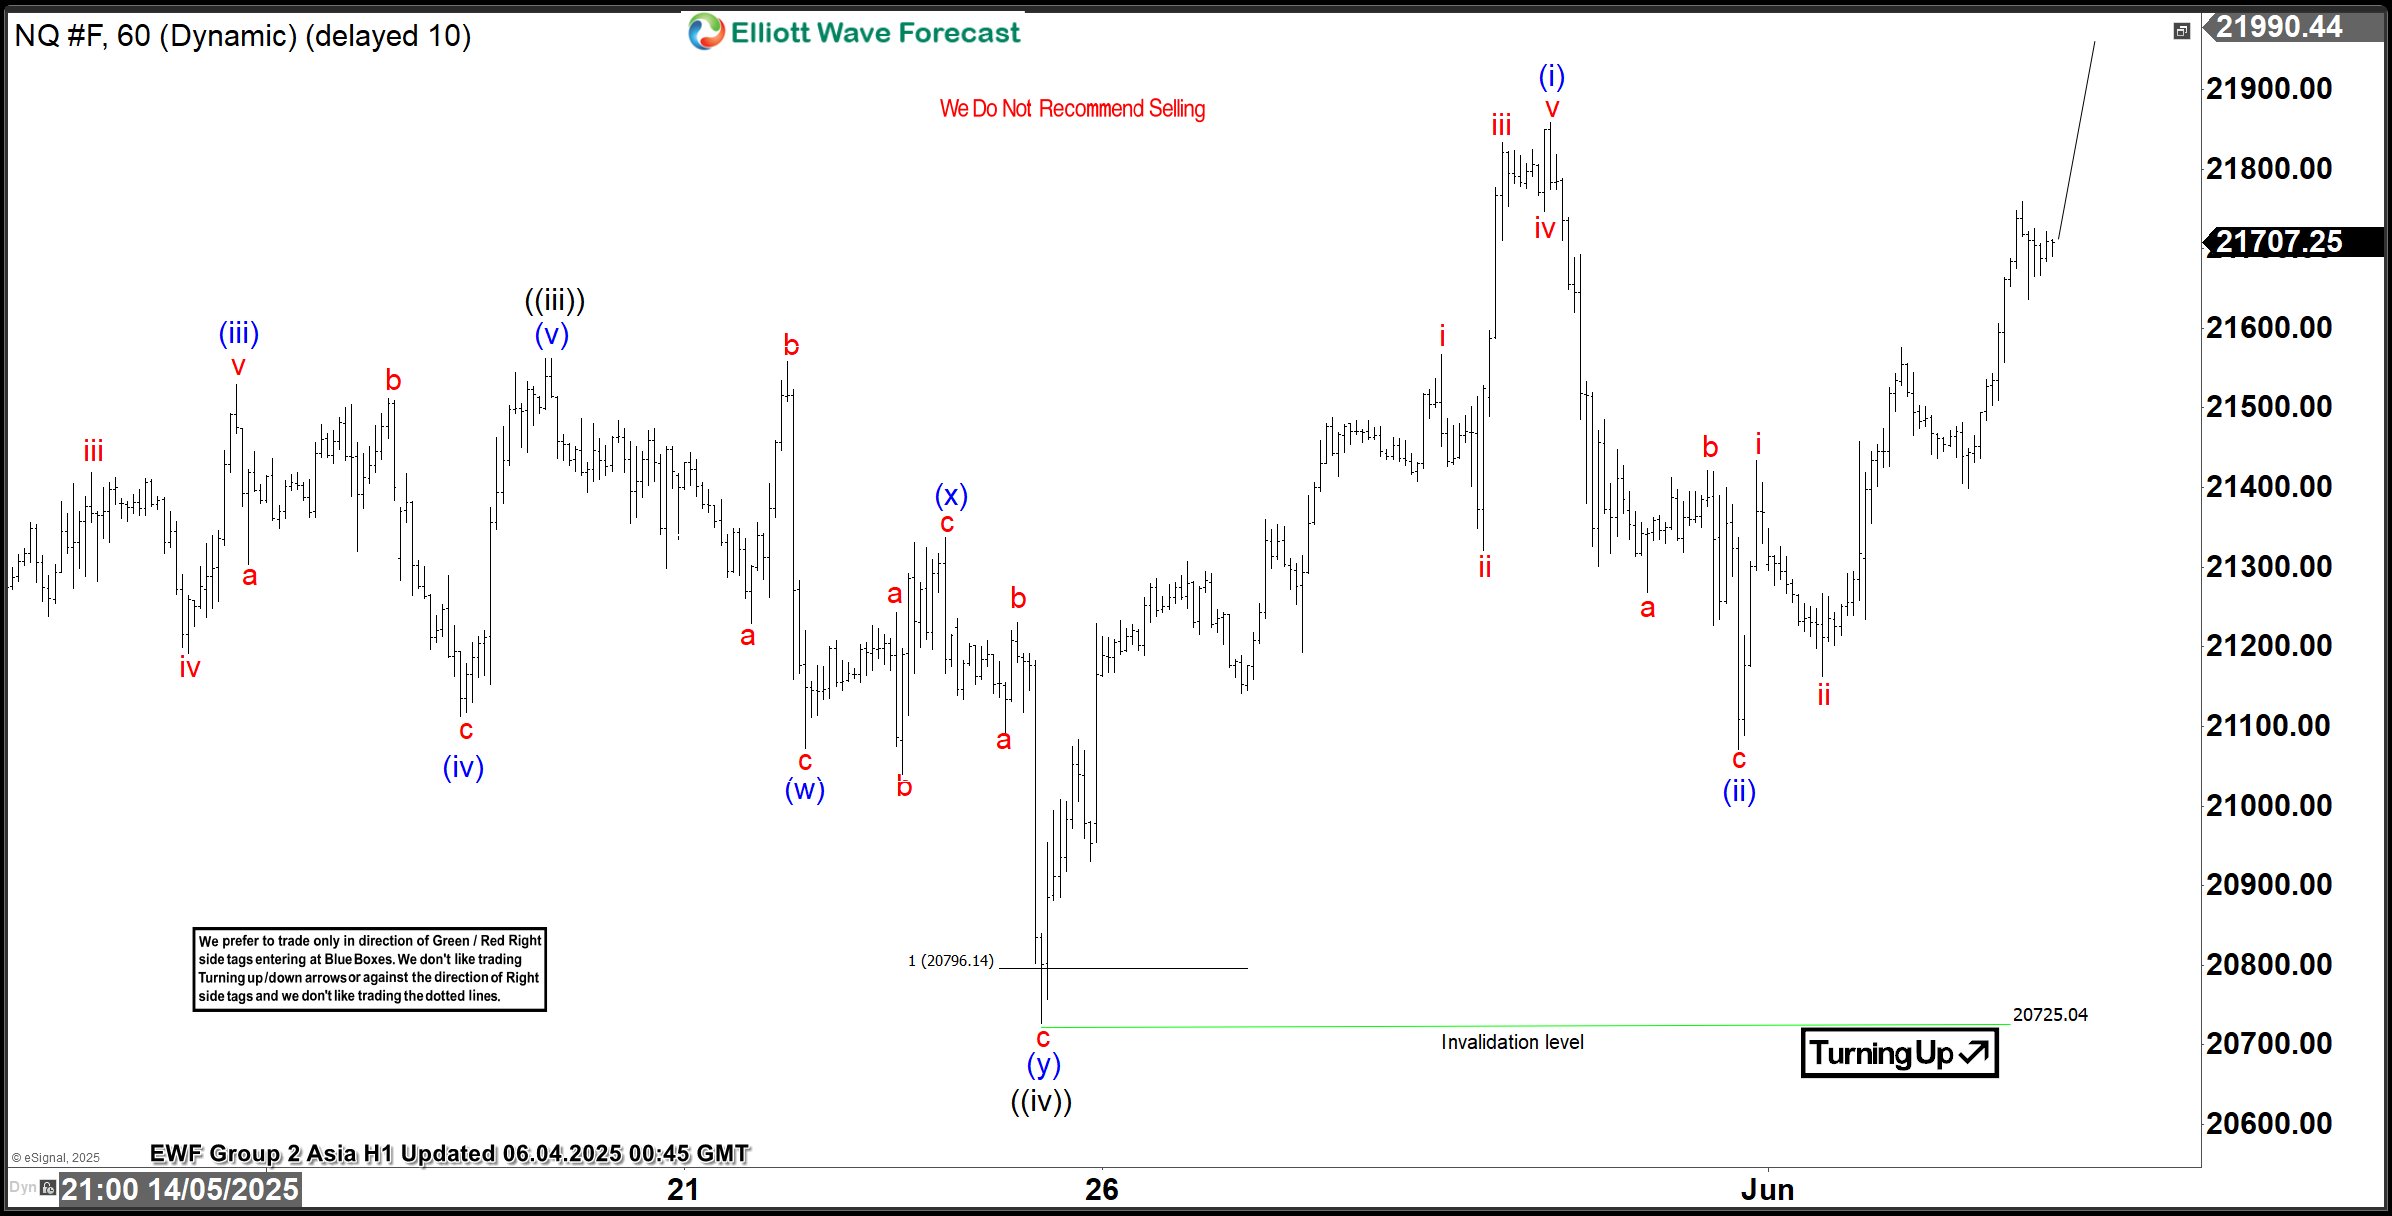
On April 7, 2025, the Nasdaq (NQ), like other major global indices, marked a significant low, setting the stage for a potential bullish trend. From this low, the index has embarked on a five-wave impulsive rally. This a hallmark of bullish momentum in Elliott Wave theory. The initial advance, wave 1, peaked at 18,361.5. It was then followed by a corrective pullback in wave 2, which found support at 16,735. From there, the index resumed its upward trajectory in wave 3. The move up in wave 3 has an internal five-wave structure, signaling strong bullish momentum.
Within wave 3, the first sub-wave, ((i)), concluded at 19,386.75. Subsequent pullback in wave ((ii)) found support at 17,700. The index then surged higher in wave ((iii)), reaching 21,562. Afterwards, a corrective dip in wave ((iv)) ended at 20,725.04, as illustrated on the one-hour chart. This wave ((iv)) correction unfolded as a double-three Elliott Wave pattern. Wave (w) bottomed at 21,072.75 and wave (x) peaked at 21,337.5. The final leg, wave (y), concluded at 20,725.04, completing the correction.
The Nasdaq has since turned higher in wave ((v)). From the wave ((iv)) low, wave (i) advanced to 21,858.75, followed by a pullback in wave (ii) to 21,071.5. The index is now poised to extend higher in wave (iii) of ((v)), continuing the impulsive rally from the April 7 low. In the near term, as long as the pivotal low at 20,725.04 holds, any pullbacks are expected to find support in a 3, 7, or 11-swing pattern, paving the way for further upside. This technical setup suggests the Nasdaq is well-positioned to sustain its bullish momentum in the coming sessions, provided key support levels remain intact.
Nasdaq 60-Minute Elliott Wave Technical Chart
Nasdaq (NQ) Elliott Wave Technical Video
https://www.youtube.com/watch?v=afkDPGxtLkI
EUR/USD Stalls Below Key Highs as ECB Meeting Looms — What’s Next?
The picture for currencies today is the exact reverse of yesterday - with traders fading extremes and booking profits before events like the upcoming NFP.
Safe-Haven majors like the CHF and JPY are lagging on the day with the USD leading, closely followed by the CAD - the Euro is right in the middle of the currency board down 0.55% on the day.
The ECB Meeting is coming up on Thursday 5th of June with broad expectations of a 25 bps cut before pausing in the July meeting - taking the Deposit Rate from 2.25% to 2%. We will get the Rate Decision at 8:15.
We got the overnight Eurozone Inflation report with the Headline CPI coming in just below 2% - the ECB will want to make sure to push these numbers up slightly, although the Central Bank probably has taken into account the lag for new inflationary boosts from Tariffs on exports to the US.
Let’s take a look at the levels from Daily to Hourly charts to prepare for what’s next.
EUR/USD Technical Analysis
Daily Timeframe
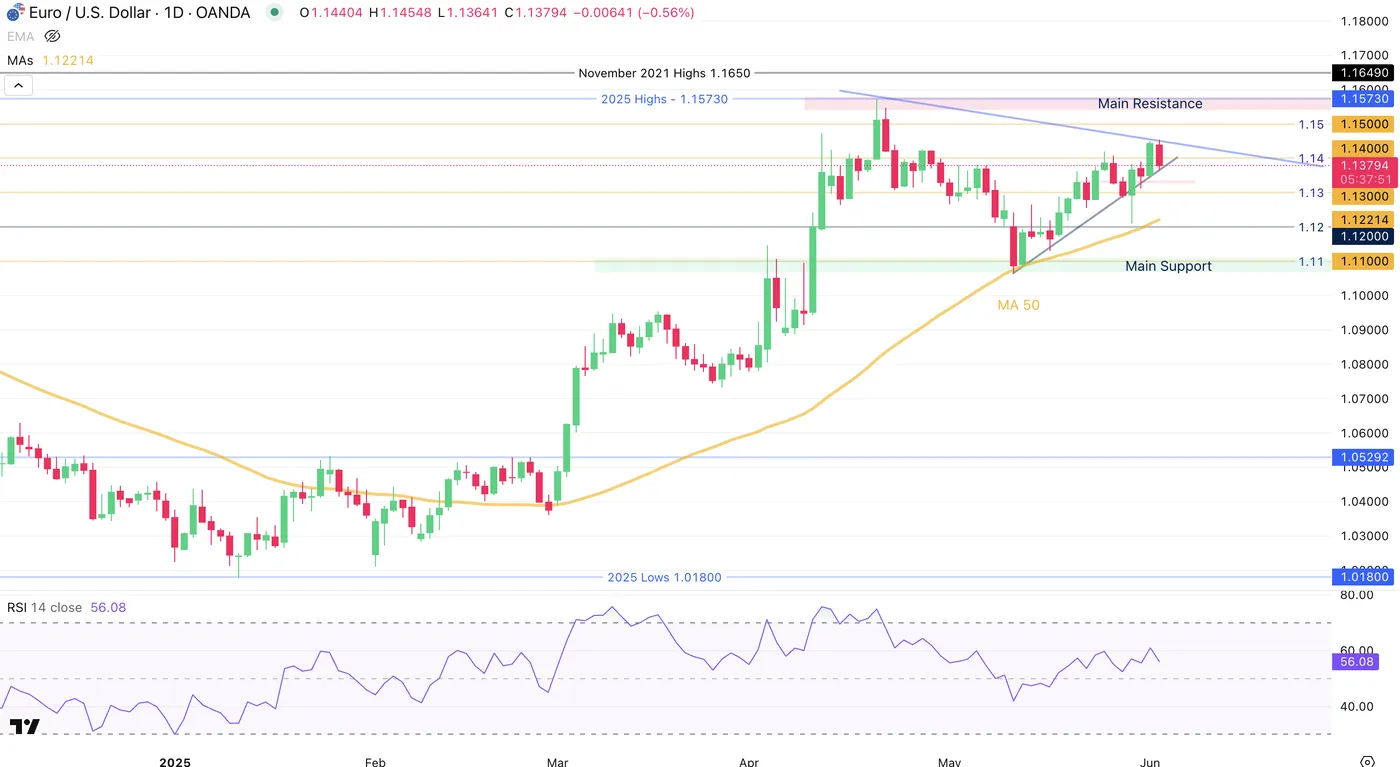
EURUSD Daily Chart, June 3, 2025. Source: TradingView
The Daily timeframe is showing mixed signs in terms of strength - the trend is still bullish for the currency pair though candles have been overlapping in the past few weeks.
This story gets confirmed with the Daily RSI not showing signs of expansion - bulls will have to monitor the tone from the ECB at the press conference 30 minutes after the release.
Less cuts are expected going forward therefore action will be focused on better data for the Eurozone.
The daily MA 50 has caught up to the current prices and is currently acting as immediate support, accompanied with the trendline.
In the meantime, the action is constrained within the Main resistance and support zones which we will see in more detail promptly.
4H Timeframe
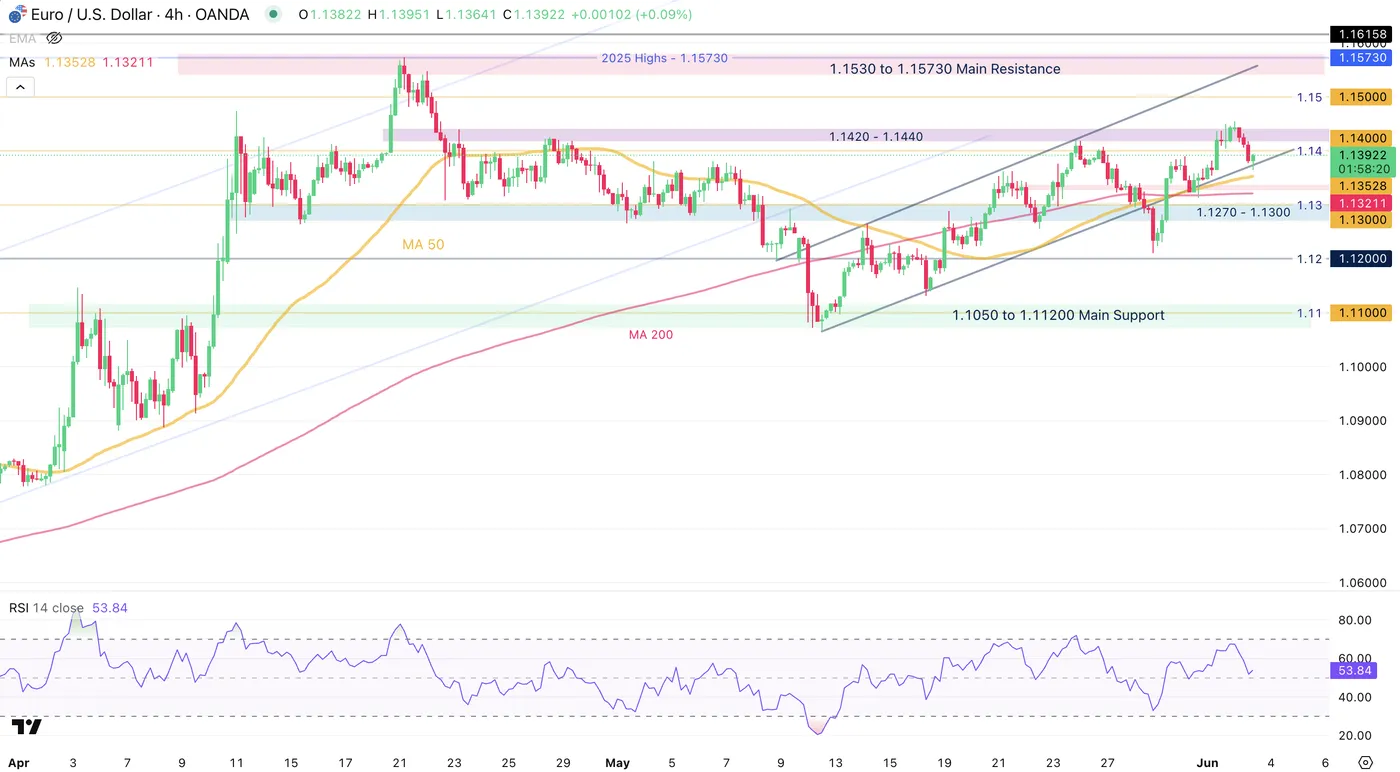
EURUSD 4H Chart, June 3, 2025. Source: TradingView
Taking a closer look at the 4H timeframe emphasizes the lack of clarity going into the ECB Meeting.
Prices have been seesawing through the current main pivot situated at 1.1330 and constrained in a slightly above 1000 pip range between the 1.1270 - 1.13 to 1.1420 - 1.1440.
The RSI is neutral and the MA 50 and 200 are immediate support, though we are looking more at holding the trendline from the hourly upward channel formed last week. Expect rangebound prices going into Thursday.
Any breakout from the range is pointing towards these main zones:
- Main Support Zone : 1.1050 to 1.1120
- Main Resistance Zone: 1.1530 to 1.15730
Hourly Timeframe
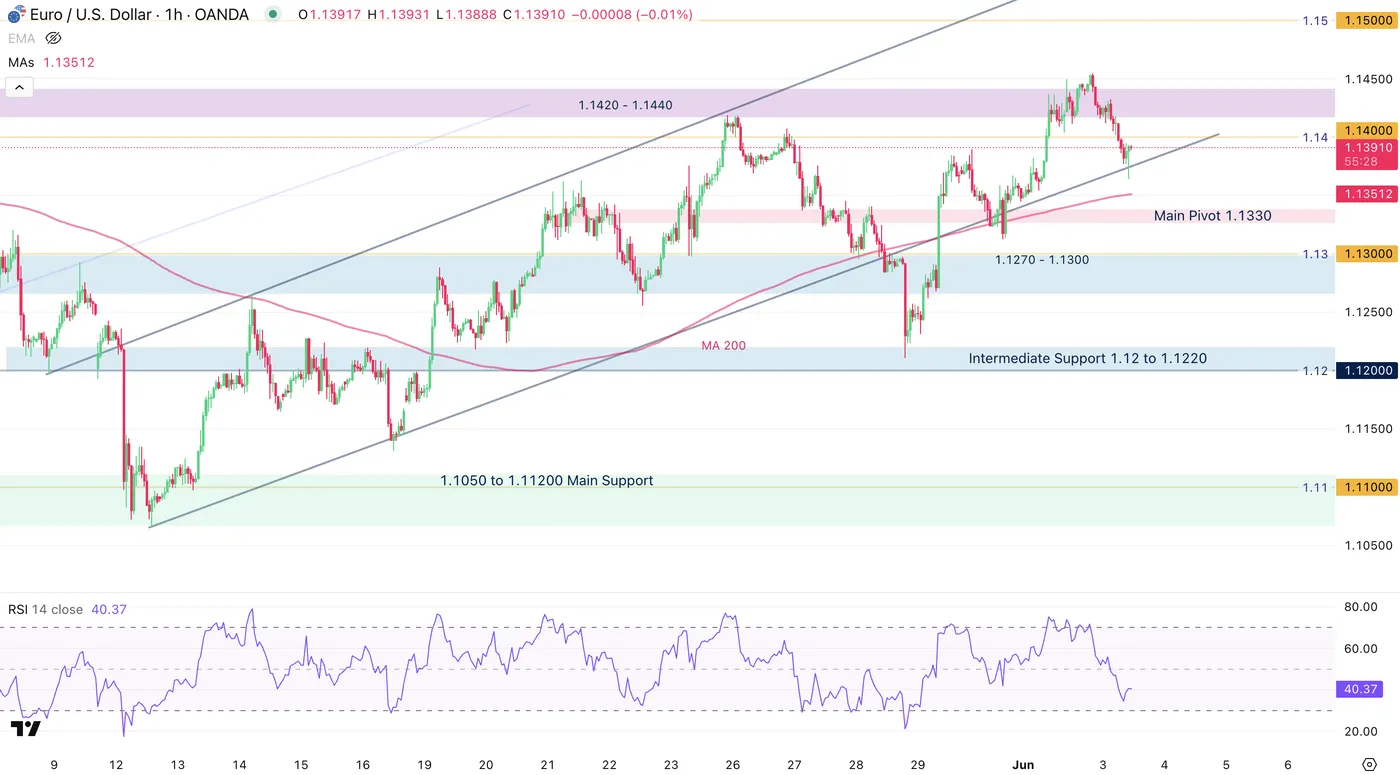
EURUSD 4H Chart, June 3, 2025. Source: TradingView
Prices just rejected the higher bound of the range and are now consolidating at the low of the upward channel.
Broad USD strength seems to be more on a mean-reversal basis therefore I am not expecting to see much direction.
Prices may try to test the MA 200 situated 300 pips from here therefore keep that one on your 1H charts.
Momentum is close to oversold on the hourly timeframe - keep in mind that markets tend to fade extremes going into key data, and NFP will still be looming on Friday - keep a close eye on the language from the ECB on Thursday, the conference is at 8:45 A.M. on the 5th of June.
Safe Trades!
How to Trade AUDCAD effectively – Exploiting the Range
While AUDCAD isn’t among the highest-volume pairs in Forex, it’s often in the lesser-traded instruments that sharp traders find unique opportunities.
Commodities heavily influence the Australian and Canadian dollars, as both nations are major exporters. The AUD tends to react more to moves in industrial metals—especially copper—while the CAD is tied to oil price fluctuations.
Beyond commodities, the currencies are driven by their respective economic ties: Canada is closely linked to trends in the U.S., whereas Australia is more sensitive to developments in China. In the absence of fresh geopolitical shocks, traders are focusing on central bank policy divergence and incoming economic data.
On that front, the Bank of Canada paused its rate-cutting cycle at its last meeting after starting in June 2024. Its next decision is due Wednesday, June 4, and markets widely expect another hold, as the BoC remains in wait-and-see mode following the latest U.S. tariff changes.
Meanwhile, the Reserve Bank of Australia kicked off its own cutting cycle in May 2025 with a 25 bps cut and signaled more may follow. This gives the pair a bearish tilt, though sentiment remains cautious until the economic impact of tariffs becomes clearer.
Let’s dive into the charts and examine AUDCAD across higher timeframes, starting from the weekly view to the 4-hour chart.
AUDCAD Weekly Timeframe
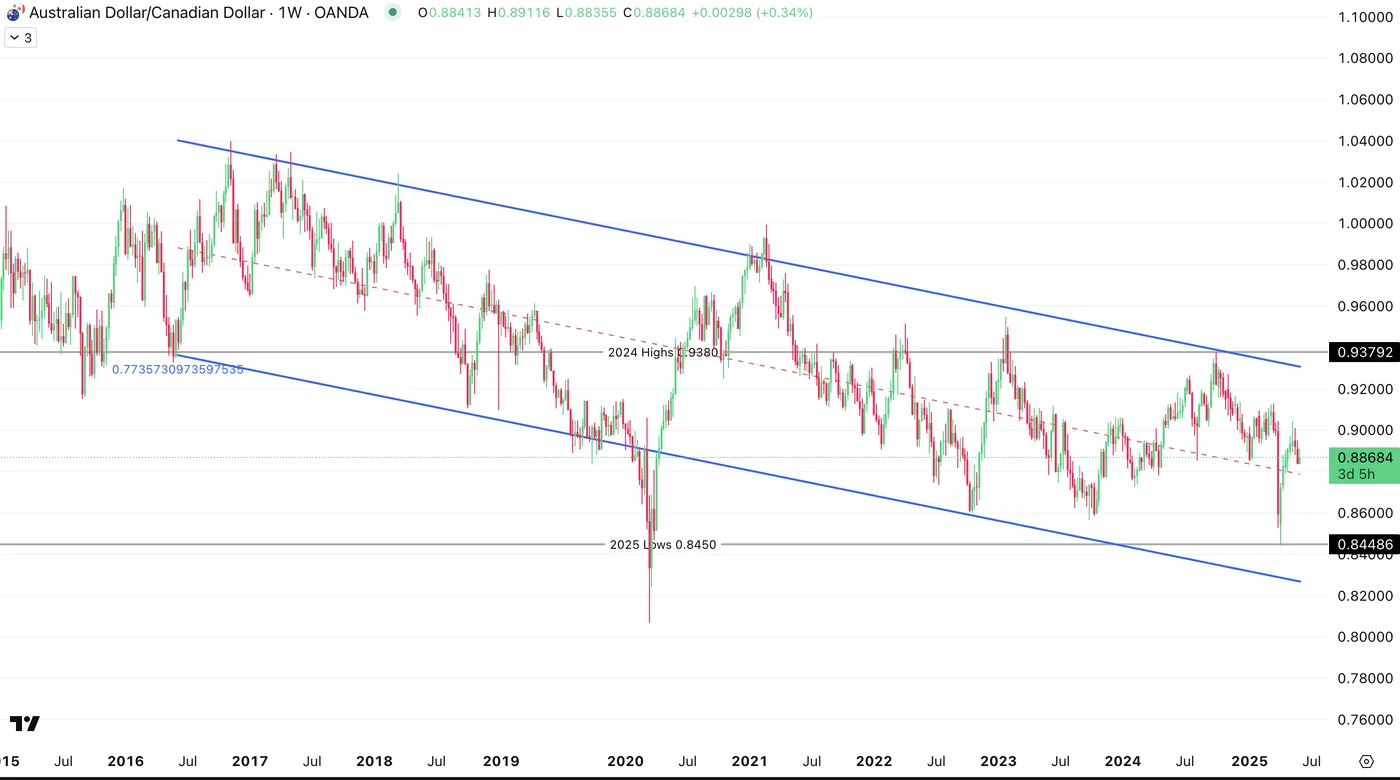
AUDCAD Weekly Chart, June 3, 2025. Source: TradingView
AUDCAD has been in a broader downtrend since 2016, though that long-term move has been marked by multiple intermediate upswings and pullbacks.
Given both currencies’ sensitivity to industrial commodity prices, they generally move in tandem with broader risk sentiment, resulting in relatively stable correlation patterns.
The pair often trades within well-defined ranges on the weekly chart rather than trending aggressively. At current levels, AUDCAD sits near the midpoint of that range—there is less technical direction at the current levels;
This is a good moment to zoom into the daily chart for more precise context and to identify shorter-term opportunities.
AUDCAD Daily Timeframe
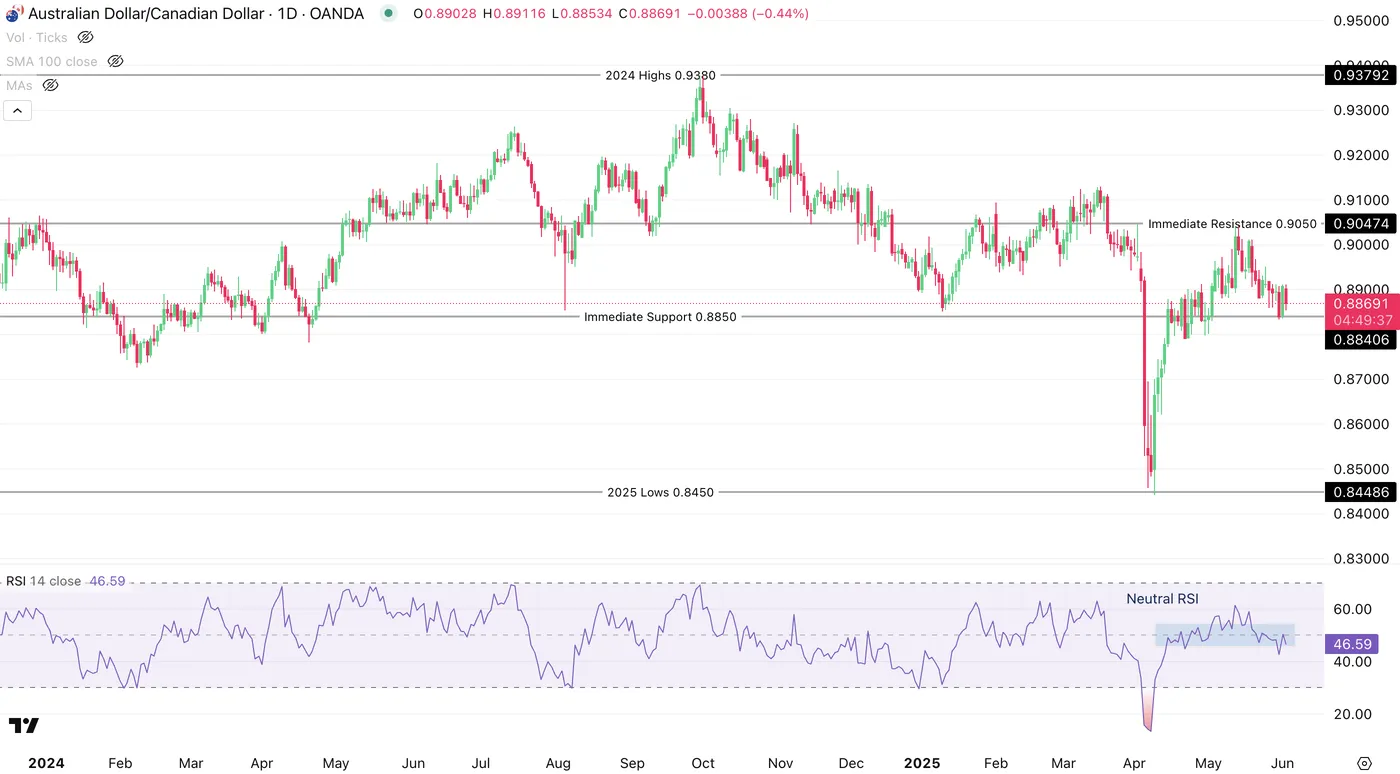
AUDCAD Daily Chart, June 3, 2025. Source: TradingView
The pair wasn’t immune to the volatility that shook Forex markets earlier this year.
AUDCAD had been trading up throughout 2024, profiting from the dovish stance and data coming out of Canada - the BoC started its cutting cycle almost a full year before the RBA! Weakness in the CAD was generally a theme of last year though and this weakness may be found in the current theme of cutting from the Australian Central Bank.
The Pair also had a major selloff on Liberation Day, forming the yearly lows at 0.8450 after coming right back into the current range.
For current trading, look at the range between the 0.8800 lower band and the 0.9050 higher band.
On a purely technical look, the pair is not showing major signs of volatility with the RSI in the neutral range - we are closer to the lower band - the situation may evolve with the upcoming BoC Meeting.
Let's take a closer look.
AUDCAD 4H Timeframe
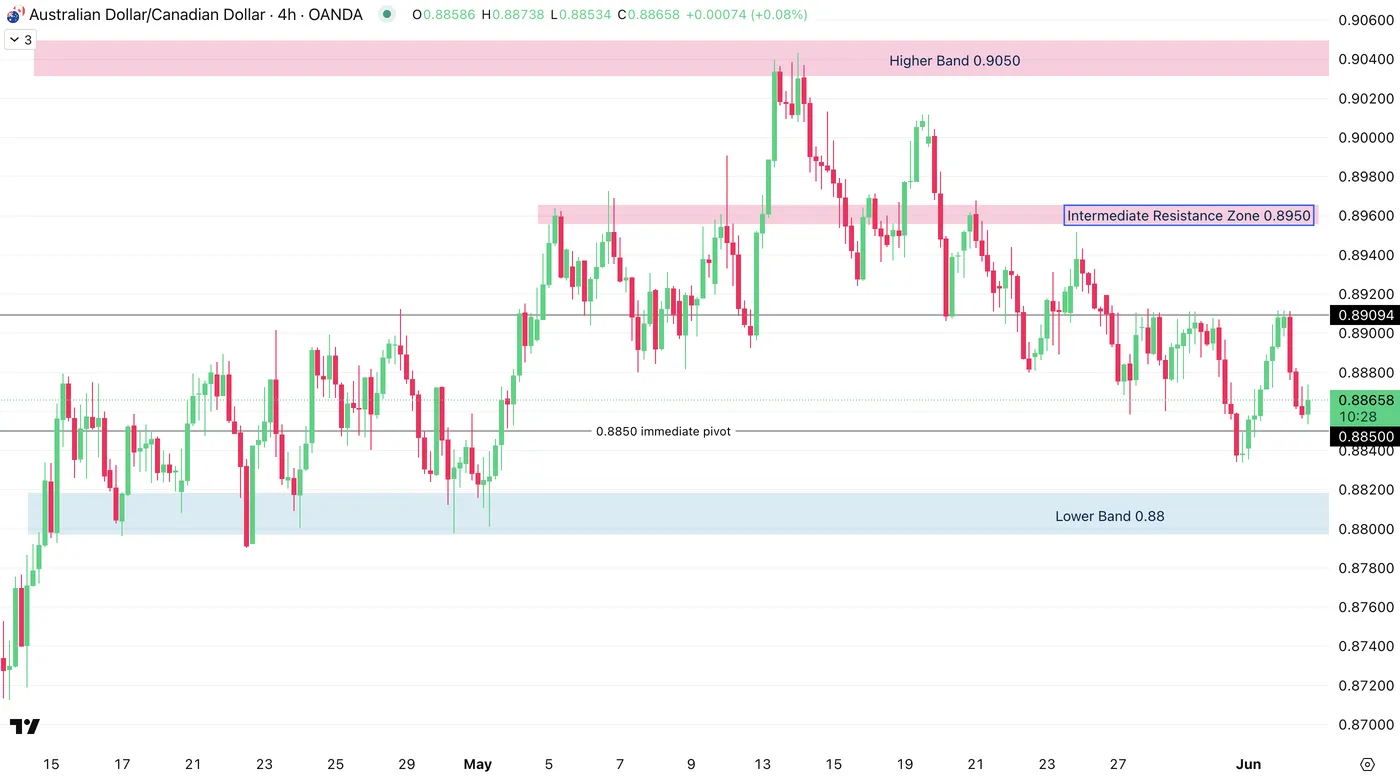
AUDCAD 4H Chart, June 3, 2025. Source: TradingView
After coming back from the extremes hit at the beginning of April, the currency pair has been contracting in volatility throughout the month of May.
The most immediate price action has been constrained in a 500 pip range between 0.8850 to 0.89 in the waiting for the release of the Bank of Canada Rate decision at 9:45 on Wednesday.
A break above this tight range hints at the Intermediate Resistance Zone around 0.8950 and a break below would look towards the lower Band at the key 0.88 psychological level.
Momentum is calm though expect more volatility as we progress through the week.
Safe Trades!
Silver (XAG/USD) Cools from 7-Month High on Profit Taking, Remains Bullish
Boasting a remarkable gain of 5.38% yesterday, silver prices have retraced somewhat in today’s session, owing to natural profit-taking and better-than-expected US labor data. XAG/USD currently trades around ~34.55350 per troy ounce, down -0.60% for the day.
XAG/USD: Key Takeaways
- Failing to find support around ~99.131, a weaker U.S. dollar (DXY) made way for massive silver gains in yesterday’s session, representing the metal’s best daily performance since October of last year.
- Silver has retraced from its highs in today’s session as markets look to secure profits alongside a positive JOLTS report, beating consensus by 290,000 thousand job openings.
Silver (XAG/USD): Precious metals gain on continued dollar weakness
Perhaps somewhat overshadowed by its yellow peer regarding performance and all-time highs in recent memory, yesterday’s session marks silver’s largest daily gain in over eight months, rising 5.38% in value compared to a more modest 2.80% gain for gold.
Looking to challenge previous highs made in October 2024, a trend of dollar weakness has allowed precious metals to rise in value, which are already pacing well for the year amid continued worries of global trade relations, geopolitical tensions, and uncertainty surrounding US monetary policy.
Markets now look ahead to speeches from various Fed policymakers in the next twenty-four hours and a rumoured phone call between Trump and Xi Jinping to discuss trade relations, as current negotiations prove unproductive.
Silver (XAG/USD): Fed policy dilemma boosts precious metal pricing
With various conflicting signals from recent economic data points, the Fed is currently in an unenviable position ahead of its June 18th meeting.
While recent releases showing a declining GDP and lower inflation would typically support rate cuts, today’s JOLTs report shows the US Labour market is more buoyant than once thought, suggesting that rates should remain unchanged.
At least in part due to recent tariff announcements, the Fed remains cautious owing to fears of ‘stagflation’, in which both inflation and unemployment would remain high. Highlighting “heightened risks to both employment and inflation targets” as justification for leaving rates unchanged in their previous meeting, the Federal Reserve is now faced with the following dilemma:
- Leave rates unchanged, prioritise an otherwise buoyant jobs market and low inflation, but risk further economic contraction.
- Cut rates, prioritise economic growth, but risk higher inflation and job market health.
Under current circumstances, at least in some regard, both outcomes can be seen as supportive of silver pricing. While lower rates typically favour non-yielding assets like silver, leaving rates unchanged risks further economic slowdown, boosting market uncertainty, and, by extension, safe-haven flows into precious metals.
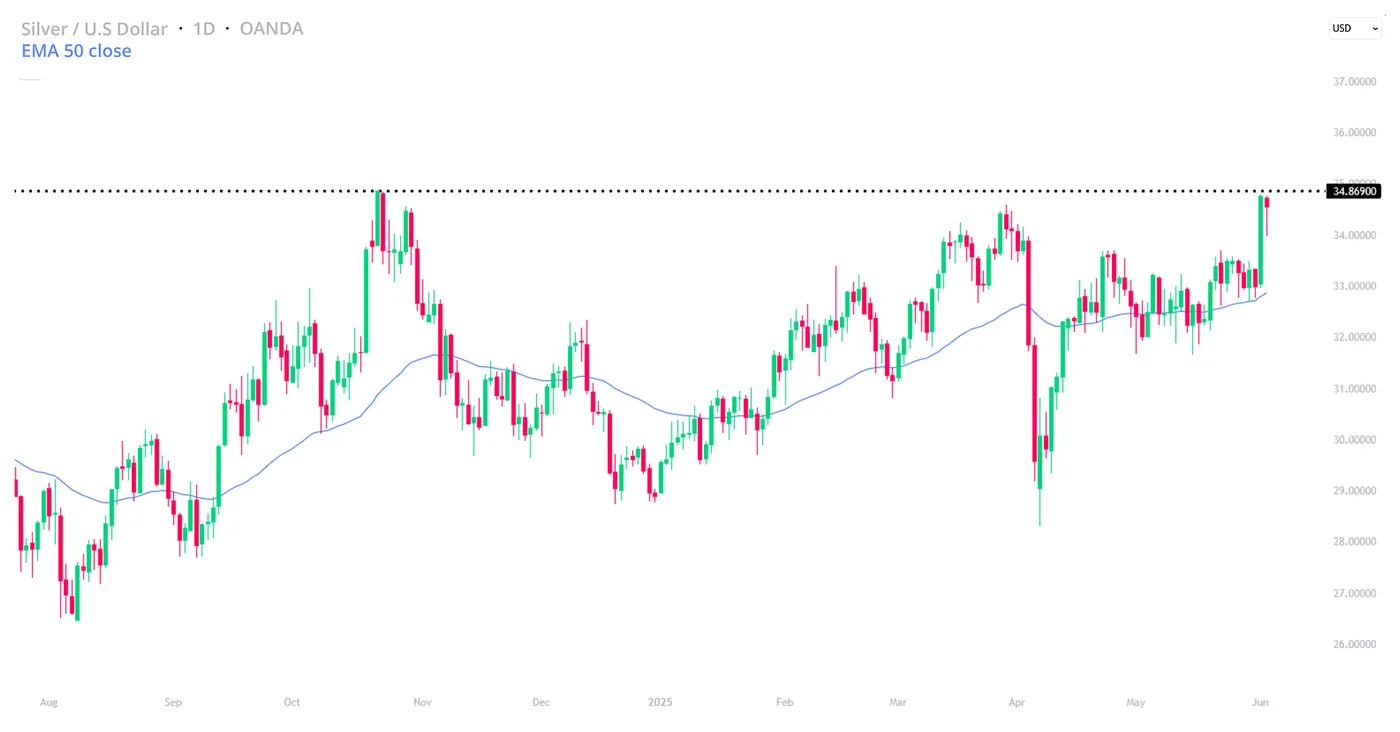
A chart showing the recent price action of XAGUSD. OANDA,TradingView, 03/06/2025
XAG/USD: Technical analysis
- As of June 3rd, silver has had its best year-to-date performance in over five years, aside from 2024. If it can break previous yearly highs around ~34.86900, silver will trade at its highest level since 2011 during the height of the Euro sovereign debt crisis.
- If price remains above 33.02574, we can expect silver to stage a move higher. Bulls will first aim to take out previous highs, then aim towards $36 per troy ounce, representing the next level of daily resistance.
S&P 500 Approaches 6000 Ahead of NFP
US Indices, which have started the day mixed, have appreciated this morning’s JOLTS report.
The data came out better than expected, with 7,391M Job Openings vs 7,200 Expected, a rise of 191,000 on the month.
This data set is still proving the strength of US Data amid geopolitical uncertainties.
Sentiment is positive throughout markets as gold did not maintain yesterday’s momentum, and indices are green all around.
Let’s look at the S&P 500 intra-day charts, as prices are less than 30 points from the 6,000 level.
S&P 500 Technical Analysis
S&P 500 4H Charts
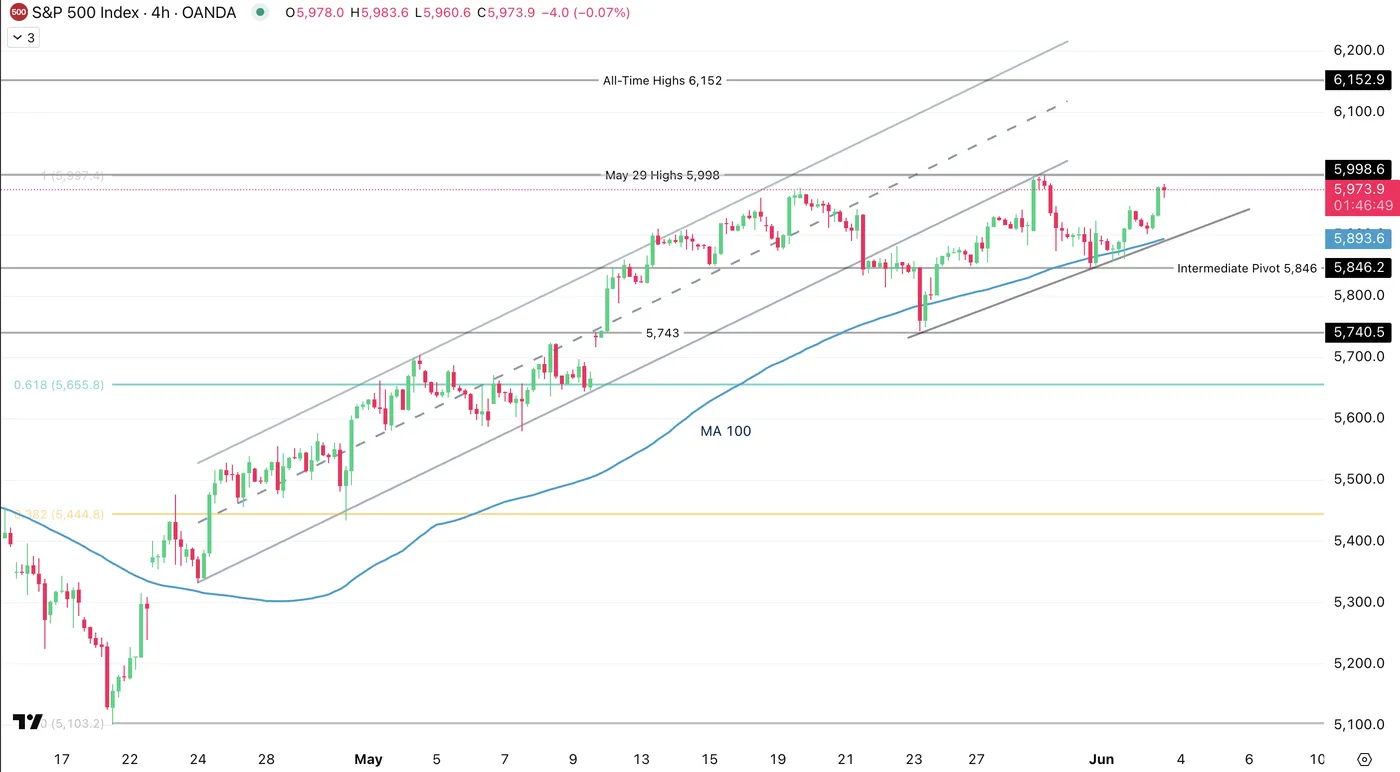
S&P 4H Chart, June 3, 2025. Source: TradingView
The S&P caught some decent momentum into the beginning of the week as US data has been coming better than expected.
A month-end bounce on the Immediate Pivot at 5,846 has led to a 125 point rally, forming an upward trendline consolidated by the 4H 100 period moving average.
Any breakout higher will look to test the all-time highs of 6,152- though more positive news and economic data will be required.
Let's take a closer look.
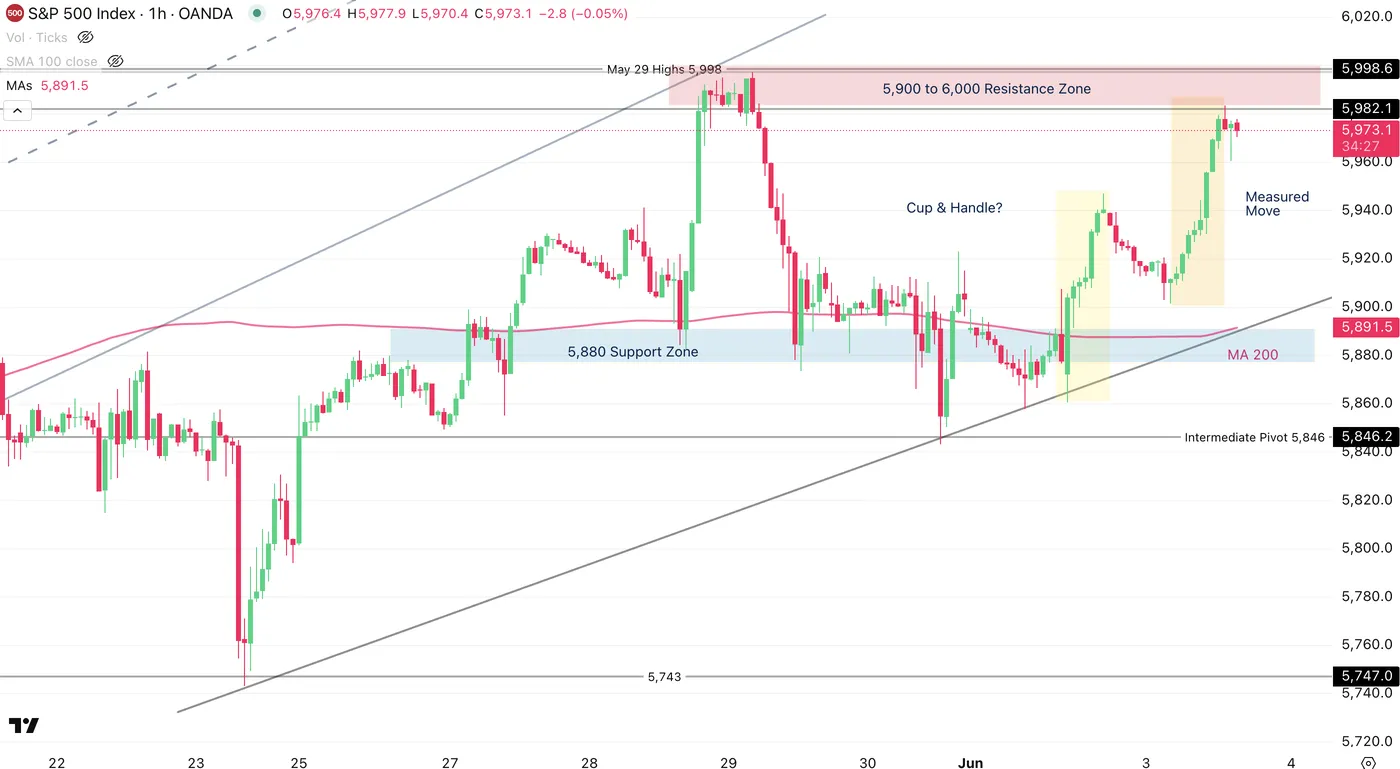
S&P 1H Chart, June 3, 2025. Source: TradingView
The S&P approached current levels with bullish impulsive measured moves, forming what resembles a Cup & Handle pattern - typically seen as bullish.
The overall bullish structure, held by the MA 200 at 5,891 within the current support zone, will meet some hurdles.
We are approaching the 5,990 to 6,000 resistance zone which may generate position closing as this month's Non-Farm Payroll report is looming.
A positive report may break through this level in a swing towards a test of the ATH, although a bad surprise might just do the reverse to revisit the 5,730 May Lows.
Safe Trades!