
Sample Category Title
NZDUSD Wave Analysis
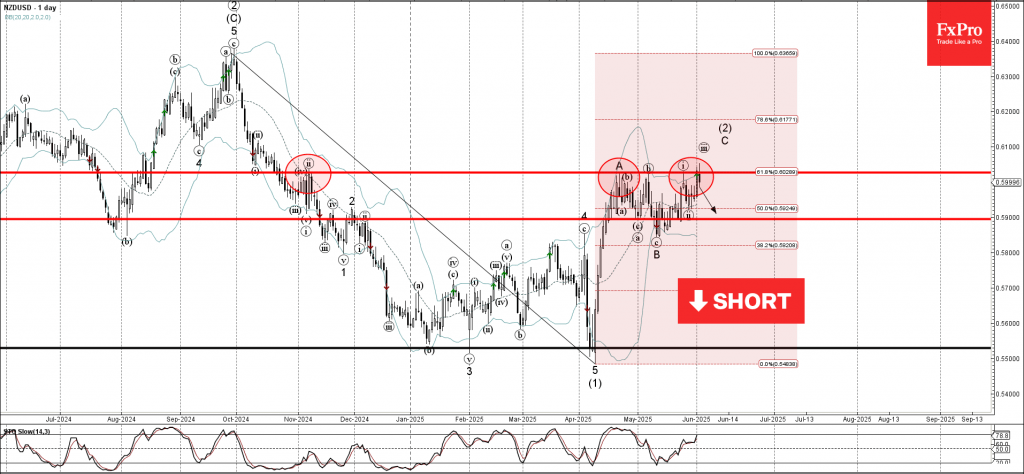
NZDUSD: ⬇️ Sell
- NZDUSD reversed from the resistance zone
- Likely to fall to support level 0.5900
NZDUSD currency pair recently reversed down from the resistance zone between the resistance level 0.6030 (which has been reversing the price from November), the upper daily Bollinger Band and the 61.8% Fibonacci correction of the downward impulse from September.
The downward reversal from this resistance zone stopped the C-wave of the previous ABC correction (2).
Given the strength of the resistance level of 0.6030 and the bearish divergence on the daily Stochastic, the NZDUSD currency pair can be expected to fall to the next support level of 0.5900.
Fed’s Bostic urges patience, in no hurry to adjust rates
Atlanta Fed President Raphael Bostic emphasized a patient approach to monetary policy in light of heightened uncertainty across trade, fiscal, and regulatory fronts. In an essay published today, Bostic noted that the US economy remains "broadly healthy", with inflation still above target but showing limited response—so far—from rising tariffs. “I am in no hurry to adjust our policy stance,” he wrote.
While macroeconomic indicators remain generally strong, Bostic flagged increasing caution among business leaders. Surveys conducted by the Atlanta Fed point to rising pessimism in the corporate sector, though this shift in sentiment was "not yet visible in hard economic data".
Bostic acknowledged that tariffs may eventually exert upward pressure on inflation, but reiterated that current readings do not yet reflect such an impact. "We might see upward pressure on prices over the coming weeks", he added.
Beyond trade, Bostic warned that broader policy shifts, in fiscal and regulatory domains, add to the difficulty of making reliable forecasts. With multiple potential shocks on the horizon, the best course, he argued, is to remain steady and flexible. external risks.
Sunset Market Commentary
Markets
European inflation numbers offered the proverbial “go” for Thursday’s ECB rate cut. Prices flatlined in May with both the headline and core (ex. food and energy prices) index coming in at 0% m/m. This resulted in a 1.9% and 2.3% y/y reading, missing estimates by 0.1 ppt. The services inflation gauge is closely watched because of its ties to wage growth and eased to the slowest pace since March of 2022 at 3.2%. It’s a sharp drop from April’s 4% but not one that’s necessarily going to be repeated in coming months when the (labour intensive) tourism season kicks in. It’s nevertheless silences the likes of Austria’s Holzmann, who last week argued for skipping the June meeting. We do expect the ECB to lay the groundwork for a pause after this week’s cut to 2% to see how the fiscal spending and trade war narrative pans out in the weeks thereafter. The impact of the CPI print on FI was limited. Markets did the math already, based amongst others on earlier misses in the French and Spanish outcome. Their too aggressive positioning (terminal rate seen between 1.5-1.75%) limits the scope for even lower yields as well, particularly at the front end. European yields are down around 2 bps on the day. Bunds slightly outperform Treasuries. US yields ease less than a basis point across the curve. Gilt in the UK are well bid, pushing the longest-term yields more than 6 bps down. Bank of England’s Mann helped shape this outperformance with her speech late Monday. She said that the central bank’s QT programme is offsetting some of the BoE’s efforts to reduce restrictiveness via rate cuts. Mann thereby opened the debate on downsizing the current £100bn per year bond portfolio reduction pace. The BoE discusses the matter always at its September meeting.
The US dollar gets some reprieve on FX markets, recouping most of its setback yesterday and ignoring the OECD’s downward growth revision (see below) in an otherwise dull trading session. EUR/USD descends from it’s one-month high around 1.145 to change hands around 1.387 currently. USD/JPY got no further than 143.35 and the trade-weighted dollar index rises to back above 99. The technical picture looks dire still though with the April multiyear low around 98 dangerously close. The dollar’s lingering vulnerability was exposed by last week’s second-tier US eco data (eg. second Q1 GDP reading and jobless claims). The eco calendar for the US starts heating up today with the JOLTS report scheduled for release after wrapping up this report. FX moves ex. USD in most cases are rangebound.
News & Views
The OECD published its latest global economic outlook. They point to weakening global economic prospects with substantial barriers to trade, tighter financial conditions, diminishing confidence and heightened policy uncertainty all projected to have an adverse impact on growth. Global growth is expected to slow from 3.3% last year to 2.9% in both 2025 & 2026. The US, Canada, Mexico and China will take the brunt of the slowdown. The OECD pencils in 1.6% and 1.5% growth for this year and next for the US (from 2.8%) whereas EMU growth is projected to strengthen from 0.8% in 2024 to 1% in 2025 and 1.2% in 2026. Higher trade costs in countries raising tariffs are expected to push inflation up further, although the impact will be partially offset by weaker commodity prices. Downside risks around the OECD scenario include further trade fragmentation, more persistent inflation and more fiscal pressure coming from higher debt payments. Upside risks are a reversal of new trade barriers, peaceful resolutions in Ukraine and the Middle East.
Swiss inflation rose by 0.1% M/M in May, but prices fell compared with a year ago (-0.1%) for the first time since March 2021. On a monthly basis, rising prices for housing rentals, international package holidays, fruiting vegetables and stone fruits contrasted with lower prices for air transport, supplementary accommodation and heating oil. Core inflation printed at 0.1% M/M and +0.5% Y/Y. Goods prices rose 0.2% M/M to be down 1.9% Y/Y. Services inflation stood at 0.1% M/M and 1.1% Y/Y. Today’s CPI print leaves the Swiss National Bank little choice but to further reduce its policy rate, from 0.25% to 0% at the June 19 policy meeting. The Swiss franc loses slightly ground today, trading at EUR/CHF 0.9365.
USD/JPY Mid-Day Outlook
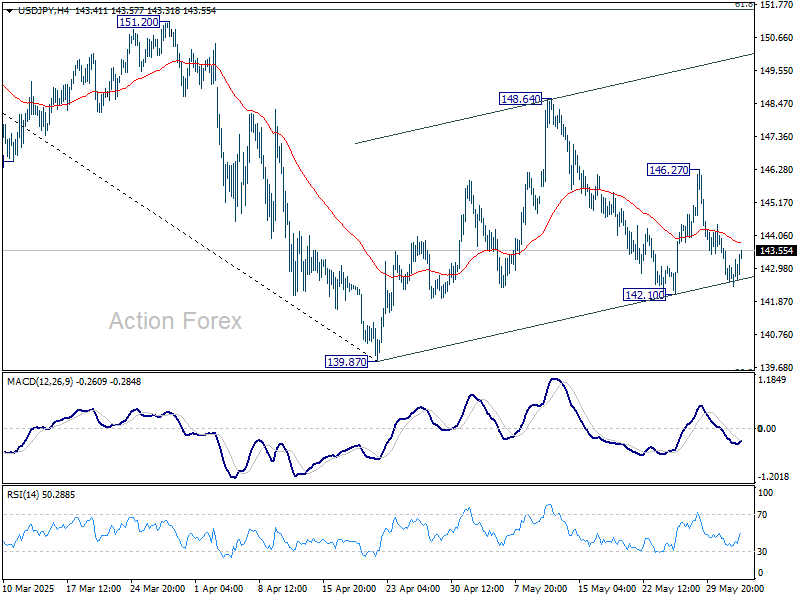
Daily Pivots: (S1) 142.16; (P) 143.08; (R1) 143.61; More...
No change in USD/JPY's outlook and intraday bias remains neutral. On the upside, above 146.27 will target 148.64 resistance first. Firm break there will resume the rebound from 139.87. Nevertheless, break of 142.10 will bring deeper fall back to 139.87 low.
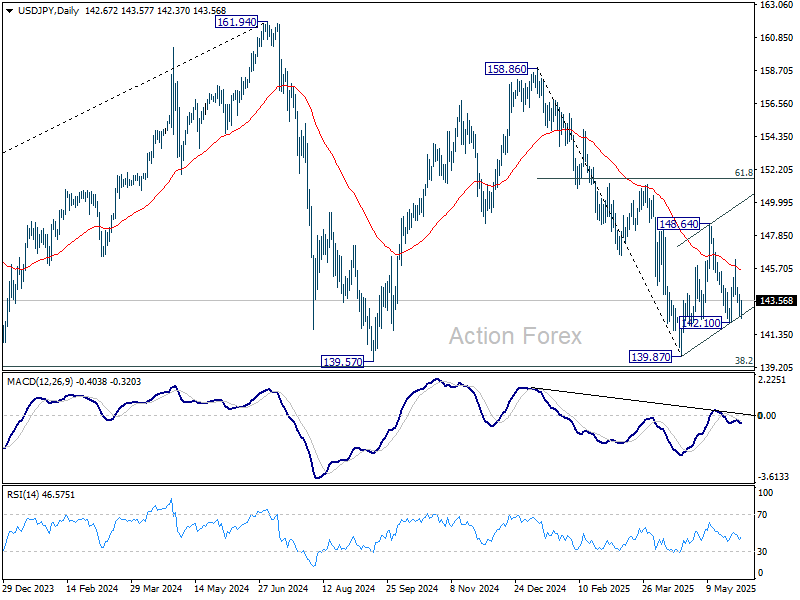
In the bigger picture, price actions from 161.94 are seen as a corrective pattern to rise from 102.58 (2021 low), with fall from 158.86 as the third leg. Strong support should be seen from 38.2% retracement of 102.58 to 161.94 at 139.26 to bring rebound. However, sustained break of 139.26 would open up deeper medium term decline to 61.8% retracement at 125.25.
USD/CHF Mid-Day Outlook
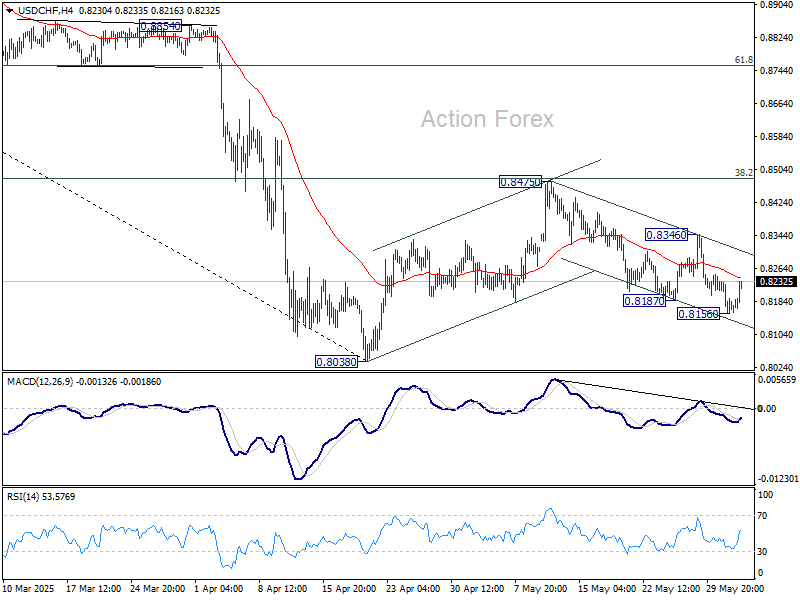
Daily Pivots: (S1) 0.8139; (P) 0.8189; (R1) 0.8222; More….
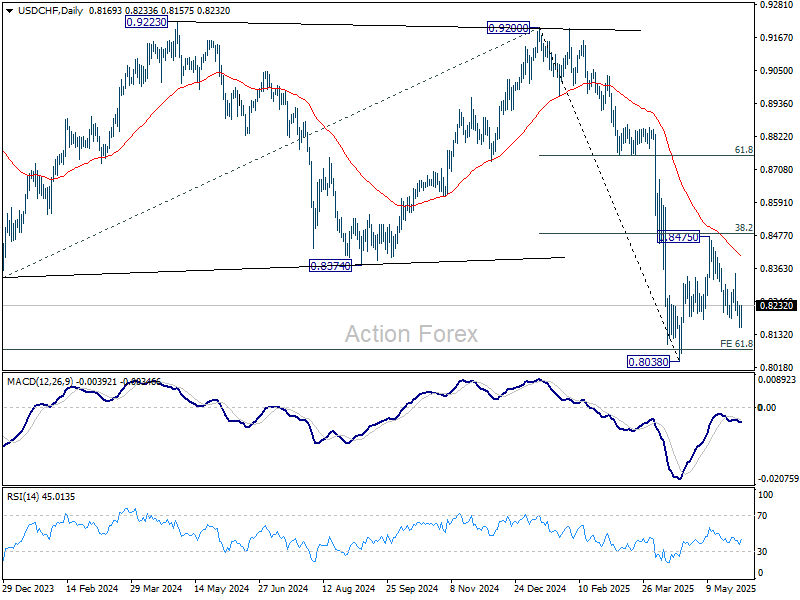
Intraday bias in USD/CHF is turned neutral with current recovery. Fall from 0.8475 could still extend lower, and break of 0.8156 will target 0.8038 low. But strong support should be seen from there to bring rebound, at least on first attempt. On the upside, break of 0.8346 resistance will extend the corrective pattern from 0.8038 with another rising leg.
In the bigger picture, long term down trend from 1.0342 (2017 high) is still in progress and met 61.8% projection of 1.0146 (2022 high) to 0.8332 from 0.9200 at 0.8079 already. In any case, outlook will stay bearish as long as 55 W EMA (now at 0.8732) holds. Sustained break of 0.8079 will target 100% projection at 0.7382.
GBP/USD Mid-Day Outlook
Daily Pivots: (S1) 1.3478; (P) 1.3519; (R1) 1.3585; More...
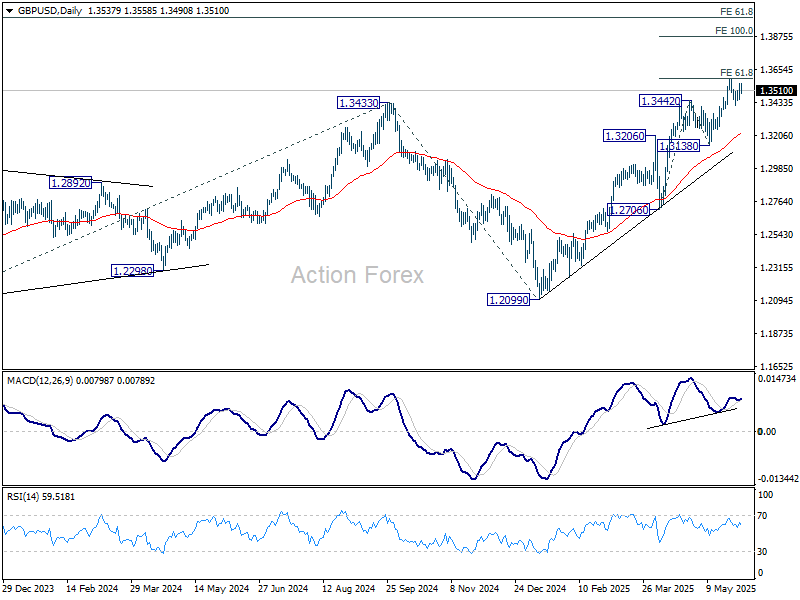
Intraday bias in GBP/USD remains neutral for the moment. With 1.3389 support intact, further rise is expected. On the upside, firm break of 1.3592 will resume larger up trend to 100% projection of 1.2706 to 1.3442 from 1.3138 at 1.3874. However, decisive break of 1.3389 will confirm short term topping, and turn bias back to the downside for 1.3138 support instead.
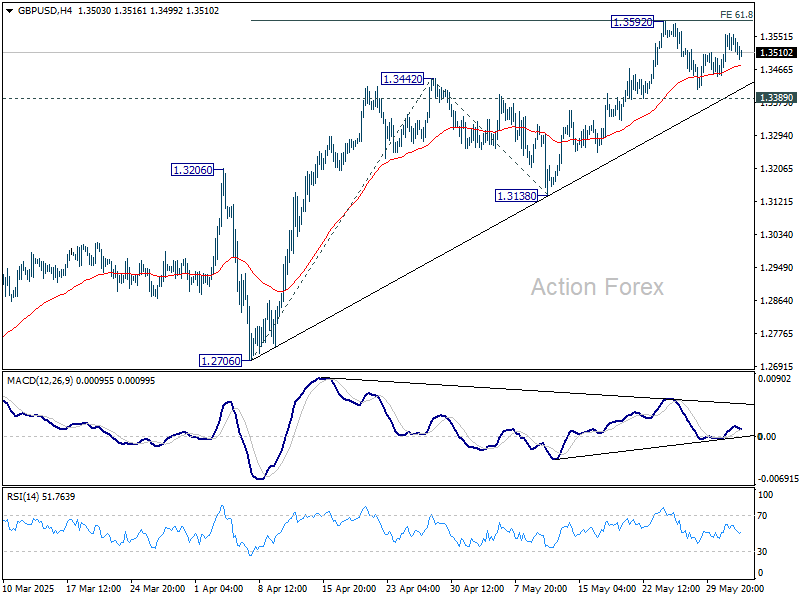
In the bigger picture, up trend from 1.3051 (2022 low) is in progress. Next medium term target is 61.8% projection of 1.0351 to 1.3433 from 1.2099 at 1.4004. Outlook will now stay bullish as long as 55 W EMA (now at 1.2866) holds, even in case of deep pullback.
EUR/USD Mid-Day Outlook
Daily Pivots: (S1) 1.1377; (P) 1.1413; (R1) 1.1480; More...
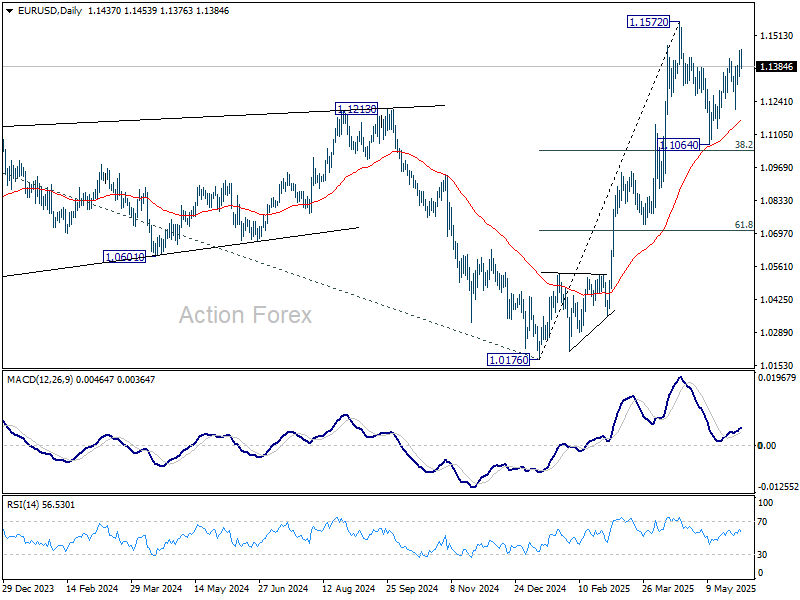
Intraday bias in EUR/USD is turned neutral with current retreat. Rebound from 1.1064 could extend higher, but strong resistance should be seen from 1.1572 to limit upside, at least on first attempt. On the downside, break of 1.1209 support will indicate that the corrective pattern from 1.1572 has started the third leg, and target 1.1064 support.
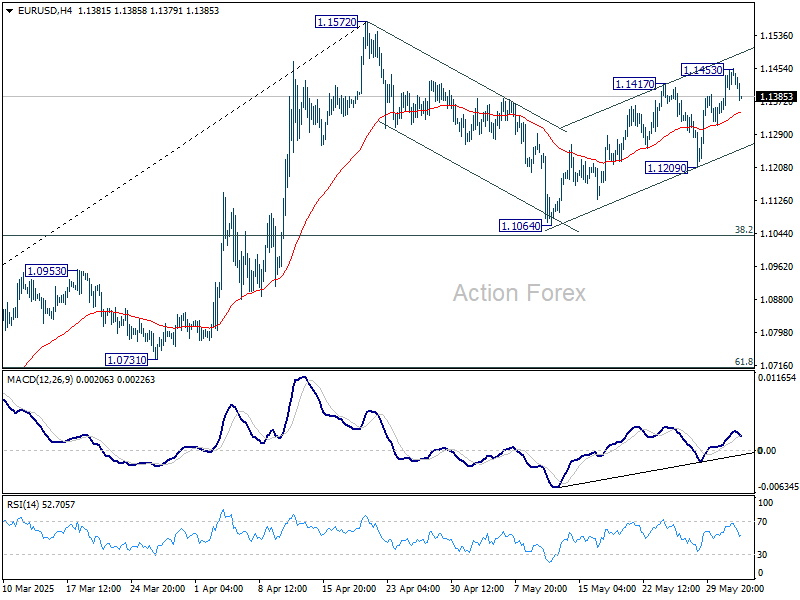
In the bigger picture, rise from 0.9534 long term bottom could be correcting the multi-decade downtrend or the start of a long term up trend. In either case, further rise should be seen to 100% projection of 0.9534 to 1.1274 from 1.0176 at 1.1916. This will now remain the favored case as long as 55 W EMA (now at 1.0856) holds.
Euro Slips on Softer CPI, But Trading Largely Listless
The currency markets remain largely listless today, with all major pairs and crosses still trapped within last week's ranges. Euro edged slightly lower following the release of Eurozone CPI data, which showed inflation falling below the ECB’s 2% target for the first time since September last year. The core measure also softened notably, reinforcing the view that disinflationary pressures—particularly within services—are well entrenched. With inflation now comfortably back within target, markets have little doubt that ECB will proceed with a 25bps rate cut this Thursday.
Uncertainty over tariffs continues to hover as a key wildcard. With little clarity on whether the US will escalate its trade actions further, markets are reluctant to commit. A July pause from ECB remains the base case, but further action could hinge on whether tariffs ultimately push inflation up through cost channels—or suppress demand and contribute to disinflation. This dilemma is front and center as policymakers navigate crosscurrents in growth and prices.
Adding to the cautious mood, the OECD revised its global growth forecasts downward. It now sees world GDP expanding just 2.9% in both 2025 and 2026, citing increased trade barriers and lingering policy uncertainty as key drags. OECD Secretary General Mathias Cormann warned that a further 10 percentage point hike in US bilateral tariffs could shave 0.3% off global output over two years, while likely adding to inflation in affected countries.
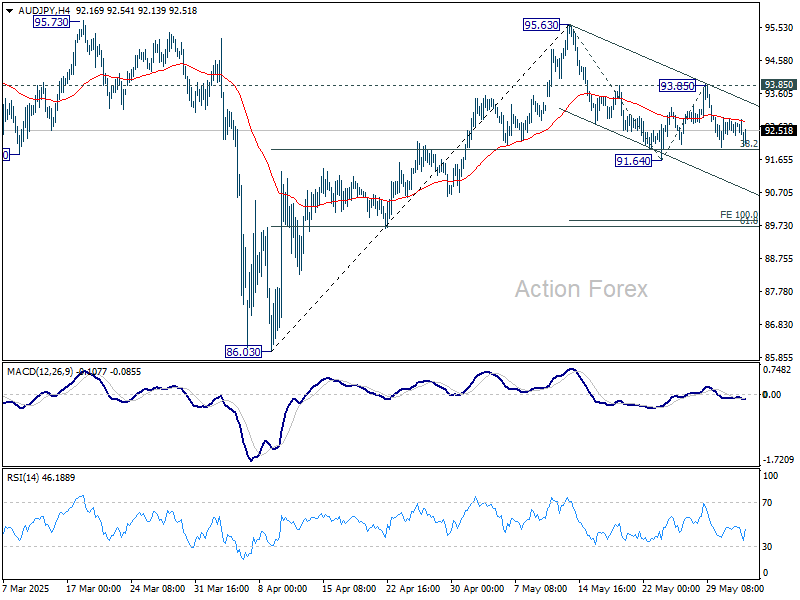
Technically, AUD/JPY continues to press 38.2% retracement of 86.03 to 95.63 at 91.96. Firm break of this fibonacci level will extend the correction from 95.63 to 100% projection of 95.63 to 91.64 from 93.85 at 89.86. Nevertheless, strong bounce from current level, followed by break of 93.85 resistance, will argue that rise from 86.03 is ready to resume through 95.63.
In Europe, at the time of writing, FTSE is up 0.17%. DAX is up 0.16%. CAC is down -0.15%. UK 10-year yield is down -0.038 at 4.632. Germany 10-year yield is down -0.019 at 2.51. Earlier in Asia, Nikkei fell -0.06%. Hong Kong HSI rose 1.53%. China Shanghai SSE rose 0.43%. Singapore Strait times rose 0.10%. Japan 10-year JGB yield fell -0.27 to 1.482.
BoE's Bailey: Rate path still downward, but clouded by unpredictability
BoE Governor Andrew Bailey told the Treasury Committee today that while the direction for interest rates remains downward, the outlook has become increasingly uncertain.
Declining to pre-commit to a vote at the upcoming June meeting, Bailey said, “the path remains downwards, but how far and how quickly is now shrouded in a lot more uncertainty.”
He emphasized the role of external forces, noting that the Bank has revised its language to reflect the “unpredictable” nature of the current global environment.
His comments were echoed by fellow policymakers Catherine Mann and Sarah Breeden, who both acknowledged that rates are likely headed lower but stressed the difficulty in forecasting the exact pace or scale of future cuts.
Mann warned against assuming a fixed glide path, while Breeden said “there is uncertainty about how far, how fast.”
Eurozone CPI falls to 1.9%, below ECB target for first time since Sep 2024
Eurozone inflation dipped back below the ECB’s 2% target for the first time since September 2024. Headline CPI fell from 2.2% yoy to 1.9% yoy in May, undershooting expectations of 2.0%. Core CPI (ex-energy, food, alcohol & tobacco) also eased more than forecast to 2.3% from 2.7%.
The disinflation was led by a sharp slowdown in services inflation, which dropped from 4.0% yoy to 3.2% yoy. Non-energy industrial goods remained unchanged at 0.6% yoy. Energy prices continued to contract at -3.6% yoy, reinforcing the broader downward pressure. Despite a slight uptick in food and alcohol inflation to 3.3% yoy, the overall picture confirms easing price momentum across key sectors.
Swiss CPI falls to -0.1% yoy, first negative since 2021
Swiss consumer inflation turned negative in May for the first time since March 2021, with headline CPI falling -0.1% yoy, down from 0.0% in April yoy. Core inflation, which strips out volatile components such as fresh food and energy, slipped to 0.5% yoy from 0.6% yoy previously.
On a monthly basis, both headline and core CPI rose 0.1%, in line with expectations.
The breakdown reveals that domestic product prices grew just 0.2% mom and decelerated to from 0.8% yoy to 0.6% yoy. Imported goods prices were flat on the month and fell -2.4% yoy, ticked up from -2.5% yoy.
BoJ's Ueda: Ready to hike if wage growth recovers from tariff drag
BoJ Governor Kazuo Ueda told parliament today that recently imposed U.S. tariffs could weigh on Japanese corporate sentiment, potentially impacting winter bonus payments and next year’s wage negotiations.
He acknowledged that wage growth may "slow somewhat" in the near term due to these external pressures. However, Ueda expressed confidence that wage momentum would eventually "re-accelerate", helping to sustain a moderate growth in household consumption.
Looking ahead, Ueda reiterated the BoJ’s readiness to adjust its ultra-loose policy if the economy evolves in line with its projections. “If we're convinced our forecast will materialize, we will adjust the degree of monetary support by raising interest rates,” he said.
However, he cautioned that uncertainty surrounding the economic outlook remains “extremely high.”
RBA's Hunter: AUD’s recent resilience linked to global shift away from USD exposure
RBA Chief Economist Sarah Hunter addressed the unusual behavior of the Australian Dollar in recent months in a speech today. She highlighted that while initial moves were consistent with past risk-off episodes, the currency’s subsequent rebound against the US Dollar stood out as "more unusual".
On a "trade-weighted" basis, AUD has remained broadly stable, even though it has appreciated against the greenback and the Chinese renminbi, while weakening against most other major currencies.
This divergence, Hunter explained, stems from "offsetting factors". Global growth concerns have pressured the AUD against safe-haven and cyclical peers, while simultaneous outflows from US assets have weakened the US Dollar.
Hunter cautioned that it's too soon to tell whether this trend will persist, but acknowledged that recent market behavior reflects shifting investor sentiment, particularly toward capital reallocation away from US assets. As a result, Australian Dollar’s relative resilience against USD may be underpinned by portfolio rebalancing and perceived relative economic stability.
Hunter noted that the trade-weighted index has reverted to "pre-shock values", suggesting minimal net change in the foreign-currency value of Australian exports. However, the "relative move of capital" into Australia, at a time when the US is facing policy and tariff-related volatility, could offer some support to "domestic investment activity", providing a cushion to the broader economy amid global uncertainties.
RBA Minutes: 25bps cut chosen for caution and predictability after debating hold and 50bps options
RBA’s May 20 meeting minutes revealed that policymakers weighed three policy options—holding rates, a 25bps cut, or a larger 50bps reduction—before ultimately opting for a modest 25bps cut to 3.85%.
The case for easing hinged on three key factors: sustained progress in bringing inflation back toward target without upside surprises, weakening global conditions and household consumption, and the view that a cut would be the “path of least regret” given the risk distribution.
While members discussed a 50bps reduction after deciding to ease, they found the case for a larger move unconvincing. Australian data at the time showed little evidence that trade-related global uncertainty was materially harming domestic activity. Furthermore, some scenarios might even result in upward pressure on inflation, prompting caution. The Board also assessed that it was "not yet time to move monetary policy to an expansionary stance".
Ultimately, the Board judged that to move "cautiously and predictably" was more appropriate.
Caixin PMI manufacturing drops to 48.3, as China faces marked weakening at start of Q2
China's manufacturing sector unexpectedly shrank in May, with Caixin PMI falling to 48.3 from 50.4, well below market expectations of 50.6. This marked the first contraction in eight months and the lowest reading since September 2022.
According to Caixin Insight’s Wang Zhe, both supply and demand weakened, with a particularly notable drag from overseas demand. Employment continued to contract, pricing pressures remained subdued, and logistics saw moderate delays. Although business optimism saw a marginal recovery, the broader picture points to intensifying headwinds.
The report highlights the fragile start to Q2, with Wang pointing to a "marked weakening" in key economic indicators and a "significantly intensified" level of downward pressure.
EUR/USD Mid-Day Outlook
Daily Pivots: (S1) 1.1377; (P) 1.1413; (R1) 1.1480; More...
Intraday bias in EUR/USD is turned neutral with current retreat. Rebound from 1.1064 could extend higher, but strong resistance should be seen from 1.1572 to limit upside, at least on first attempt. On the downside, break of 1.1209 support will indicate that the corrective pattern from 1.1572 has started the third leg, and target 1.1064 support.
In the bigger picture, rise from 0.9534 long term bottom could be correcting the multi-decade downtrend or the start of a long term up trend. In either case, further rise should be seen to 100% projection of 0.9534 to 1.1274 from 1.0176 at 1.1916. This will now remain the favored case as long as 55 W EMA (now at 1.0856) holds.
BoE’s Bailey: Rate path still downward, but clouded by unpredictability
BoE Governor Andrew Bailey told the Treasury Committee today that while the direction for interest rates remains downward, the outlook has become increasingly uncertain.
Declining to pre-commit to a vote at the upcoming June meeting, Bailey said, “the path remains downwards, but how far and how quickly is now shrouded in a lot more uncertainty.”
He emphasized the role of external forces, noting that the Bank has revised its language to reflect the “unpredictable” nature of the current global environment.
His comments were echoed by fellow policymakers Catherine Mann and Sarah Breeden, who both acknowledged that rates are likely headed lower but stressed the difficulty in forecasting the exact pace or scale of future cuts.
Mann warned against assuming a fixed glide path, while Breeden said “there is uncertainty about how far, how fast.”