Sample Category Title
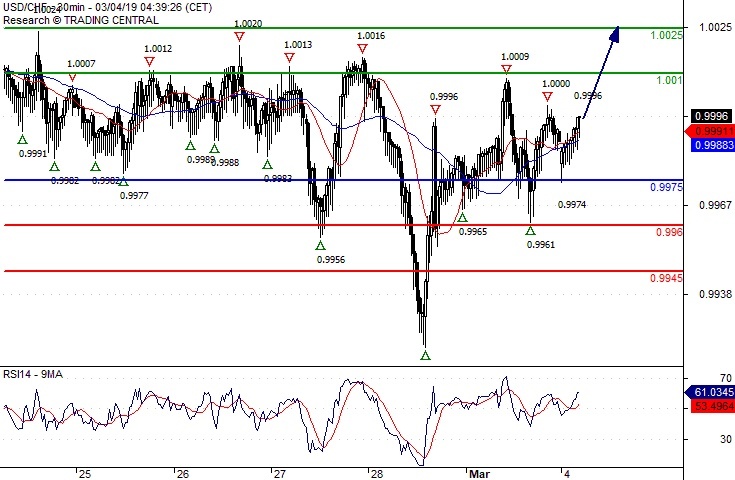
USD/CHF Range
Pivot (invalidation): 0.9975
Our preference Long positions above 0.9975 with targets at 1.0010 & 1.0025 in extension.
Alternative scenario Below 0.9975 look for further downside with 0.9960 & 0.9945 as targets.
Comment The RSI calls for a bounce.
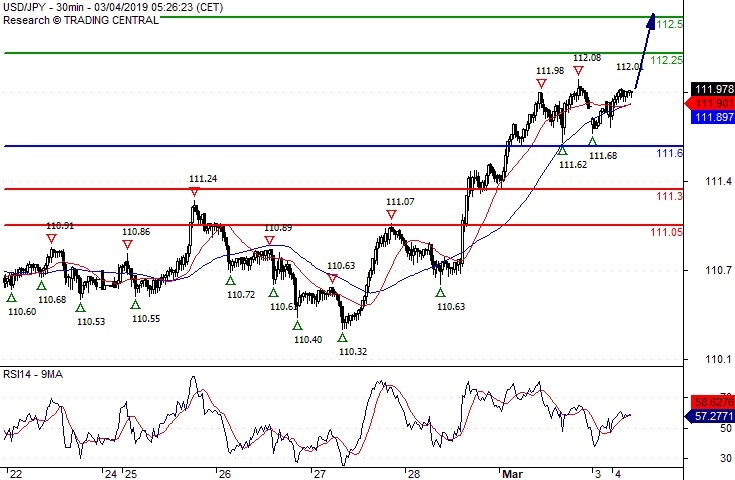
USD/JPY Further Upside
Pivot (invalidation): 111.60
Our preference Long positions above 111.60 with targets at 112.25 & 112.50 in extension.
Alternative scenario Below 111.60 look for further downside with 111.30 & 111.05 as targets.
Comment The RSI calls for a new upleg.
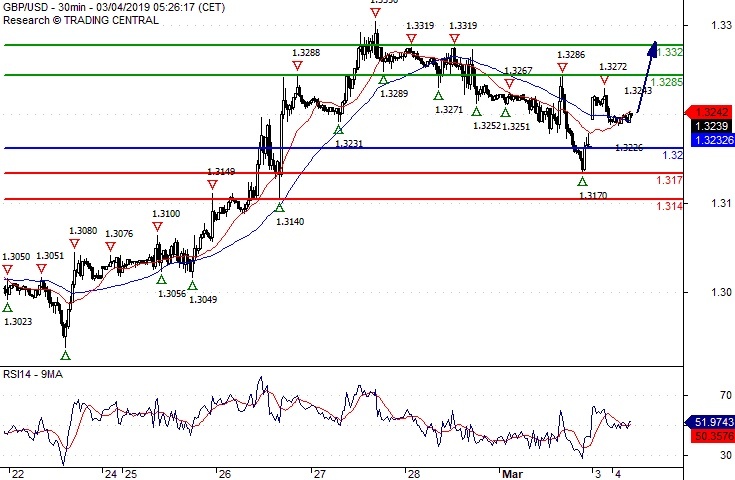
GBP/USD The Upside Prevails
Pivot (invalidation): 1.3200
Our preference Long positions above 1.3200 with targets at 1.3285 & 1.3320 in extension.
Alternative scenario Below 1.3200 look for further downside with 1.3170 & 1.3140 as targets.
Comment The RSI advocates for further upside.
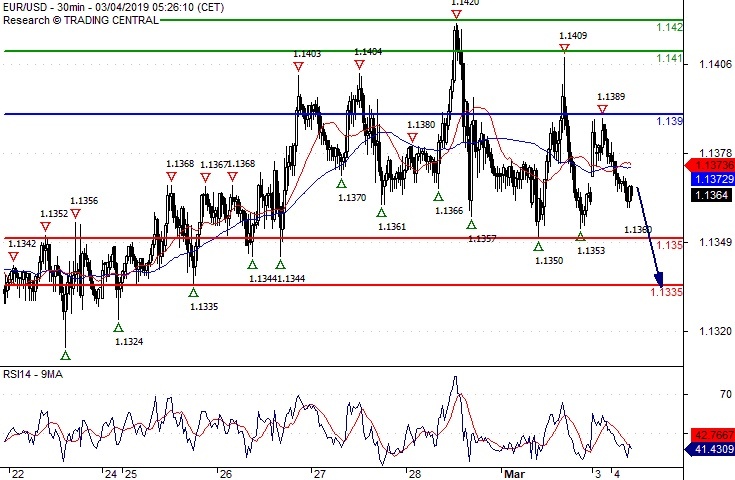
EUR/USD 1.1335 Expected
Pivot (invalidation): 1.1390
Our preference Short positions below 1.1390 with targets at 1.1350 & 1.1335 in extension.
Alternative scenario Above 1.1390 look for further upside with 1.1410 & 1.1420 as targets.
Comment A break below 1.1350 would trigger a drop towards 1.1335.
EURUSD 1.1380 Key Pivot
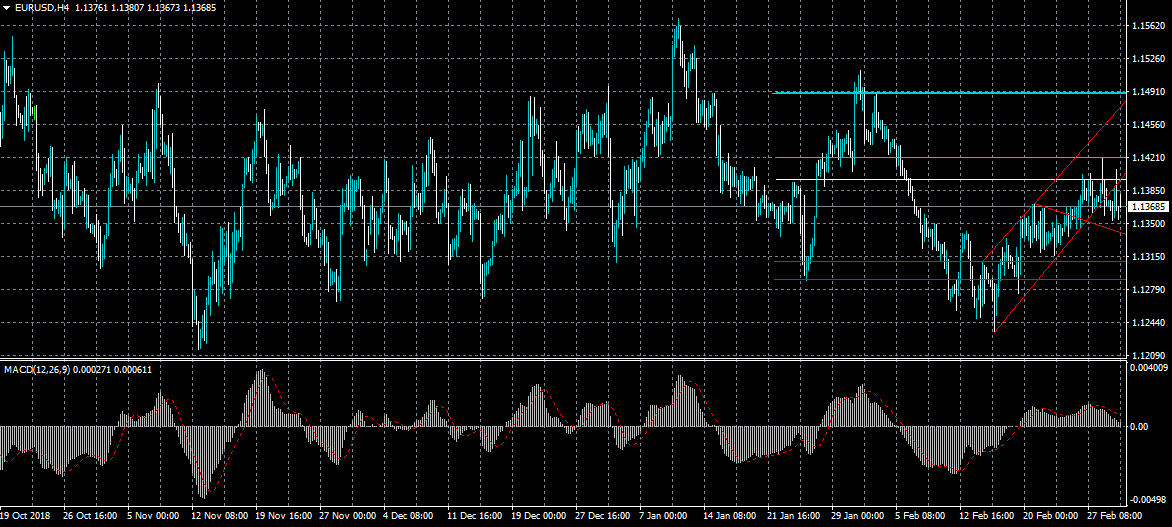
The euro is under slight downside pressure against the US dollar currency on Monday, with the pair trading towards the lower end of its seven-day trading range. The EURUSD pair is expected to drift lower while trading below the pivotal 1.1380 level, with key support below at 1.1337. The MACD indicator on the four-hour time frame is also showing further intraday losses appear likely.
The EURUSD pair is intraday bearish while trading below the 1.1380 level, key support is found at the 1.1337 and 1.1300 levels.
If the EURUSD pair trades above the 1.1380 level, key technical resistance is found at the 1.1400 and 1.1420 levels.
GBPUSD Only Bullish Above 1.3230
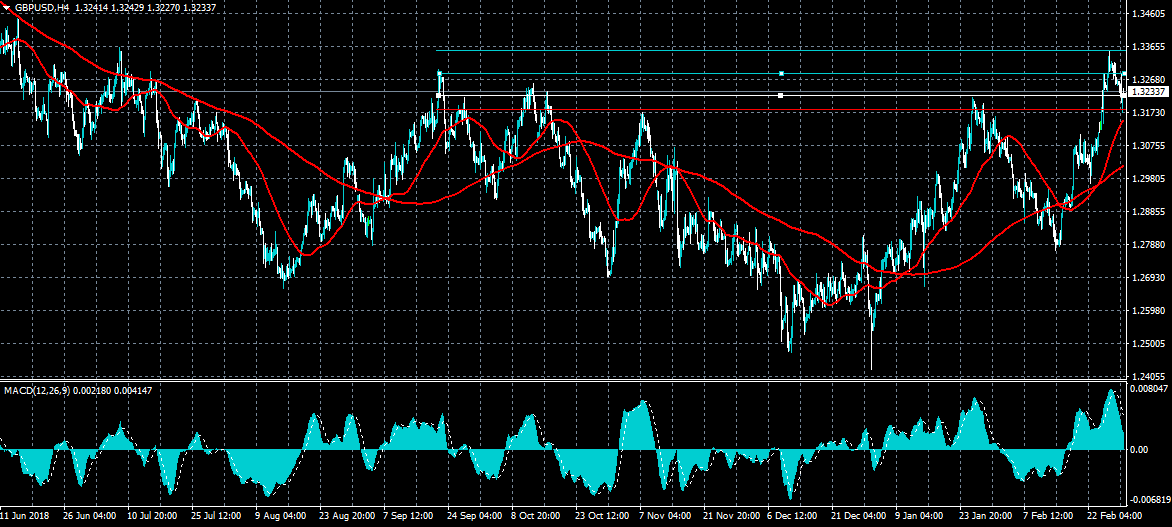
The British pound has recovered back towards the pivotal 1.3230 level against the greenback in early Monday trade, after briefly falling below the 1.3200 support level. The GBPUSD pair retains a bullish short-term bias while clearly trading above the 1.3230 level. Traders now await key Construction PMI data from the UK economy and the start of fresh Brexit negotiations between EU and UK officials.
The GBPUSD pair retains an intraday bullish bias while trading above the 1.3230 level, key technical resistance is found at the 1.3300 and 1.3350 levels
If the GBPUSD pair trades below the 1.3230 level, sellers may test towards the 1.3180 and 1.3155 support levels.
ETHUSD Heavily Bearish Below $115.00
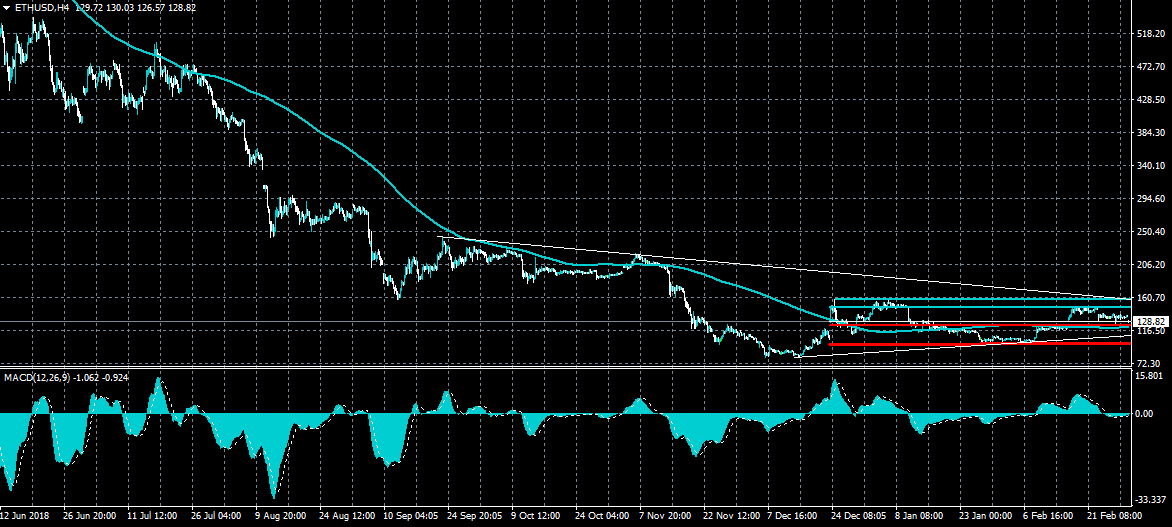
Ethereum has started the new trading week under downside pressure, with the second largest cryptocurrency trading below the $130.00 level. If the ETHUSD pair continues to hold below this level, sellers may test towards key trendline support, at $115.00. The ETHUSD pair is trading within a large symmetrical triangle pattern, with a break below the $115.00 level triggering a bearish downside breakout from the pattern.
The ETHUSD pair is bearish while trading below the $130.00 level, key support is found at the $115.00 and $100.00 levels.
If the ETHUSD pair trades above the $130.00 level, key resistance is found at the $145.00 and $160.00 levels.
Markets Rise As Reports Of A US-China Trade Deal Emerge
The price of crude oil continued the upward climb as a deal between China and the United States appeared close. On Friday, a report by Bloomberg said that the two countries were preparing the wording of a final report, which could be signed within weeks. A report by WSJ said that a deal was not far on the horizon, with China offering more US purchases with the goal of reducing deficit and the US offering to get rid of tariffs on Chinese goods.
Investors believe that a trade deal would help increase the demand for crude oil. However, both articles warn that Trump could change his mind at any time. In addition, production in the US appeared to be weakening. Last week, the API and EIA inventory data showed increased drawdowns. On Friday, data from Baker Hughes showed that oil rigs had declined from 853 to 843.
The AUD/USD pair rose sharply at the market’s open and then pared those gains. This was primarily because of the optimism in the US-China trade deal. Australia, being close to China in the Pacific, is one of the countries with the most exposure to China. For example, most of its iron ore is shipped to China. Therefore, if the Chinese economy sinks, Australia is usually very exposed. Earlier today, Australia released mixed economic data. The building approvals rose by 2.5% in January while the business inventories and gross operating profits of -0.2% and 0.8% missed the consensus estimates.
Sterling rose in overnight trading as the clock continues to tick towards March 29, when the United Kingdom is expected to leave the European Union. Investors are hoping that a no-deal Brexit scenario will be averted. The key scenario to watch will be an extension on Brexit by Theresa May. In a speech last week, the premier said that she will likely ask for a brief extension if her bill fails. However, the concern is that such a move will lead to more uncertainty. Today, the country will release data on housing PMIs, which is expected to show softening on the housing sector.
EUR/USD
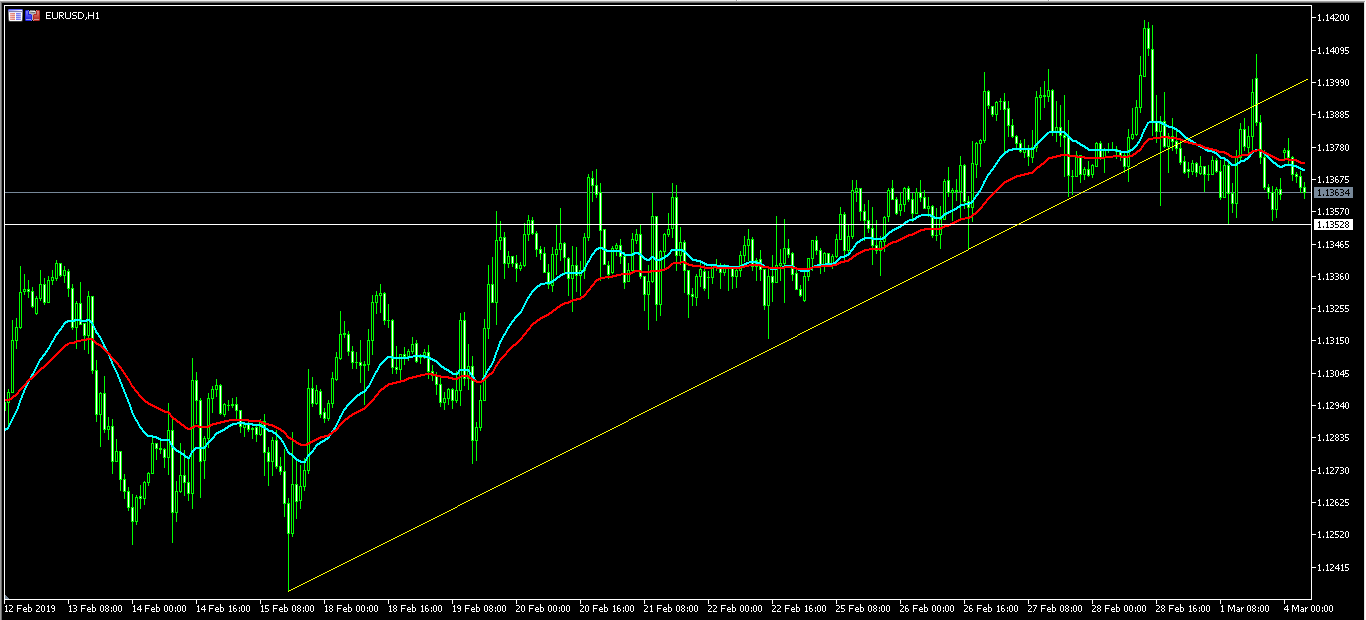
After rising initially, the EUR/USD pair pared some of those gains in early trading. The pair had reached a high of 1.1380 and then moved lower to the 1.1360 level. On the hourly chart, the pair is below the yellow diagonal support level shown and slightly above the white support level. The current price is slightly below the 21-day and 42-day EMAs. Today, the pair will likely remain in this consolidation level as traders wait for more details on trade.
AUD/USD
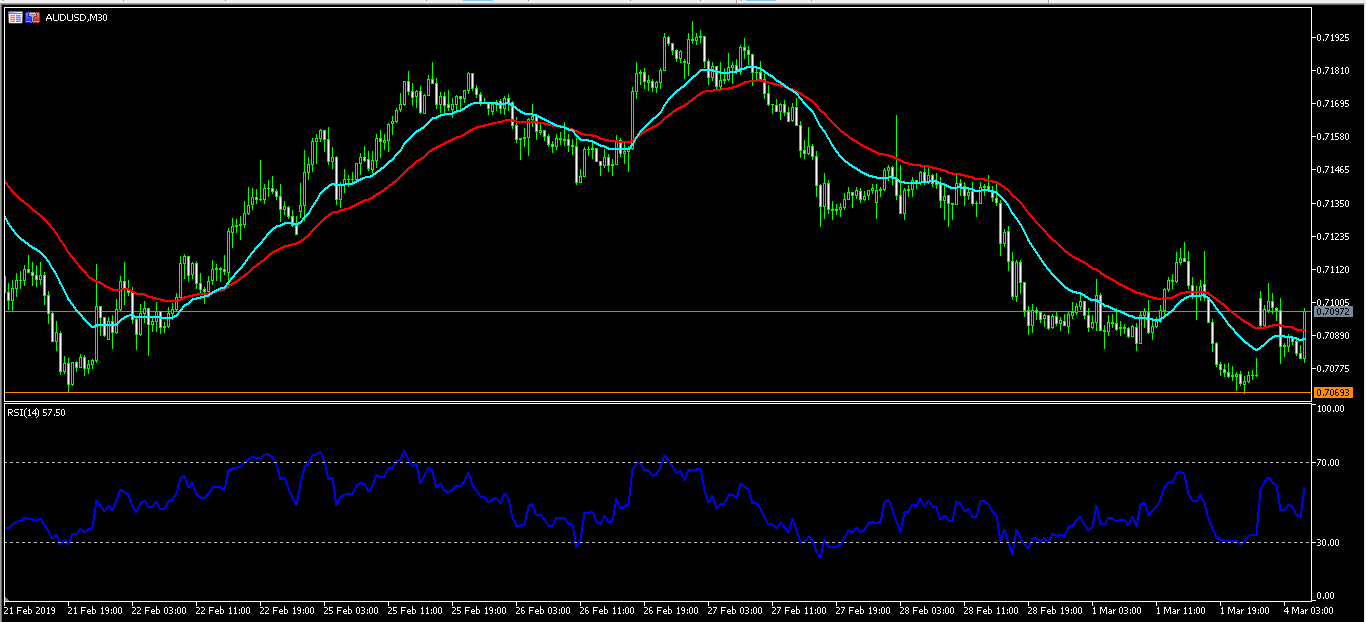
On Friday, the AUD/USD pair reached the important support of 0.7070. The pair then started moving up, and today, it reached a high of 0.7105 and then started moving downwards. The current price is along the 21-day and 42-day EMAs while the RSI has remained along the 50s level. The pair could continue moving up, especially if there is an indication that a trade deal will be signed.
XBR/USD
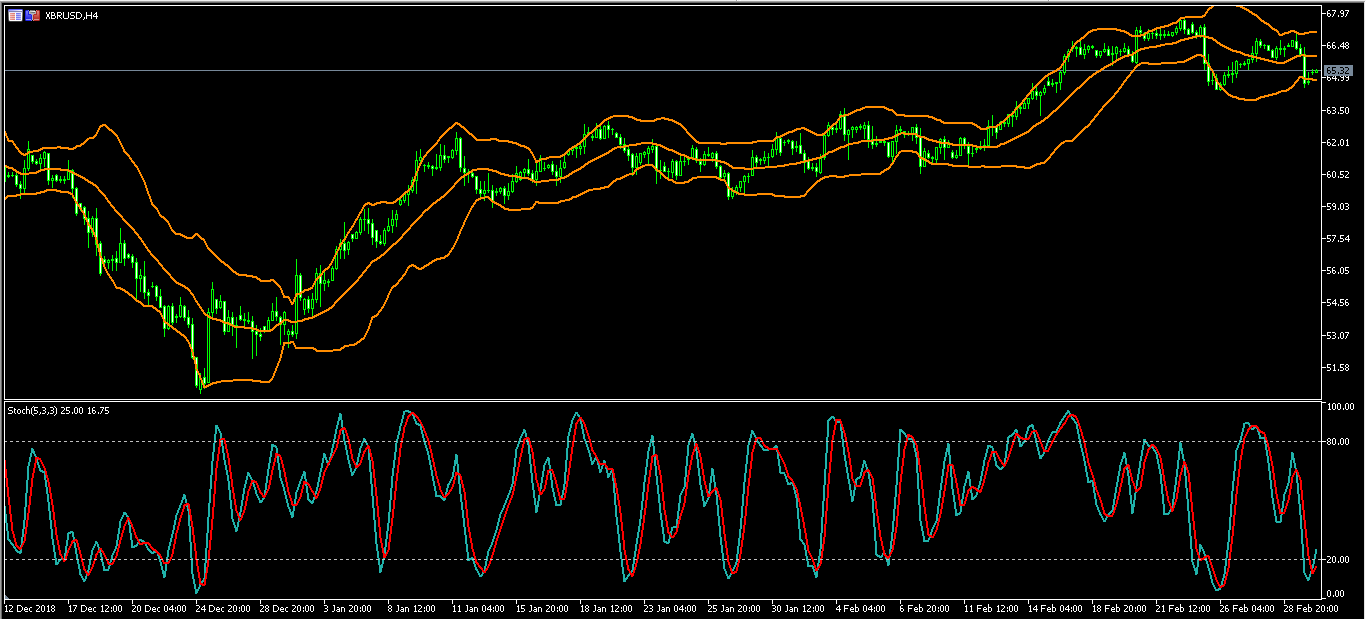
Last week, the price of crude oil fell sharply after Trump asked OPEC to intervene. After that, the price started to increase and by Friday, it had pared the previous losses. On Friday, the price declined sharply as traders took profits. Today, the price has moved higher as signs of a trade deal emerge and as US production reduces. The XBR/USD pair is currently at 65.30, which is higher than the low of 64.47. This price is slightly above the lower band of the Bollinger Bands while the signal line of the stochastics indicator is moving up. The pair will likely continue with the upward trend.
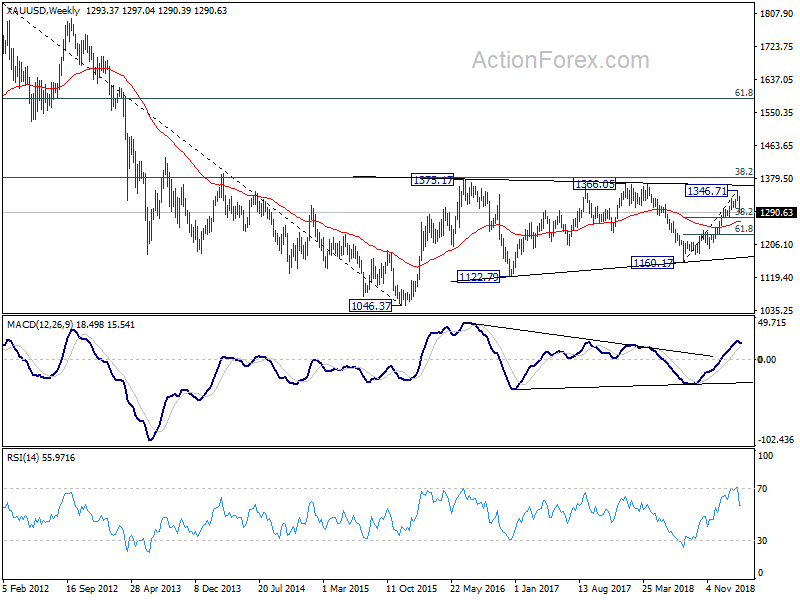
Gold topped at 1346, focus on 1276 to confirm bearish reversal
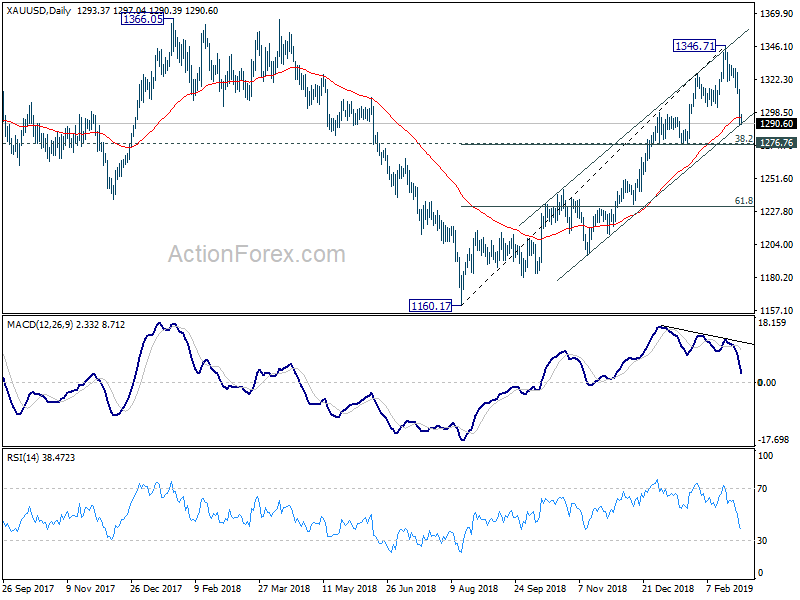
Gold's sharp decline last Friday confirmed short term topping at 1346.71 on bearish divergence condition in daily MACD. That came ahead of 1366.05/1375.17 resistance zone. Focus now turns back to 1276.76 cluster support (38.1% retracement of 1160.17 to 1346.17 at 1275.45). Decisive break there should confirm completion of whole rise from 1160.17. In that case, gold should have started another falling leg inside the long term range pattern. Deeper fall should then be seen back towards 1160.17 support. In case of another rise, we won't expect firm break of f key fibonacci level of 38.2% retracement of 192.070 to 1046.37 at 1380.36.
Gold Declines Near 1-Month Low, Loses Momentum In Near Term
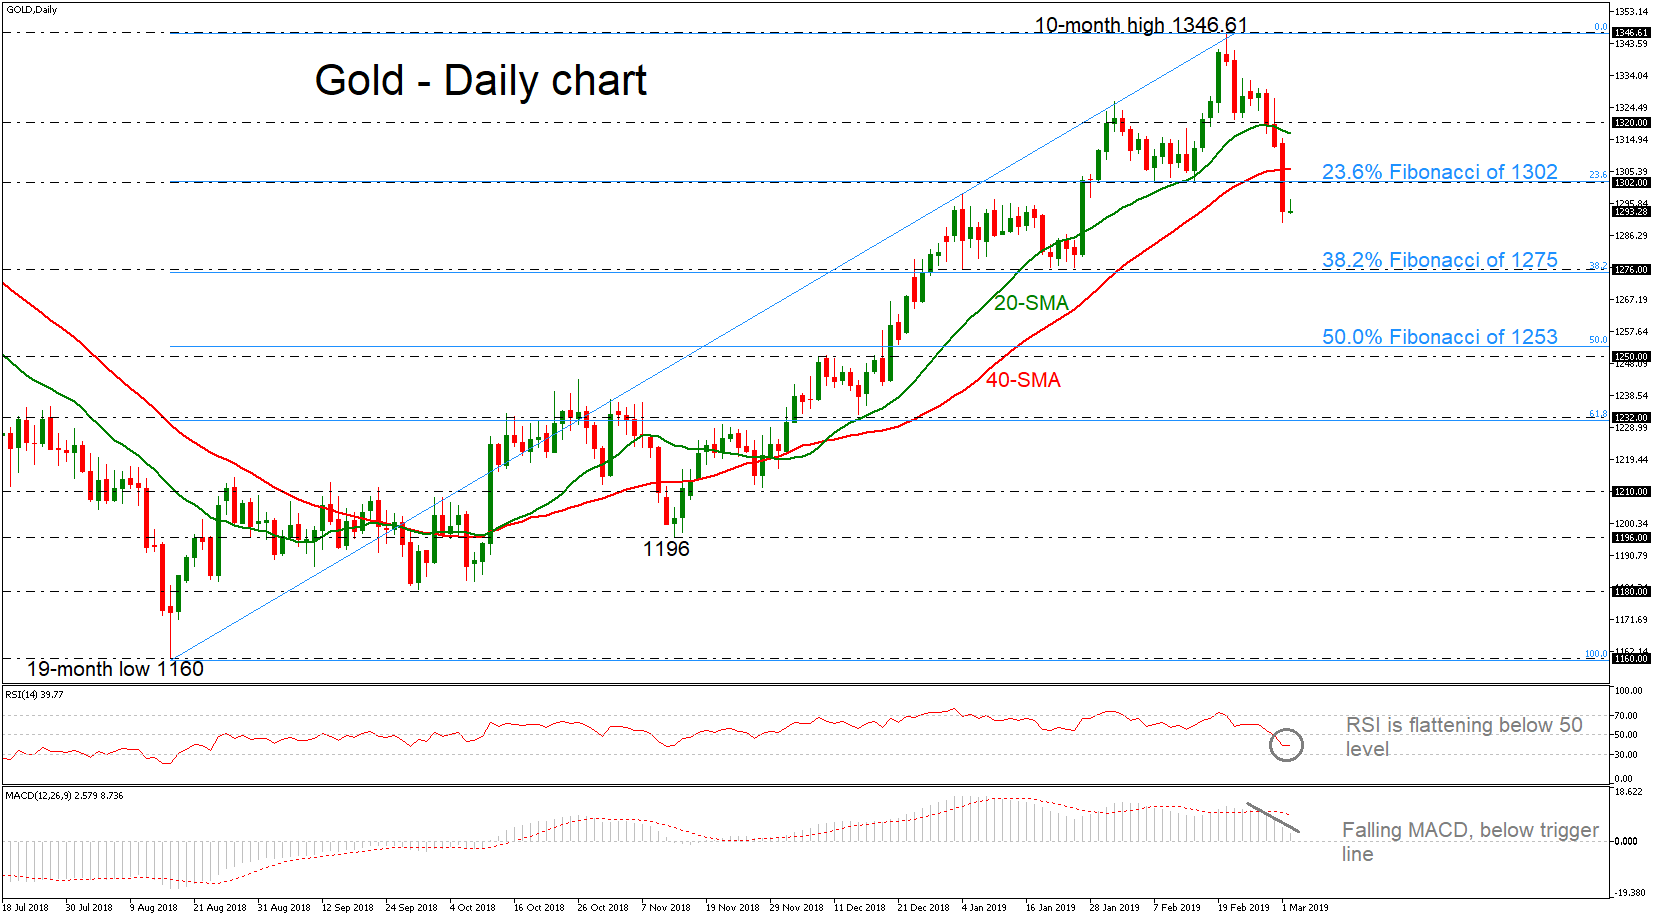
Gold had been trading sharply lower over the last three consecutive days, dropping towards a fresh one-month low near 1290 on Friday. The bounce off the ten-month high of 1346.61 drove the market back to the downside, below the 20- and 40-simple moving averages (SMAs), which are both now suggesting a possible bearish retracement in the short-term.
Looking at momentum indicators, the RSI is lacking direction slightly below its neutral threshold of 50, suggesting that the market could keep losing momentum in the near term. The MACD also supports this view in the positive territory, falling below the trigger line.
If the price continues the downfall, support would initially come from the 38.2% Fibonacci retracement level of the upleg from 1160 to 1346.61, around the 1276 barrier. Slipping below this area, the yellow metal could hit the 1250 – 1253 region, which encapsulates the 50.0% Fibonacci mark, shifting the bias to a more neutral picture.
On the other hand, immediate resistance would likely come from the 23.6% Fibonacci of 1302. If there is a successful break above this zone, further resistance could be met around the 40- and then the 20-SMAs currently at 1306 and 1316 respectively. Higher up, the inside swing of February 21 at 1320 could be the next target to look for. Furthermore, if the metal surpasses these obstacles, it could re-challenge the ten-month high.
In the more medium-term picture, the price is still endorsing the bullish view following the upward reversal at the 19-month low of 1160. Only a fall below the 61.8% Fibonacci of 1232 could change this outlook