Sample Category Title
Canada’s Annualised Gross Domestic Product Advanced In 4Q 2018
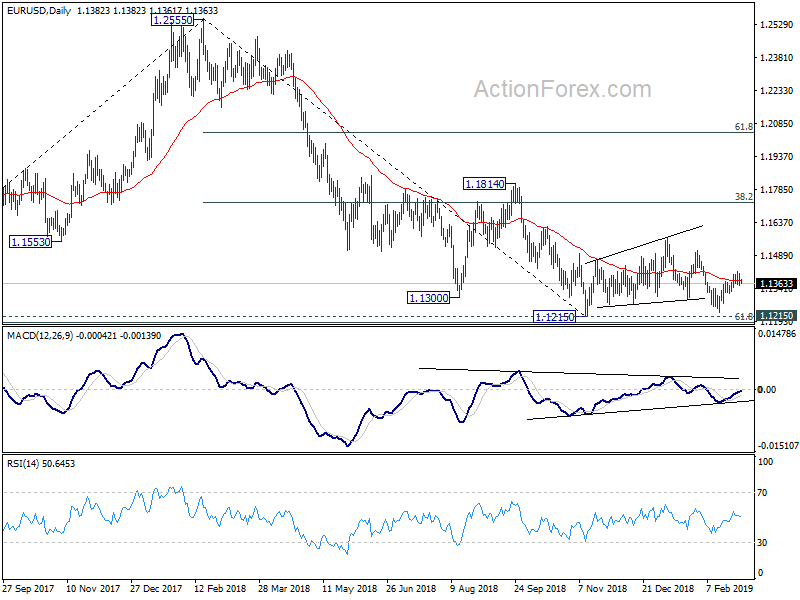
For the 24 hours to 23:00 GMT, the USD rose 1.02% against the CAD and closed at 1.3302 on Friday.
On the macro front, data revealed that Canada's annualised gross domestic product (GDP) advanced 0.4% on a quarterly basis in 4Q 2018, undershooting market expectations for a rise of 1.0%. In the previous quarter, annualised GDP had recorded an increase of 2.0%.
On the contrary, the nation's RBC manufacturing PMI declined to a level of 52.6 in February, following a level of 53.0 in the preceding month.
In the Asian session, at GMT0400, the pair is trading at 1.3284, with the USD trading 0.14% lower against the CAD from Friday's close.
The pair is expected to find support at 1.3174, and a fall through could take it to the next support level of 1.3064. The pair is expected to find its first resistance at 1.3350, and a rise through could take it to the next resistance level of 1.3416.
Amid no major economic releases in Canada today, investors would focus on global macroeconomic factors for further direction.
The currency pair is trading above its 20 Hr and 50 Hr moving averages.
Aussie Reverses Its Losses In The Asian Session
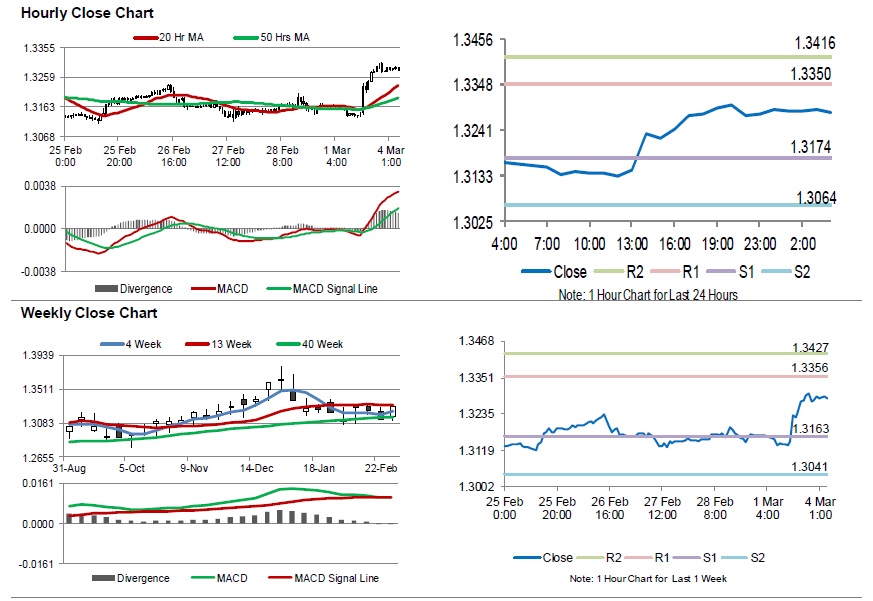
For the 24 hours to 23:00 GMT, the AUD declined 0.37% against the USD and closed at 0.7073 on Friday.
LME Copper prices rose 0.6% or $36.0/MT to $6572.0/MT. Aluminium prices declined 0.1% or $2.5/MT to $1890.5/MT.
In the Asian session, at GMT0400, the pair is trading at 0.7099, with the AUD trading 0.37% higher against the USD from Friday’s close.
Overnight data indicated that Australia’s seasonally adjusted building approvals rebounded 2.5% on a monthly basis in January, following a drop of 8.4% in the prior month.
The pair is expected to find support at 0.7072, and a fall through could take it to the next support level of 0.7045. The pair is expected to find its first resistance at 0.7124, and a rise through could take it to the next resistance level of 0.7149.
Going forward, investors would keep an eye on the Reserve Bank of Australia’s interest rate decision, set to release early morning tomorrow.
The currency pair is showing convergence with its 20 Hr moving average and trading below its 50 Hr moving average.
Gold: Yellow Metal Trading Higher In The Asian Session
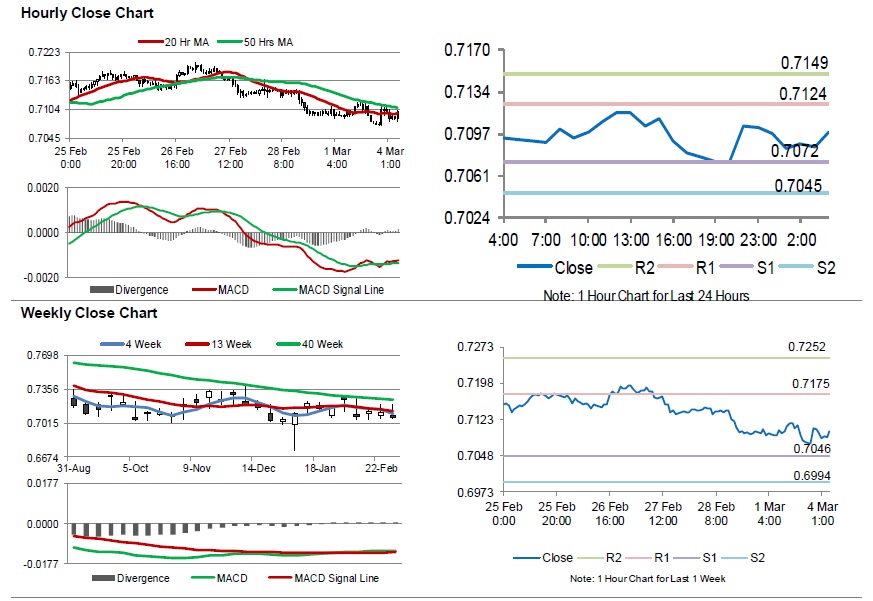
For the 24 hours to 23:00 GMT, Gold declined 1.47% against the USD and closed at USD1296.30 per ounce on Friday, amid broad strength in the US dollar.
In the Asian session, at GMT0400, the pair is trading at 1297.70, with gold trading 0.11% higher against the USD from Friday’s close.
The pair is expected to find support at 1287.67, and a fall through could take it to the next support level of 1277.63. The pair is expected to find its first resistance at 1311.37, and a rise through could take it to the next resistance level of 1325.03.
The yellow metal is trading below its 20 Hr and 50 Hr moving averages .
EUR/AUD Daily Outlook
Daily Pivots: (S1) 1.5924; (P) 1.5985; (R1) 1.6092; More....
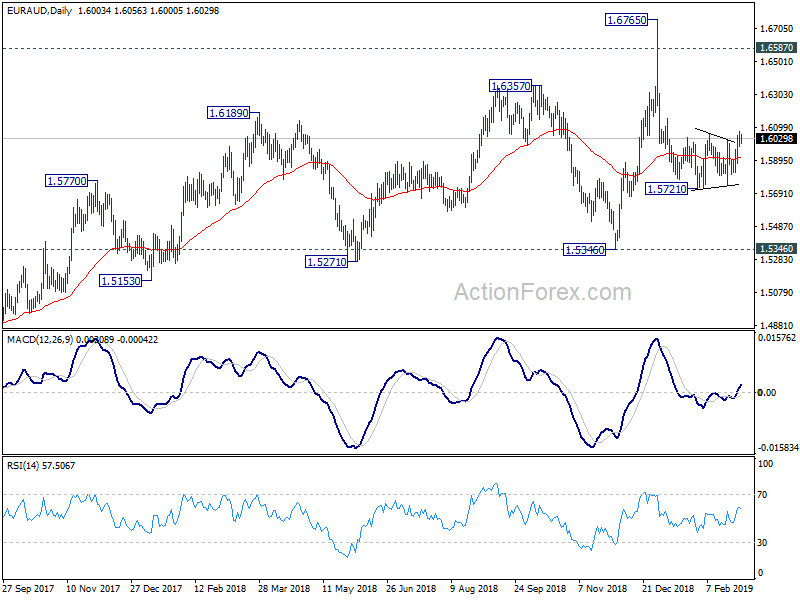
With 1.5983 minor support intact, further rise is expected in EUR/AUD. Sustained trading above 1.6060 resistance will confirm completion of decline from 1.6765. Further rally should then be seen to retest 1.6765 high. On the downside, though, below 1.5983 minor support will dampen this bullish case and turn bias neutral again.
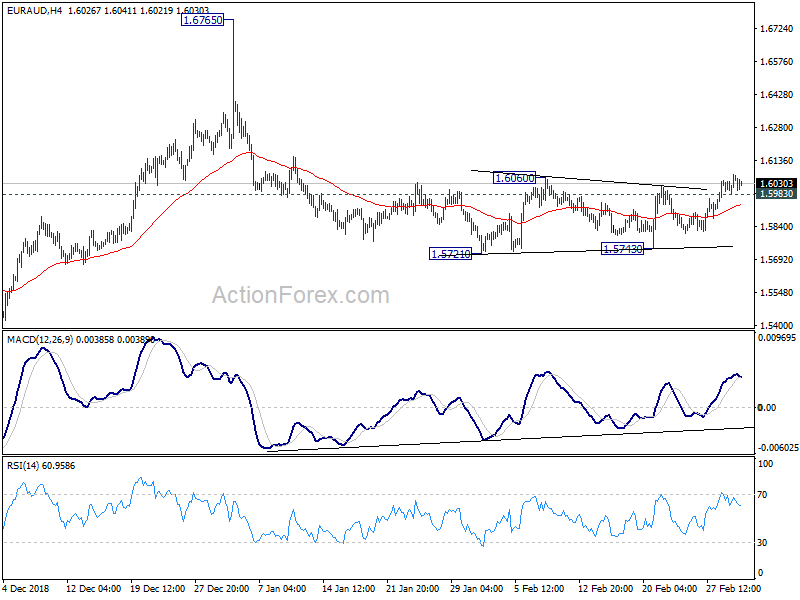
In the bigger picture, as long as 1.5346 support holds, outlook will remain bullish. Uptrend from 1.1602 (2012 low) is expected to resume sooner or later. Break of 1.6765 will target 61.8% retracement of 2.1127 (2008 high) to 1.1602 at 1.7488 next. However, firm break of 1.5346 key support will indicate trend reversal, with bearish divergence condition in weekly MACD, and turn outlook bearish.
Silver: White Metal Trading On A Stronger Footing In The Morning Session
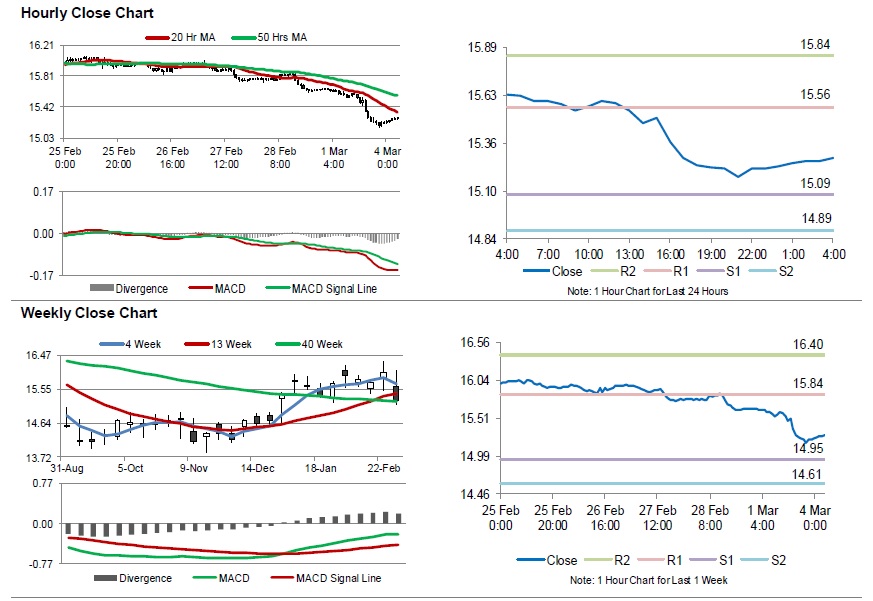
For the 24 hours to 23:00 GMT, Silver declined 2.72% against the USD and closed at USD15.23 per ounce on Friday, tracking losses in gold prices.
In the Asian session, at GMT0400, the pair is trading at 15.29, with silver trading 0.39% higher against the USD from Friday’s close.
The pair is expected to find support at 15.09, and a fall through could take it to the next support level of 14.893. The pair is expected to find its first resistance at 15.56, and a rise through could take it to the next resistance level of 15.84.
The white metal is trading below its 20 Hr and 50 Hr moving averages.
Crude Oil: Oil Reverses Its Losses In The Asia Session
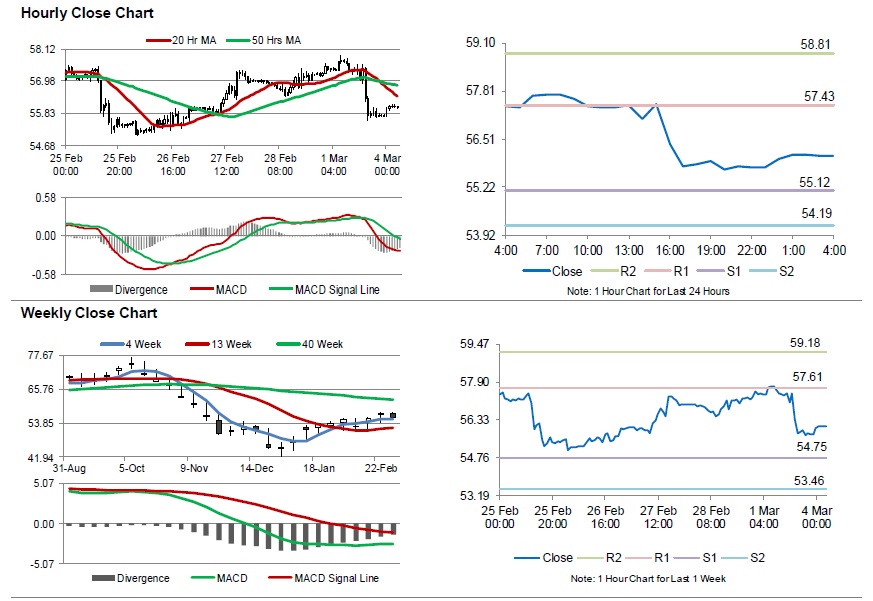
For the 24 hours to 23:00 GMT, Crude Oil declined 2.59% against the USD and closed at USD55.69 per barrel on Friday, amid concerns over the demand for the commodity.
Meanwhile, fresh figures from Baker Hughes disclosed that the number of active oil rigs declined by 10 to 843 in the week ended 01 March 2019.
In the Asian session, at GMT0400, the pair is trading at 56.05, with oil trading 0.65% higher against the USD from Friday’s close.
The pair is expected to find support at 55.12, and a fall through could take it to the next support level of 54.19. The pair is expected to find its first resistance at 57.43, and a rise through could take it to the next resistance level of 58.81.
Crude oil is trading below its 20 Hr and 50 Hr moving averages.
EUR/CHF Daily Outlook
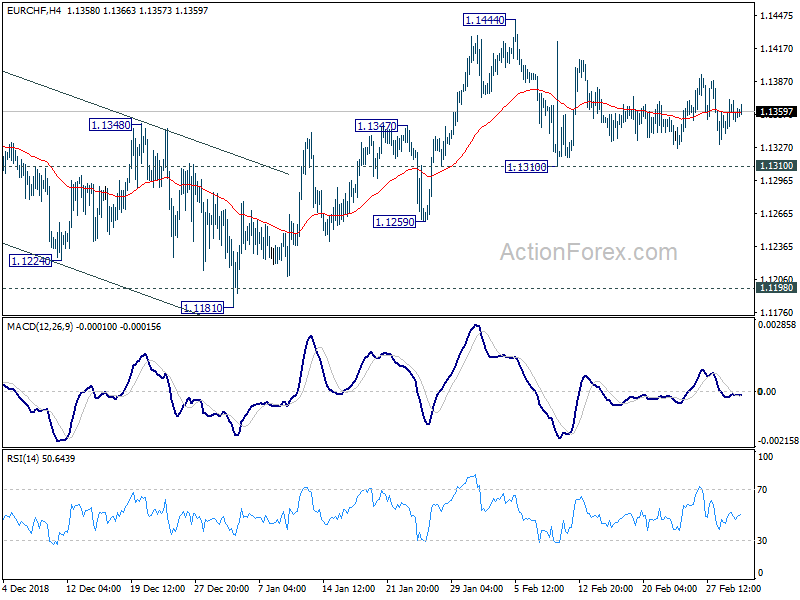
Daily Pivots: (S1) 1.1339; (P) 1.1355; (R1) 1.1370; More...
EUR/CHF is staying in range of 1.1310/1444 and intraday bias remains neutral. Further rise is in favor as long as 1.1310 support holds. On the upside, break of 1.1444 will resume the rebound from 1.1181 and target 1.1501 key resistance next. On the downside, firm break of 1.1310 will indicate completion of the rebound. In that case, intraday bias will be turned back to the downside for 1.1181 low again.
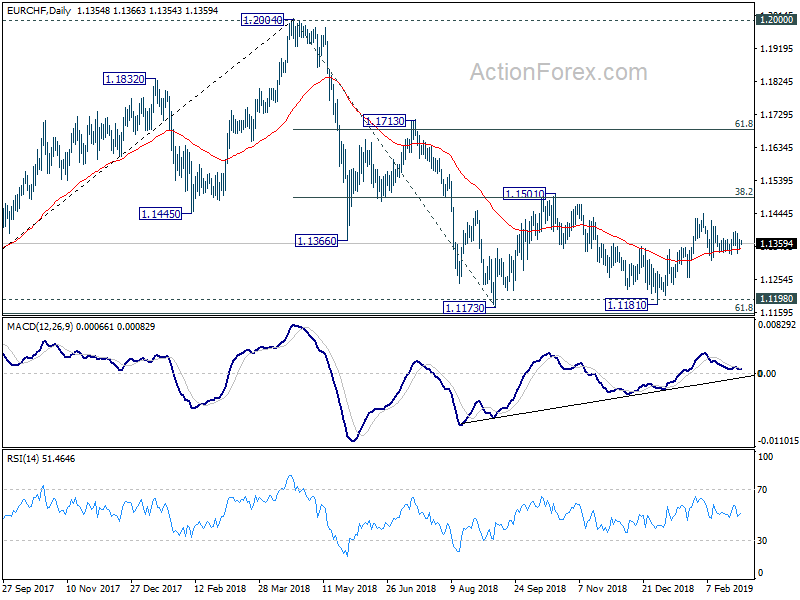
In the bigger picture, price actions from 1.2004 medium term top is seen as a correction only. Downside should be contained by 1.1154/98 support zone to complete it and bring rebound. Decisive break of 1.1501 (38.2% retracement of 1.2004 to 1.1173 at 1.1490) will confirm completion of the correction. Further rise should be seen to 61.8% retracement at 1.1687 and above next.
Australian Dwelling Approvals Post Slight Gain
Jan +2.5%mth, –28.6%yr (vs mkt +1.5%). Despite gain, the unwinding high rise boom continues to dominate with detail mostly weak.
Dwelling approvals posted a better than expected 2.5% lift in Jan, paring back some of the weakness seen in previous months – approvals slid over 25% through the last three months of 2018. The consensus forecast had been looking for a 1.5% gain.
As a rule, January housing data should be taken with a large grain of salt – the low flows through the holiday period mean any month to month noise is amplified by seasonal adjustment.
The detail was mixed. On the positive side, the weakness in non high rise approvals, which was one of the more striking features of the deterioration between Oct and Dec, showed a decent reversal. Detached house approvals in particular posted a solid 2.1% gain, reversing all of last month's 1.7% decline (but still down 2.6% on a rolling 3mth average basis). That may be an indication that some of the earlier weakness may have related to longer delays in obtaining finance.
Around units, the detail suggests another sizeable fall for 'high rise' was more than offset by a gain in medium density units (which are now above high rise in level terms). We estimate high rise approvals declined a further 10-15% in seasonally adjusted terms in the month, down 35% on a rolling 3mth average basis. The steep drop in high rise activity continues to outpace our assumed path of a cumulative 40% decline by the end of 2019. In contrast, 'low rise' unit approvals look to be up an estimated 10-15% in the month on a seasonally adjusted basis, though still moving lower on a 3mth average basis (–9%). Strikingly, 'low rise' approvals now slightly outnumber 'high rise' approvals – a year ago, the number of high rise was about double the number of low rise.
The state breakdown shows the Jan gain was confined to NSW (+12%mth, –24%yr) and WA (+29%mth, –9%yr), with a lift in the lumpy high rise segment contributing in both cases. Other states recorded declines, Vic –7.9%mth, –36%yr; Qld –3.5%mth, –41%yr and SA –1.5%mth, –10%yr.
The total value of renovation approvals declined slightly in the month but is still up 2.1% on a rolling 3mth average basis 2.2%, down only marginally on a year ago (–4.2%yr).
The total value of non res building approvals rose 6.4%, retracing some of the 9.8% fall in Dec. Abstracting from monthly volatility there are some signs of firming after last year's pull back with the education sector leading gains.
Overall the Jan update pares back some of the concerning weakness that was emerging through the back end of 2018, particularly around non high rise activity. However, the through the year numbers are clearly still very weak and dwelling construction will continue to detract materially from growth in 2019.
Australian Business Indicators Survey Q4 2018
Soft tone points to sluggish conditions. Q4 company profits: 0.8%qtr, 10.5%yr. Q4 wage incomes: 0.8%qtr, 4.1%yr. Q4 inventories: -0.2%, 0.0ppt contr'n.
The Business Indicators survey provides an estimate of business inventories and partial information on incomes.
The tone of the December update was on the soft side, pointing to sluggish conditions late in 2018.
Inventories levels declined and profits rose, but only modestly so.
The income data broadly met our expectations while inventories provided a small downside surprise.
Our forecast for Q4 GDP remains 0.2%qtr, 2.4%yr. Recall that we downgraded our forecast last week in the wake of news that construction activity contracted sharply.
In the December quarter, company profits grew by only a modest 0.8%. That was below expectations but broadly as we anticipated (market median 3.0% and Westpac 1.0%).
Profits on an adjusted basis (to be more consistent with the national accounts measure) grew by 1.8% we estimate - matching our forecast.
The lift in company profits is centred on the mining sector which is benefitting from higher commodity prices.
Mining profits increased by 4.0% in the quarter, the fifth consecutive quarterly gain. Profits in the sector are 26% above a year ago and 125% higher than at the end of 2015, which was the low point for global commodity prices.
The picture around non-mining profits is very different, with profitability squeezed by rising costs and patchy demand. Non-mining profits were flat in Q4 and have been broadly unchanged since March 2018.
For wage incomes, conditions are challenging.
Nominal wage incomes (that is, wages and employment) grew by 0.8% in the quarter. This is broadly consistent with the more modest gains in hours worked, which rose by 0.4%qtr, 1.5%yr in Q4. This is less upbeat than numbers employed, which grew by 0.7%qtr, 2.3%yr in Q4.
Annual wage income growth is 4.1% currently, moderating from around 5% at the start of the year and below the long-run average of 5.4%.
With consumer inflation, the CPI, running at 1.8%, this implies real wage income growth of around 2.3% - a pace which points to the risk of lacklustre momentum in consumer spending.
Inventories broadly stalled over the second half of 2018, inching 0.1% lower in Q3 and edging down by 0.2% in Q4. That was a weaker than anticipated outcome (market median and Westpac 0.3%) and will see inventories have a neutral impact on activity in the quarter (vs a forecast +0.1ppt).
EUR/USD Daily Outlook
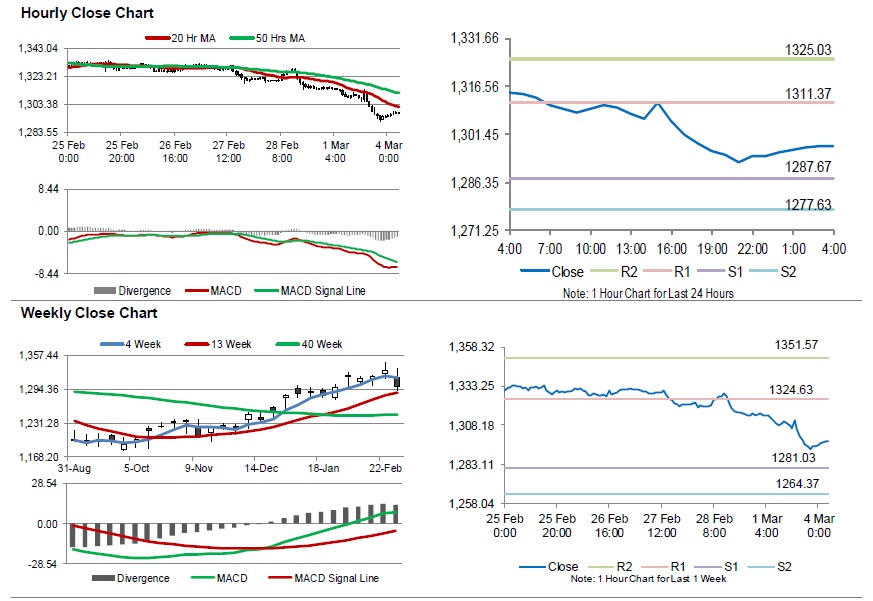
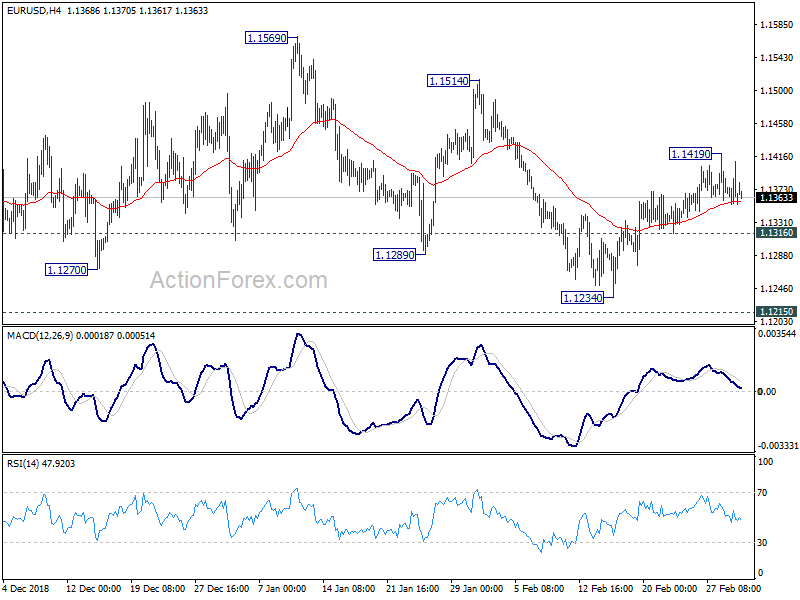
Daily Pivots: (S1) 1.1343; (P) 1.1375; (R1) 1.1398; More.....
Intraday bias in EUR/USD remains neutral at this point. Rise from 1.1234 is seen as a rising leg inside correction pattern from 1.1215 low. As long as 1.1316 minor support holds, another rise is mildly in favor. On the upside, above 1.1419 will target 1.1514 resistance next. On the downside, break of 1.1316 will turn bias back to the downside for 1.1215 low.
In the bigger picture, as long as 1.1814 resistance holds, down trend down trend from 1.2555 medium term top is still in progress and should target 61.8% retracement of 1.0339 (2017 low) to 1.2555 at 1.1186 next. Sustained break there will pave the way to retest 1.0339. However, break of 1.1814 will confirm completion of such down trend and turn medium term outlook bullish.