Sample Category Title
EUR/USD Could Rally If It Breaks 1.1420
Key Highlights
- The Euro recovered recently and traded above the 1.1325 resistance against the US Dollar.
- A crucial bearish trend line is formed with resistance near 1.1408 on the 4-hours chart of EUR/USD.
- The US ISM Manufacturing Index declined from 56.6 to 54.2 in Feb 2019.
- The Euro Zone PPI for Feb 2019 will be released today, which could increase 0.4% (MoM).
EURUSD Technical Analysis
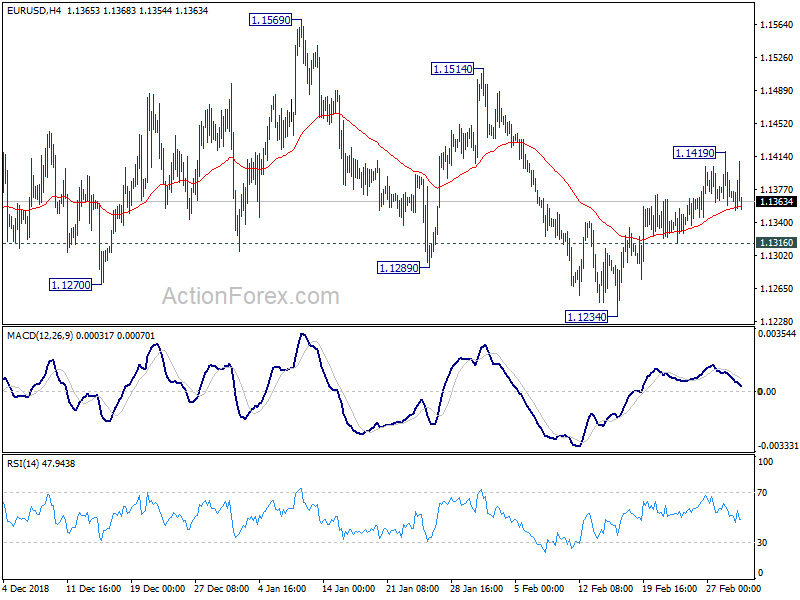
After trading as low as 1.1234, the Euro started a solid rebound against the US Dollar. The EUR/USD pair broke the 1.1280 and 1.1325 resistance levels to move into a short term bullish zone.
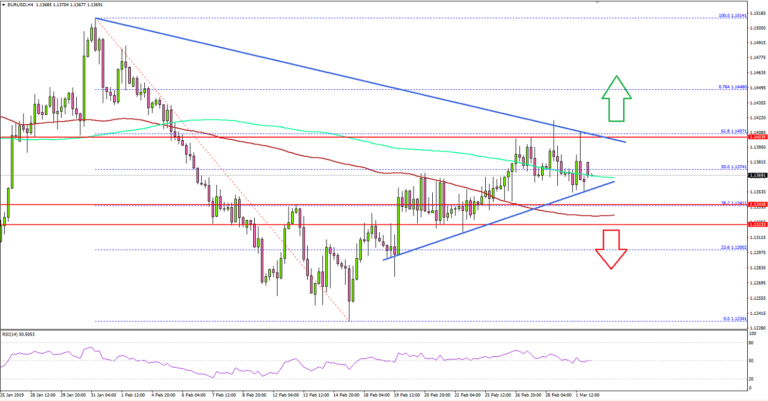
Looking at the 4-hours chart, the pair gained bullish momentum after it broke the 1.1325 resistance and the 100 (red) simple moving average (4-hours). There was also a break above the 50% Fib retracement level of the last decline from the 1.1514 high to 1.1234 low.
However, the upward move was capped by the key 1.1420 resistance area and the 61.8% Fib retracement level of the last decline from the 1.1514 high to 1.1234 low. Besides, there is crucial bearish trend line formed with resistance near 1.1408 on the same chart.
The pair made two attempts to clear the 1.1410-1.1420 resistance area, but it failed. It is currently consolidating below 1.1420, with support at 1.1340 and 1.1325. Should there be a downside break below 1.1325, the pair could start a fresh bearish wave.
On the other hand, a successful break above the 1.1420 resistance area may perhaps open the doors for a sustained upward move towards the 1.1450 and 1.1500 resistance levels.
Fundamentally, the US ISM Manufacturing Index for Feb 2018 was released this past Friday. The market was looking for a minor decline from the last reading of 56.6 to 55.5.
The result was lower than the forecast the US ISM Manufacturing Index declined from 56.6 to 54.2. Besides, the New Orders Index declined 2.7 percentage and registered 55.5 percent.
The report added that:
The Production Index registered 54.8 percent, 5.7-percentage point decrease compared to the January reading of 60.5 percent. The Employment Index registered 52.3 percent, a decrease of 3.2 percentage points from the January reading of 55.5 percent.
Overall, EUR/USD is facing a tough resistance at 1.1420 and it won't be easy for buyers to gain bullish momentum in the near term.
Economic Releases to Watch Today
- UK's Construction PMI for Feb 2019 – Forecast 50.2, versus 50.6 previous.
- Euro Zone PPI for Feb 2019 (YoY) – Forecast +3.4%, versus +3.0% previous.
- Euro Zone PPI for Feb 2019 (MoM) – Forecast +0.4%, versus -0.8% previous.
Daily Markets Broadcast
Wall Street futures firmer on hopes a trade deal in sight
Weekend speculation that a US-China trade deal may be close to materializing lifted US indices in early trading this morning. China holds its national Party Congress this week, which could be a good platform to announce a deal.
US30USD Daily Chart
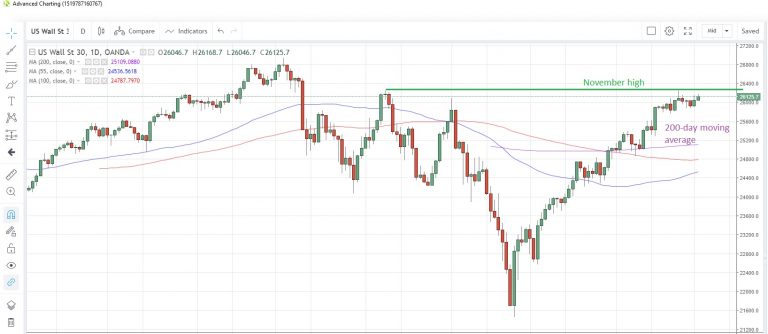
The US30 index rebounded on Friday, and has extended those gains in early trading this morning, on speculation US and China are near a deal to end most tariffs
Resistance at the November high of 26,249 remains intact. Support may be found at the 200-day moving average at 25,109
The Wall Street Journal reported that the US could lift most, or even all, of its tariffs on Chinese goods with a summit between US President Trump and Chinese leader Xi Jinping possibly happening later this month. There are no data releases of note today.
DE30EUR Daily Chart
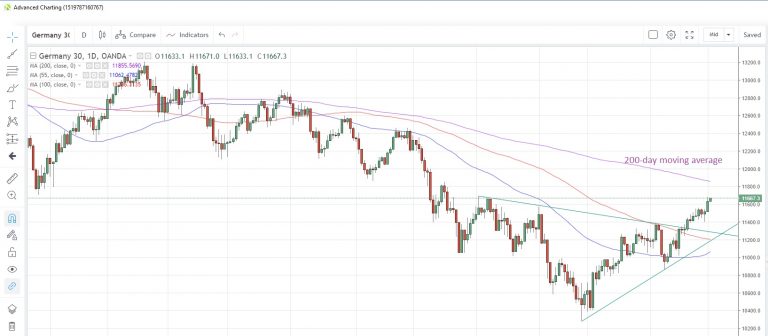
The Germany30 index touched a four-month high on Friday as economic data matched, or beat, expectations
The index may have eyes on the 200-day moving average, which is at 11,855 today
The Euro-zone final Markit manufacturing PMI reading for February came in at 49.3, better than estimates of 49.2, while the region's January unemployment rate was a below-forecast 7.8%, unchanged from December. There are no major economic data releases scheduled for today.
CN50USD Daily Chart
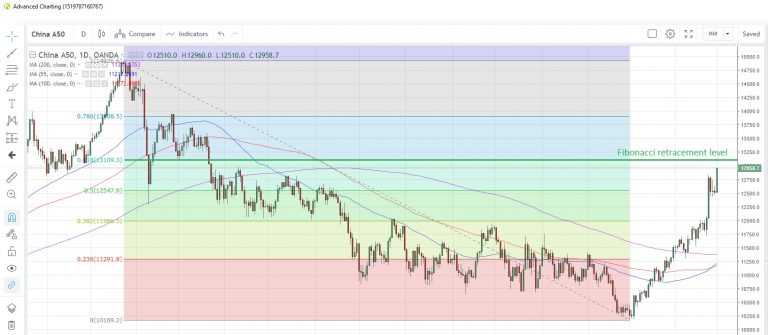
China shares surged to the highest since April 11 on Friday, and could extend those gains at the open today
The 61.8% Fibonacci retracement of the January 2018 to January 2019 drop is at 13,109 and could be tested today
China's National Party Congress is being held this week where policies will be decided for this year. A solution to the trade tariff standoff would be a welcome reprieve amid a slowing economy.
Trade Deals Dominate Early Asian Trading
Trade deals dominate early Asian trading
Earlier this morning, The Wall Street Journal (WSJ) reported the US and China are close to a final trade deal. The result has been predictable in early morning Asian markets as traders rub the sleep from their eyes. At the time of writing, S&P mini futures had raced 0.4% higher, Australia’s ASX 200 futures were up 0.25% and the Nikkei was also up in early trading. The currency markets have also responded to the lower US dollar. Both the Aussie dollar (AUD) and off-shore China yuan (CNH) are up 0.3% against the greenback already.
Regional stock markets, currencies as well as energy and commodities could also benefit from the tailwind today. On the other hand, precious metals could suffer following last Friday’s fall, as buoyant stock markets and reducing risk premiums erode safe-haven pricing.
This morning’s news reinforces the view that from a short-term macroeconomic perspective, the US-China trade deal (or not) is the only game in town. It is, however, a busy week globally on the data front. We have a plethora of central bank rate decisions, starting with the Reserve Bank of Australia on Tuesday, Bank of Canada on Wednesday and the European Central Bank on Thursday. The Australian GDP and China’s trade balance will be local highlights before the week culminates with the US non-farm payrolls – the street is pricing in 180,000 additional jobs plus a possible revision to last month’s monster print.
FX
Unsurprisingly, the dollar has started the week on the back foot in early trading following the trade-talk reports. Risk-seeking flows could push further into high beta China currencies such as AUD, NZD and CNH. Regional currencies could also benefit, possibly strongly, as investors pile into emerging market-recovery positioning.
Equities
Friday saw Wall Street enjoy a good day on trade-talk hopes with the S&P closing up 0.7% and all three major indices breaking their multi-day losing streak. That theme continues in early trading following the WSJ article, with the S&P, ASX and Nikkei all comfortably in the green. Regional indices should all follow their lead today as the feel-good factor is shared. Barring any denial headlines, this should follow on into Europe as well.
Oil
Crude’s golden run ran into a brick wall on Friday as stale long positioning and threats of increasing US production saw Brent Crude fall 2.1% to USD64.75 a barrel. WTI fared even worse, falling 2.6% to USD55.50 a barrel.
The WSJ article, if right, should provide a welcome boost to oil today however, as the prospects of improved trade flow through to predicted higher energy consumption. The early trading in WTI futures seems to agree, rising 0.7% in initial trading.
Gold
Gold collapsed by 1.6% on Friday, falling USD22 to close at 1,293.00 a Troy ounce. Buoyant stock markets and risk premium reduction saw traders with medium-term long positions throw in the towel. Selling accelerated as the key USD1,300.00 support level gave way and more stop-losses came to the market.
Gold could be in for a tough day at the office, despite the fact it’s risen 0.15% to 1,295.00 in early illiquid trading, likely on a weaker dollar this morning. With investor funds likely following to emerging markets and commodities on a knee-jerk China recovery play, gold could be moved to the substitutes bench in the short term.
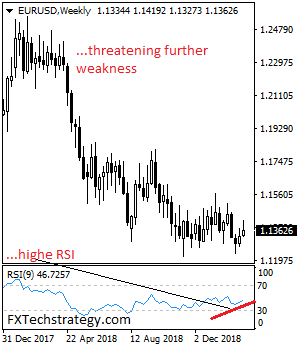
EURUSD Looks To Weaken Further Towards 1.1315/00 Zone
EURUSD looks to weaken further towards 1.1315/00 zone as it remains vulnerable. Support comes in at the 1.1300 where a violation will aim at the 1.1250 level. A break below here will target the 1.1200 level. Further down, support lies at the 1.1150. On the upside, resistance resides at 1.1400 level with a break through there opening the door for further upside towards the 1.1450 level. Further up, resistance comes in at the 1.1500 level where a violation will expose the 1.1550 level. All in all, EURUSD continues to threaten further downside pressure.
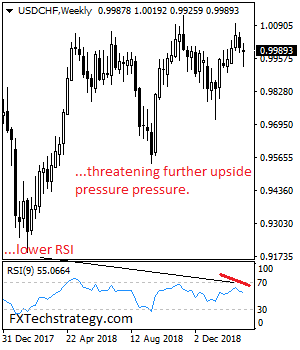
USDCHF Backs Off Lower Prices With Eyes On 1.0024 Zone
USDCHF backs off lower prices with eyes on 1.0024 zone. Resistance stands at the 1.0050 level. A break of there will clear the way for a run at the 1.0100 level. Above here, resistance lies at the 1.0150 level and then the 1.0200 level. On the downside, support is seen at the 0.9950 level. A turn below here will set the stage for more decline towards the 0.9900 level. And then the 0.9850 level. Its daily risk is bearish and pointing lower suggesting further weakness. All in all, USDCHF faces further upside pressure following its price rejection the past week.
Eco Data 3/4/19
[php_everywhere instance="1"]
EUR/USD Weekly Outlook
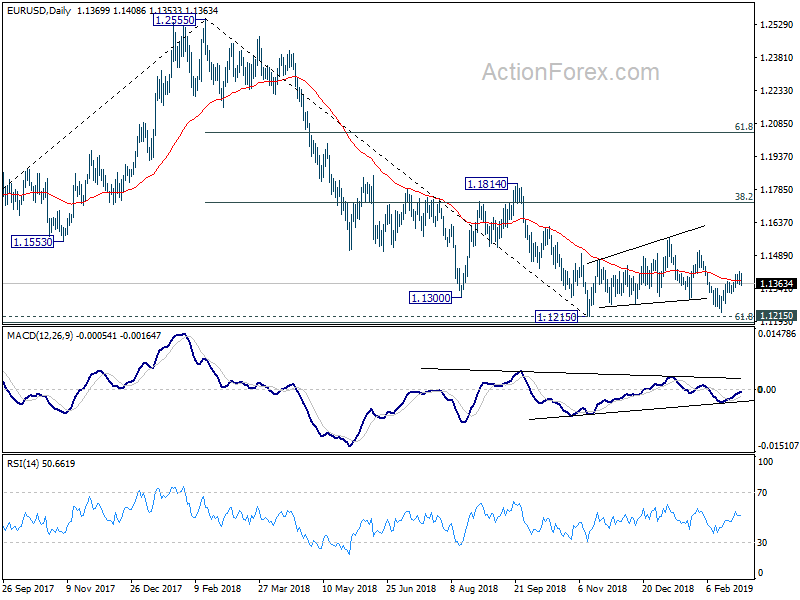
EUR/USD rebounded further to 1.1419 last week and retreated mildly since then. Initial bias is neutral this week first. Rise from 1.1234 is seen as a rising leg inside correction pattern from 1.1215 low. As long as 1.1316 minor support holds, another rise is mildly in favor. On the upside, above 1.1419 will target 1.1514 resistance next. On the downside, break of 1`.1316 will turn bias back to the downside for 1.1215 low.
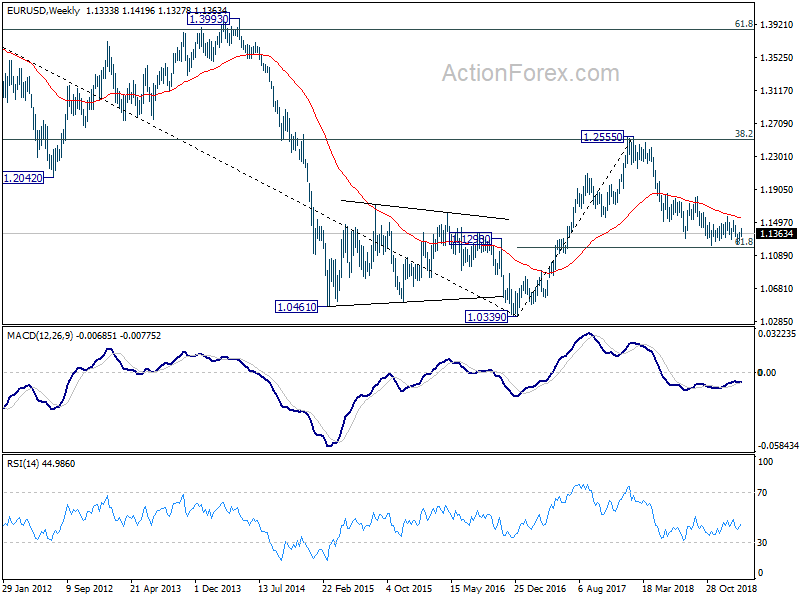
In the bigger picture, as long as 1.1814 resistance holds, down trend down trend from 1.2555 medium term top is still in progress and should target 61.8% retracement of 1.0339 (2017 low) to 1.2555 at 1.1186 next. Sustained break there will pave the way to retest 1.0339. However, break of 1.1814 will confirm completion of such down trend and turn medium term outlook bullish.
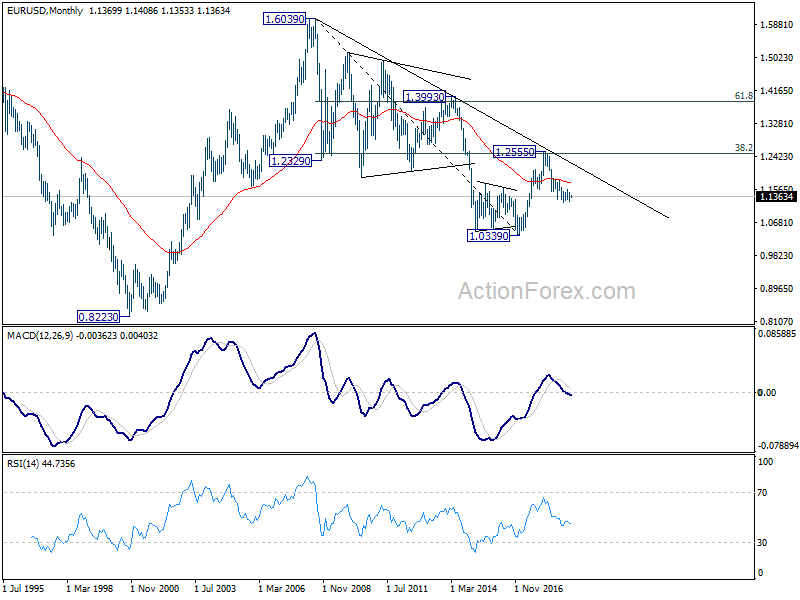
In the long term picture, the rejection from 38.2% retracement of 1.6039 to 1.0339 at 1.2516 argues that long term down trend from 1.6039 (2008 high) might not be over yet. EUR/USD is also held below decade long trend line resistance. Firm break of 61.8% retracement of 1.0339 to 1.2555 at 1.1186 should at least bring a retest on 1.0339 low. This will remain the favored case as long as 1.1814 resistance holds.
USD/JPY Weekly Outlook
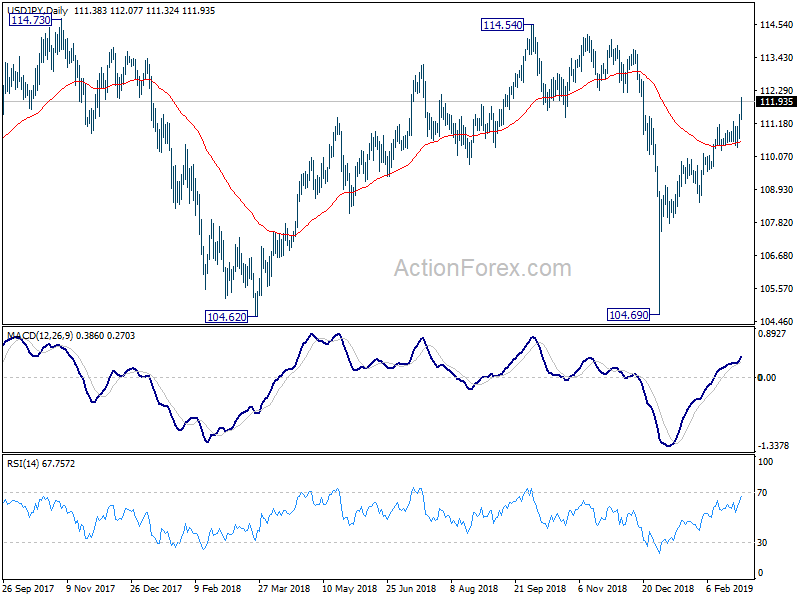
USD/JPY's rally from 104.69 accelerated to as high as 112.07 last week. Initial bias remains on the upside this week. Current rally should target 114.54 resistance next. On the downside, below 111.50 minor support will turn intraday bias neutral and bring consolidations. But downside should be contained above 110.35 support to bring another rally.
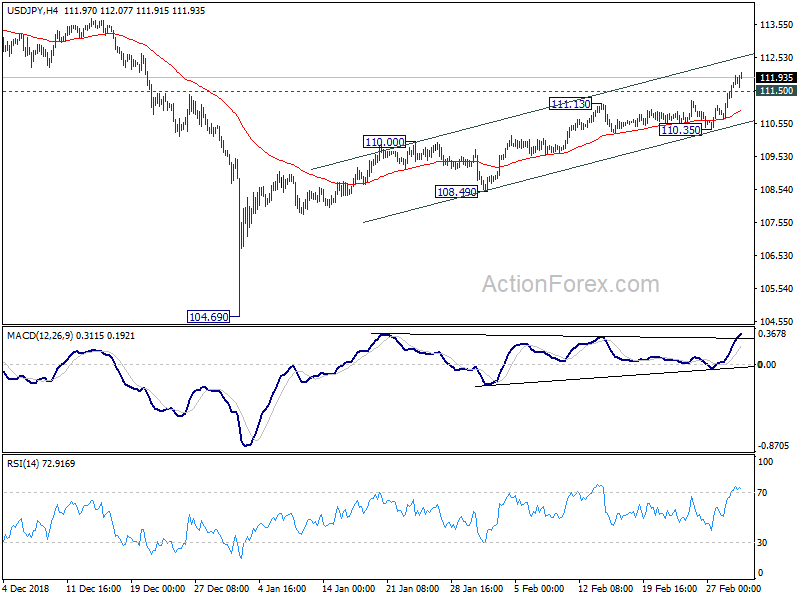
In the bigger picture, current strong rebound from 104.69 argues that decline from 118.65 (2016 high) has completed with three waves down to 104.69, after failing 104.62. More importantly, the rise from 98.97 (2016 low) could be resuming. Focus now turns back to 114.54 resistance, decisive break there will add more credence to this bullish case and target 118.65. This will now be the favored case as long as 110.35 support holds.
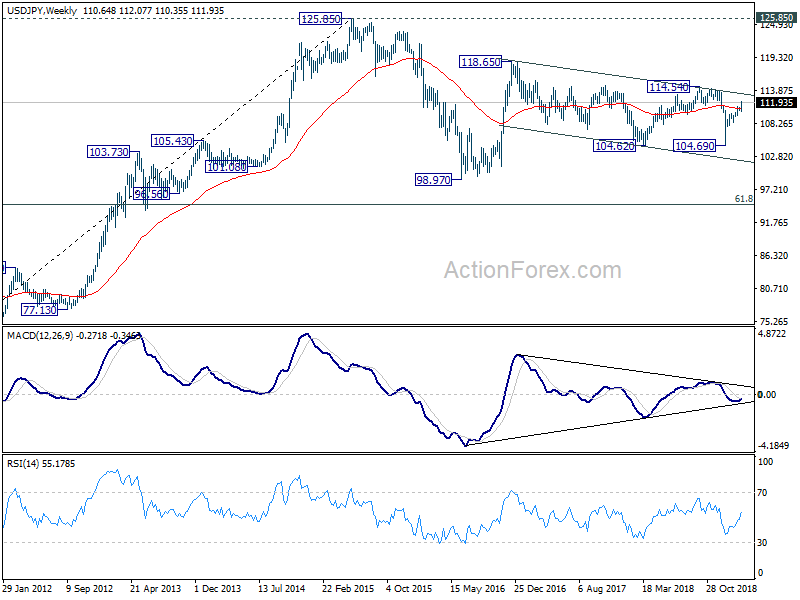
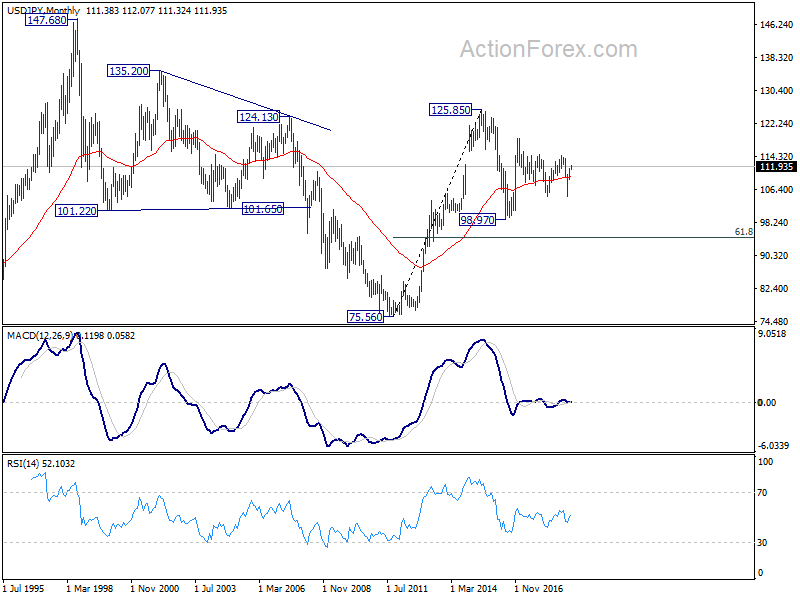
In the long term picture, the rise from 75.56 (2011 low) long term bottom to 125.85 (2015 high) is viewed as an impulsive move, no change in this view. Price actions from 125.85 are seen as a corrective move which could still extend. In case of deeper fall, downside should be contained by 61.8% retracement of 75.56 to 125.85 at 94.77. Up trend from 75.56 is expected to resume at a later stage for above 135.20/147.68 resistance zone.
GBP/USD Weekly Outlook
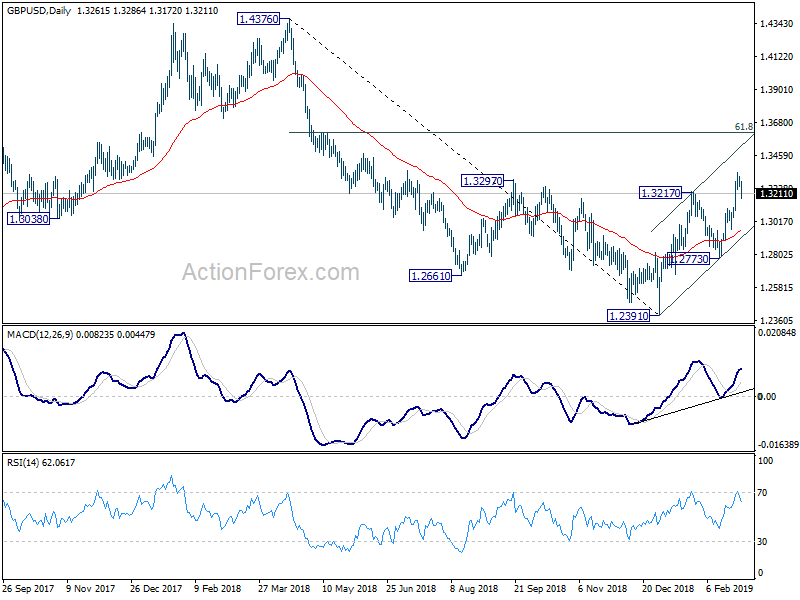
GBP./USD rose to as high as 1.3350 last week and the break of 1.3217 resistance suggests completion of fall from 1.4376. As a temporary top was formed, initial bias is neutral this week for some more consolidation first. But downside of retreat should be contained by 1.3109 minor support to bring another rally. On the upside, break of 1.3350 will extend the rise from 1.2391 to 61.8% retracement of 1.4376 to 1.2391 at 1.3618 next. Sustained break will pave the way to 1.4376. However, break of 1.3109 will turn focus back to 1.2773 near term support.
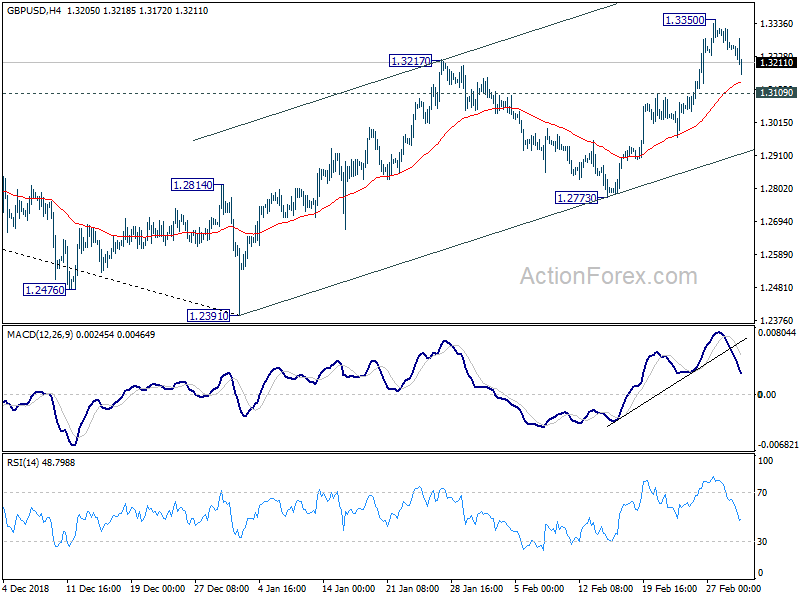
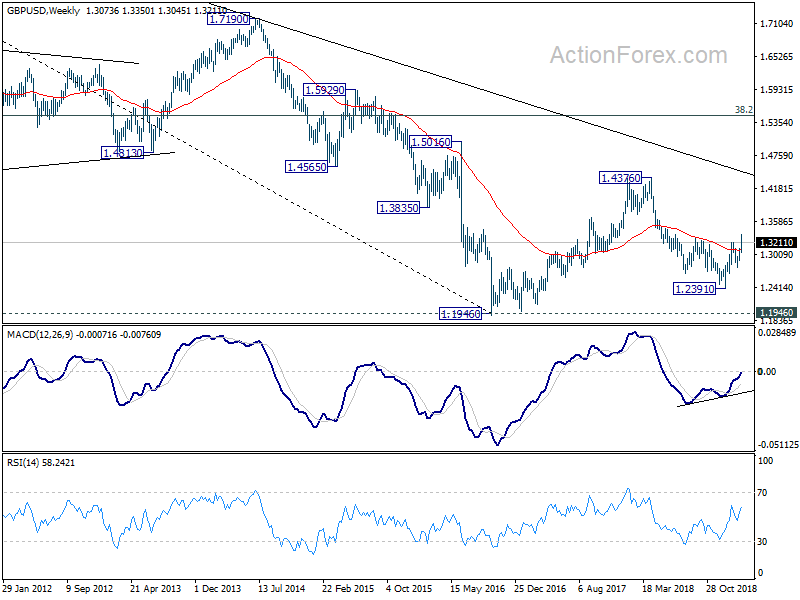
In the bigger picture, medium term decline from 1.4376 (2018 high) should have completed at 1.2391. Rise from 1.2391 is now seen as the third leg of the corrective pattern from 1.1946 (2016 low). Further rise could be seen through 1.4376 in medium term. On the downside, though, break of 1.2773 support will turn focus back to 1.2391 low and then 1.1946.
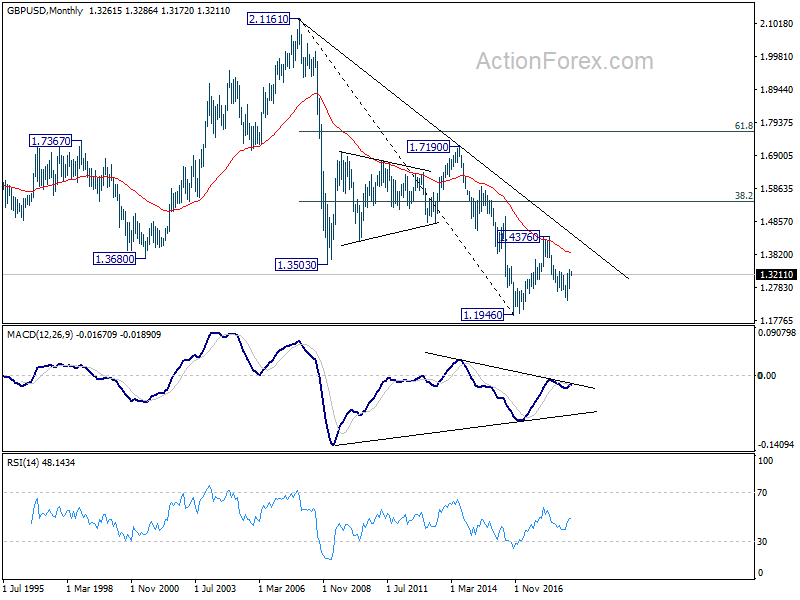
In the longer term picture, current development argues that corrective pattern from 1.1946 (2016 low) is extending with another rise. But there is no change in the long term bearish outlook as long as 38.2% retracement of 2.1161 (2007 high) to 1.1946 at 1.5466 holds. An eventual downside breakout through 1.1946 is still in favor in the long term.
USD/CHF Weekly Outlook
USD/CHF's decline from 1.0098 extended to as low as 0.9926 last week but formed a temporary bottom there and recovered. Initial bias is neutral this week first. Based on the structure of the fall, we'd treat it as a corrective pull back first. On the upside, break of 1.0014 minor resistance will suggests that the pull back is completed. Intraday bias will then be turned back to the upside for retesting 1.0098. On the downside, below 0.9926 will extend the corrective fall to 61.8% retracement of 0.9716 to 1.0098 at 0.9862. We'd look for bottoming signal again below there.
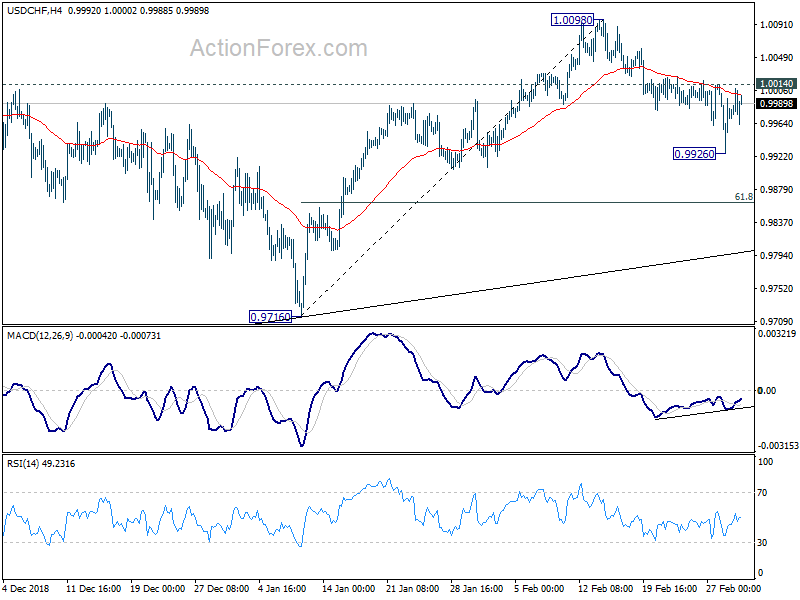
In the bigger picture, USD/CHF drew strong support from medium term trend line and rebounded. That suggests rise from 0.9186 is still in progress. Further break of 1.0128 will confirm up trend resumption and target 1.0342 key resistance. Nevertheless, break of 0.9716 will dampen this bullish view and at least bring deeper fall to 0.9541 key support.
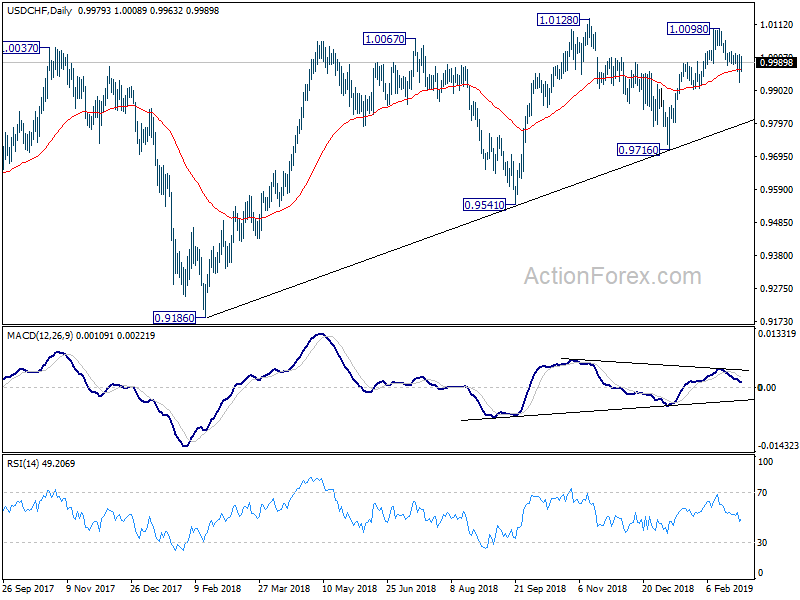
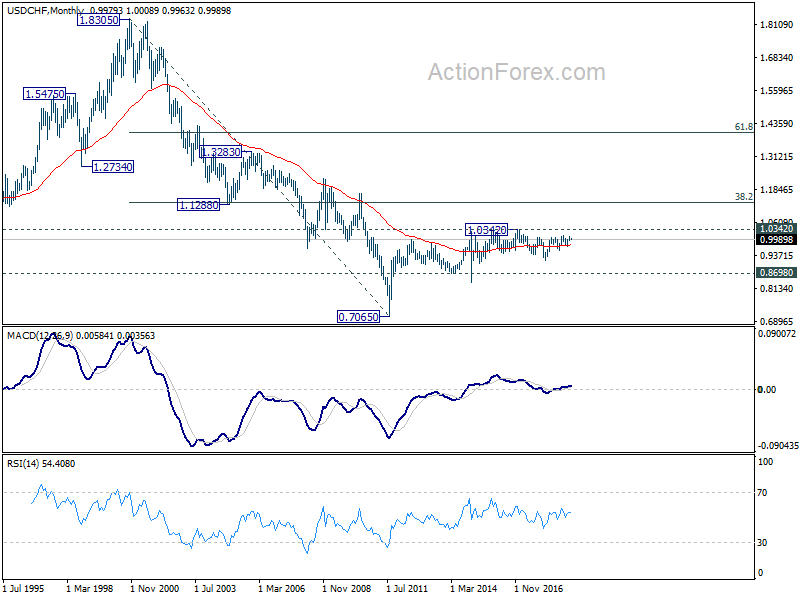
In the long term picture, price actions from 0.7065 (2011 low) are not clearly impulsive yet. Thus, we'll treat it as developing into a corrective pattern, at least, until a firm break of 1.0342 resistance.