Sample Category Title
Canadian GDP Growth Slowed Further in Q4
Highlights:
- Canadian Q4/18 GDP increased just 0.4% — softer than expectations for a 1.0% increase.
- On a monthly basis, GDP fell 0.1% in December, the second straight 0.1% decline and the third in the last four months.
- Much of the softening can be traced back to what we expect will ultimately be transitory weakness in the oil & gas sector, although household spending growth also continued to slow.
Our Take:
The 0.4% increase in Q4 Canadian GDP was down from 2.0% in Q3 and the smallest since Q2 2016. A lot of the weakness can still be traced back to softening in the oil patch in the wake of lower oil prices and announced mandated production cuts in Alberta. Investment spending was down 11% after a similar-sized drop in Q3 — likely in large part because of a pullback in the oil & gas sector that was earlier flagged by a big drop in drilling activity. Looking into the industry breakdown, activity in industries closely associated with oil & gas extraction fell ~8% at an annualized rate in Q4 as a whole. Yet growth excluding the oil & gas sector was also still only up 1%. Residential investment posted its largest decline since Q1 2009, as new construction spending fell, and consumer spending growth slowed to just 0.7% in Q4. Business investment growth was revised lower in earlier quarters as well, to leave a soft-looking 1.7% increase in 2018 as a whole.
Provided the recent recovery in oil prices holds, we expect the softening in activity in the oil & gas sector will ultimately prove temporary, although will still persist into Q1/19. Drilling rig counts have already bounced back somewhat from December lows. While household spending will remain weaker than in recent years, Q4’s very slow pace is unlikely to be sustained. Labour markets have still looked solid, and one of the (few) bright spots in today’s data was a 3.3% increase in household disposable income in Q4. But added to already slowing household debt growth and stable inflation trends, soft economic data over the winter is just another reason for the Bank of Canada to hold off on further rate hikes for now.
Canada: GDP Data Offer a Sour End to 2018
The Canadian economy ended 2018 treading water. GDP grew just 0.4% (q/q, annualized) in Q4. This fell a bit short of market expectations for a 1.0% gain. Nominal GDP, which includes price changes, fared even worse, down 2.7% as falling commodity prices dragged export prices lower. For 2018 as a whole, the economy expanded by 1.8%, owing in part to downward revisions to the figures for the first half of the year.
Discouragingly, final domestic demand contracted by 1.5%. This was the second consecutive contraction, punctuating a year-long pattern of deceleration. There was little in the way of redeeming factors. Non-residential investment fell for a third straight quarter (-10.9%) on widespread weakness across both structures and machinery and equipment spending. Residential investment was no better, falling 14.7%, as the drop in resales was joined by lower construction and renovation activity.
One notable bright spot in the investment picture was intellectual property products (+16.2%). Business spending on mineral exploration recovered, as did research and development, while software spending remained robust.
Elsewhere, household consumption decelerated to 0.7%, as spending on durable goods fell 2% (a third straight contraction). Government spending was down on the quarter (-0.6%), largely owing to a significant swing in spending on aircraft. Businesses built up inventories, which were $8bn higher, enough to add 1.5 percentage points to headline growth.
International trade was the big unknown going into today's report as the U.S. government shutdown kept some of the monthly data out of analysts' hands. With a full picture, it isn't pretty. Net exports added to growth, but this was because imports (-1.1%) fell more than exports (-0.2%). In nominal terms, it's the converse, but not in a positive way. Nominal exports fell 15% on the back of falling energy prices (the dollar value of energy product exports was down 64%). Nominal imports fell a more modest 2.4%.
On the income side, employee compensation was up 4.8%, while the capital share of income was down as the gross operating surplus fell 19.8% due mostly to the oil and gas sector. The combination of incomes and spending left the household savings rate up a tick at 1.1%, from 0.7% in the prior quarter (initially reported as 0.8%).
The monthly picture doesn't offer a good hand-off into the next quarter. Economic activity declined by 0.1% in December, although there was some comfort in seeing that the declines were not broad based, as 13 of 20 major industries grew over the month. The drop can be put down to the goods sector (-0.7%). Utilities output fell 2.0%, owing to mild December weather, while construction output was down 0.9%. On the latter, Statistics Canada noted that this was the seventh straight monthly decline, a streak that has not been seen in almost three decades. Manufacturing output was down 0.3%. Conversely, despite a soft payrolls report, services activity was up 0.2% on relatively widespread gains.
Key Implications
Ouch. We were expecting a sub-1% report, but this report still managed to disappoint given the weak composition within the sectors. Put simply, it is never a good sign when an inventory build and import contraction are the factors keeping growth above water. Deeper than anticipated declines in investment led to a sizeable drop in final domestic demand, which is down for a second straight month in a clear sign of a weakened underlying trend.
Brace yourself. Things are probably going to get worse before they get better. The monthly GDP data suggests little momentum heading into 2019, and the impact from mandatory oil curtailment in Alberta will deepen within the Q1 GDP data, shaving around a point off of Q1 growth. This places even more burden on other sectors to step up, particularly the household side in spending and housing, the two areas absorbing the greatest weight from past monetary and macroprudential policy changes. The job and income side of that equation remains impressive, as does strong fundamental demand from an upward population swing. We are keeping the faith in households producing a positive print in that quarter.
The pieces of this puzzle lead to a picture that, even abstracting from energy-sector shocks, sends a message to the Bank of Canada that past rate increases when combined with macroprudential policy have been more dampening than expected. With inflationary pressures still missing in action, we may indeed be approaching the period Governor Poloz calls being "home" on the rate-policy side. The true test will come when 2019Q2 data becomes known on the resiliency of households and businesses alike.
U.S. Consumers Closed Their Wallets in December
In a mixed release (due to government shutdown), the BEA reported a decline in personal income (-0.1%) in January, but following an upwardly revised 1% gain in December. Despite the income gain, personal spending fell 0.5% in December in nominal terms, and 0.6% after adjusting for inflation. This marks the worst performance since September 2009.
Special factors boosted income growth in December including a one-time dividend payment by VMware Incorporate and increased farm subsidy associated with the Department of Agriculture’s Market Facilitation Program.
Spending pulled back on all components, led by durable goods (-1.9%). Non-durables fell 1.2%, while services pulled back 0.2%.
With income up and spending falling, the personal saving rate rose to 7.6% from 6.1% in November.
Inflation in the PCE deflator decelerated to 1.7% in December (from 1.8%). Core PCE inflation remained steady at 1.9% in the month.
Key Implications
December is looking like an all-around terrible month for U.S. economic data. Some of the pullback in spending in December likely reflects undue strength in November, which may indicate a pulling forward of typical seasonal spending, distorting the read somewhat.
Not only are we looking further back in the rear view mirror than usual, but the combination of government shutdown and exceptional financial market volatility makes reading the economic tea leaves that much more difficult. That said, both of these impacts have since faded (for now), which should lead to a better reading on more recent economic data (when it is finally released).
Fundamentals for consumer spending are solid. Job growth has maintained its strong pace, and wage growth is accelerating. Consumers have an ample cushion to spend. This should lead consumer spending to improve to above 2% in the second quarter.
Sunset Market Commentary
Markets:
Global core bonds are again losing ground with US Treasuries underperforming German Bunds. Recent selling pressure on core bonds sought confirmation today. Risk sentiment remained positive in Asia overnight and was supported by stronger than expected German retail sales. European equities opened higher, giving core bonds a downward bias at the start of the day. EMU eco data printed mixed and had little impact on trading. The German yield curve bear steepened with changes up to +2.7 bps (30-yr). US Treasuries moved similar to German Bunds and edged gradually lower throughout the day as US eco data didn’t surprise. The uptick in risk sentiment continued in the US, as equities opened confidently higher. The downward move of US Treasuries continued leading the US yield curve higher with changes up to +3.5 bps (5-yr). Italian BTP’s initially gained ground on a stronger than expected Manufacturing PMI result (47.7, vs. 47.2 expected), but paired those gains. Peripheral spreads over the German 10-yr yield remain close to unchanged with Italy (-2 bps) and Greece (-3 bps) outperforming.
Earlier this week the euro outperformed the dollar, but the balance between the two currencies was restored after a solid US GDP and strong Chicago PMI yesterday. This morning, markets didn’t get enough new info to tilt this balance to one side or another as EMU data were mixed (cf infra). This complex of data was wasn’t able to give EUR/USD trading a clear directional push. The US core PCE deflator for January was in line with expectations. An intraday dip attracted new buyers. In volatile trading, EUR/USD again traded in the 1.1385 area around the open of US equity markets, awaiting the publication of the US manufacturing ISM. A soft ISM might cause a new attempt of EUR/USD to regain the 1.14 mark. USD/JPY extended recent uptrend supported by a further rise in US (& EMU) yields, but the move slowed after the US ISM result.
Sterling fell prey to profit taking yesterday. A series of high profile political/Brexit event (risks) had passed without derailing UK PM May’s roadmap. However, at the same time, markets apparently concluded that the diminishing risk of a ‘no-deal Brexit’ was sufficiently discounted. A countermove on recent sterling rally started. EUR/GBP rebounded back higher in the 0.85 big figure. This GBP-profit taking move continued today. UK eco data were mixed. Consumer credit remained remarkably strong. The UK manufacturing PMI slowed from 52.6 to 52.0 (as expected) confirming a cautious attitude with UK corporates in the sector as Brexit uncertainty lingers. EUR/GBP initially drifted sideways in the 0.8575 area, but renewed sterling selling finally pushed EUR/GBP temporary back up to the 0.86 area in volatile trading. In a weekly perspective, sterling still shows a solid gain both against the euro and the dollar. Cable is currently again trading in the lower half of the 1.32 big figure.
News Headlines:
Canadian GDP growth unexpectedly grinded to a halt in the final quarter of last year. GDP grew by 0.4% Q/Qa, below 1% Q/Qa forecasts. Consumption slowed further to 0.7%, the weakest since 2015 with investments dropping sharply (-10.3% following a -6.7% decline in Q3). The Canadian loonie lost ground after the release with USD/CAD rising 1 big figure returning north of the 1.32 mark.
EMU eco data printed mixed to stronger today. Volatile German retail sales rose by 3.3% M/M in January following an upwardly revised -3.1% M/M in December. The final EMU manufacturing PMI was marginally upwardly revised to 49.3, but remains below the boom/bust mark. The EMU unemployment rate stabilized at a cycle low of 7.8%. Headline inflation ticked up to 1.5% Y/Y, but the core measure remains stubbornly low at 1% Y/Y.
The US manufacturing ISM fell more than forecast in February, from 56.6 to 54.2, a 2-year low, (vs 55.8 expected). Details disappointed as well, with new orders, production, supplier deliveries and employment falling. An index of prices paid fell to a 3-yr low of 49.4.
US ISM manufacturing dropped to 54.2, employment dropped to 52.3
US ISM manufacturing index dropped to 54.2 in February, down from 56.6, missed expectation of 56.0. Looking at the details, new orders dropped -2.8 to 55.5. Production dropped -5.7 to 54.8. Employment dropped -3.2 to 52.3. Prices dropped -0.2 to 49.4.
ISM noted that:
- Comments from the panel reflect continued expanding business strength, supported by notable demand and output, although both were softer than the prior month.
- Demand expansion continued, with the New Orders Index reaching the mid-50s, the Customers' Inventories Index scoring lower and remaining too low, and the Backlog of Orders returning to a low-50s expansion level.
- Consumption (production and employment) continued to expand but fell a combined 8.9 points from the previous month's levels.
- Inputs — expressed as supplier deliveries, inventories and imports — stabilized at a mid-50s level and had a slight negative impact on the PMI®. Inputs continue to reflect an easing business environment, confirmed by Prices Index contraction.
- Exports continue to expand, at slightly stronger rates compared to January. The manufacturing sector continues to expand, but inputs and prices indicate easing of supply chain constraints.
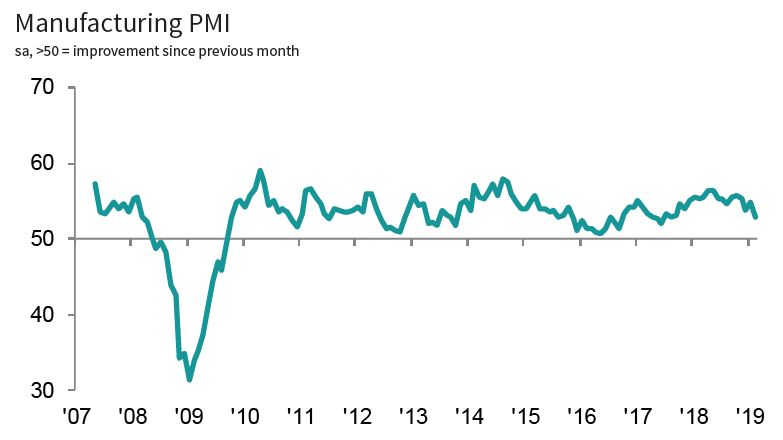
US PMI manufacturing dropped to 18-month low, downside risks prevail for coming months
US PMI manufacturing dropped to 53.0 in February, lowest level in 18 months. Markit noted that "operating conditions improve at slowest pace since August 2017 ", "rates of output and new order growth soften", and "inflationary pressures ease".
Chris Williamson, Chief Business Economist at IHS Markit said:
"The PMI indicates the US manufacturing sector is growing at its weakest rate for one and a half years, with firms reporting a marked easing in production growth in February, linked to a similar slowdown in order book growth.
"The survey exhibits a strong advance correlation with comparable official data, and suggests that factory production and orders growth rates are close to stalling mid-way through the first quarter, albeit in part representing some pay-back after a strong January. Export markets remained the principal drag on order books.
"Having seen demand grow faster than production through much of 2018, order book and output trends have come back into line in recent months, hinting at an alleviation of capacity constraints as demand cools. Backlogs of works barely rose as a result, and price pressures have likewise moderated, though tariffs were again reported to have pushed costs higher. Hiring has consequently also slowed.
"Worries regarding the impact of tariffs and trade wars, alongside wider political uncertainty, undermined business confidence, with expectations of future growth running at one of the most subdued levels seen for over two years and suggesting downside risks prevail for coming months."
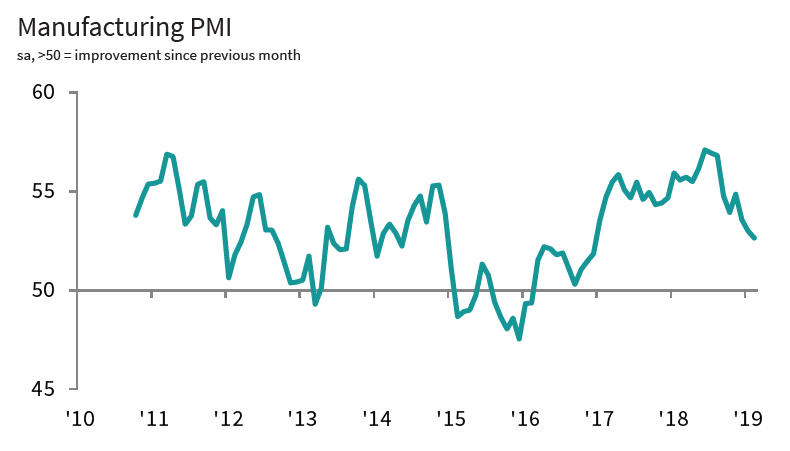
Canada PMI manufacturing dropped to 26-month low, weaker employment growth the main factor
Canada PMI manufacturing dropped to 52.6 in February, lowest level in 26 months. Markit noted weakest upturn in overall business conditions since December 2016, softer jobs growth offsets slight rebound in new orders, and production levels rise at moderate pace.
Christian Buhagiar, President and CEO at SCMA said:
"Canadian manufacturers experienced a slowdown in overall business conditions during February, with weaker employment growth the main factor weighing on the headline PMI reading.
"Production growth was relatively subdued, reflecting a sustained soft patch for incoming new work so far this year. Survey respondents noted that trade frictions and heightened global economic uncertainty had led to delayed decisionmaking among clients on new orders.
"The main positive developments were signs of reduced pressure on supply chains and a fall in input cost inflation to its lowest since September 2016. The latest deterioration in vendor performance was the least marked for almost two years, despite reports that adverse weather conditions had caused some disruption to supply chains in February."
EUR/USD Mid-Day Outlook
Daily Pivots: (S1) 1.1346; (P) 1.1383; (R1) 1.1407; More.....
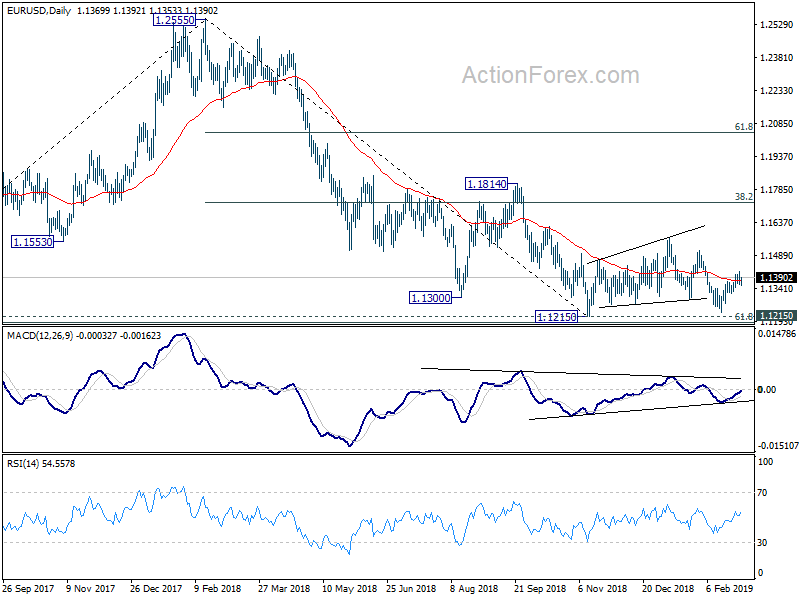
Intraday bias in EUR/USD remains neutral for consolidation below 1.1419 temporary top. As long as 1.1316 support holds, another rise is still in favor. Current rally is seen as another leg in the consolidation pattern from 1.1215. Break of 1.1419 will target 1.1514 resistance and above. On the downside, though, break of 1.1316 minor support will argue that the rebound is completed. Intraday bias will be turned back to the downside for 1.1215 low.
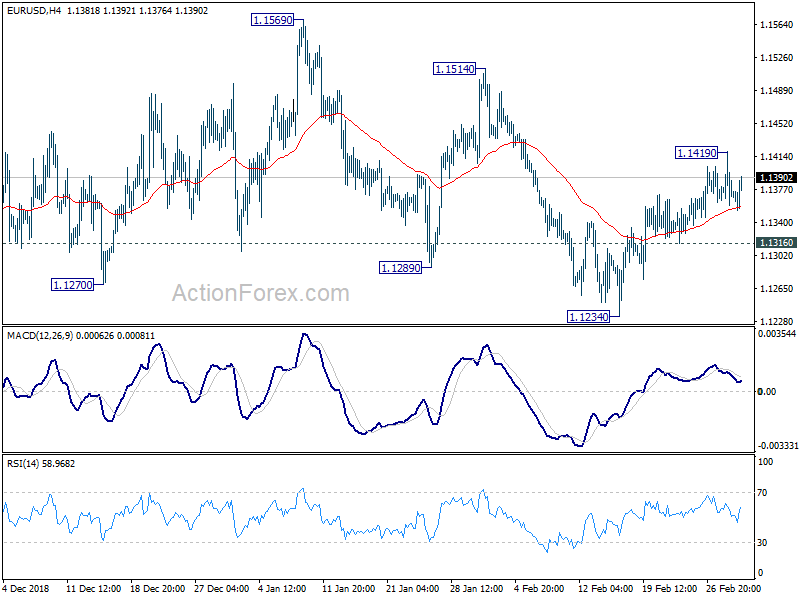
In the bigger picture, as long as 1.1814 resistance holds, down trend down trend from 1.2555 medium term top is still in progress and should target 61.8% retracement of 1.0339 (2017 low) to 1.2555 at 1.1186 next. Sustained break there will pave the way to retest 1.0339. However, break of 1.1814 will confirm completion of such down trend and turn medium term outlook bullish.
GBP/USD Mid-Day Outlook
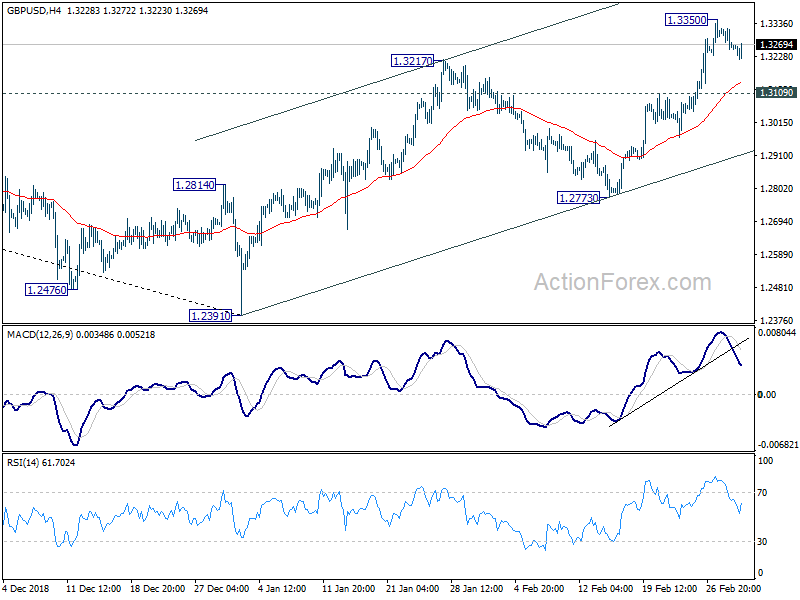
Daily Pivots: (S1) 1.3237; (P) 1.3279; (R1) 1.3303; More....
GBP/USD is staying in consolidation below 1.3350 temporary top and intraday bias remains neutral. Downside of retreat should be contained by 1.3109 resistance turned support to bring rise resumption. On the upside, break of 1.3350 will will target 61.8% retracement of 1.4376 to 1.2391 at 1.3618 next. Sustained break will pave the way to 1.4376. However, break of 1.3109 will turn focus back to 1.2773 near term support.
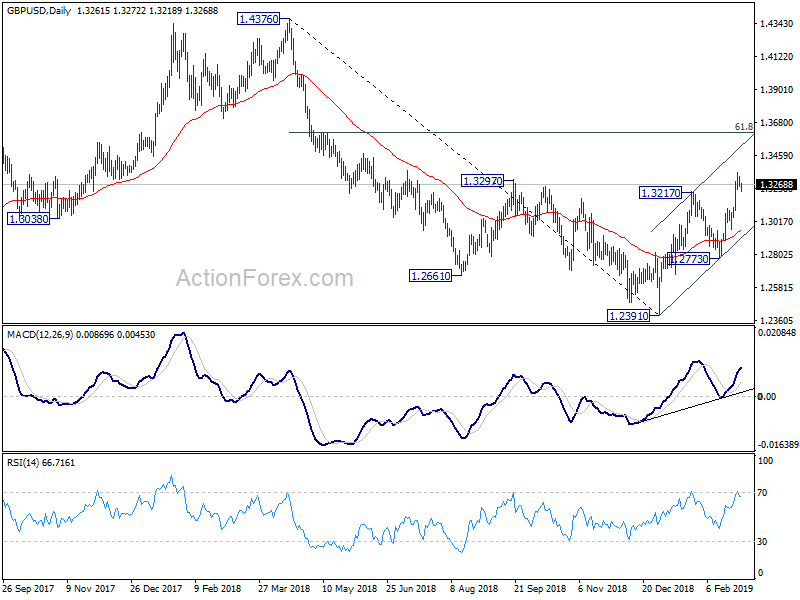
In the bigger picture, medium term decline from 1.4376 (2018 high) should have completed at 1.2391. Rise from 1.2391 is now seen as the third leg of the corrective pattern from 1.1946 (2016 low). Further rise could be seen through 1.4376 in medium term. On the downside, though, break of 1.2773 support will turn focus back to 1.2391 low and then 1.1946.
USD/CHF Mid-Day Outlook
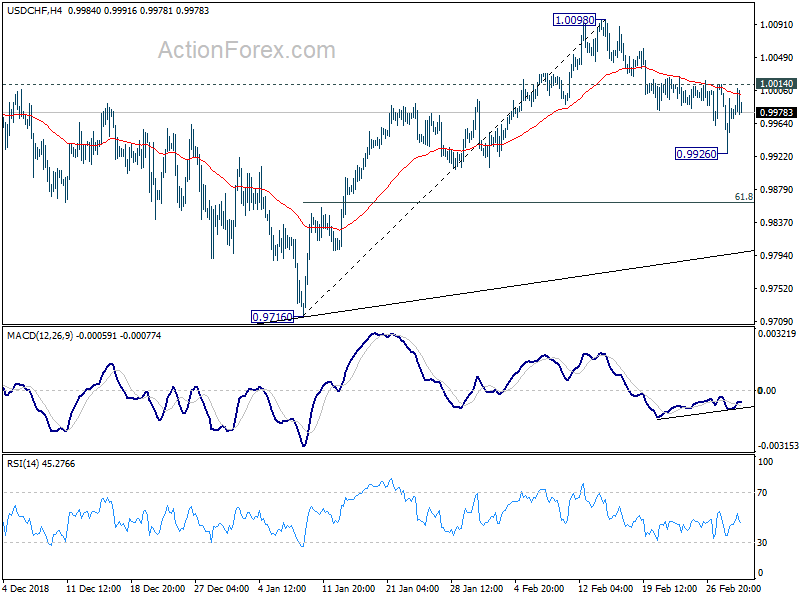
Daily Pivots: (S1) 0.9932; (P) 0.9974; (R1) 1.0023; More...
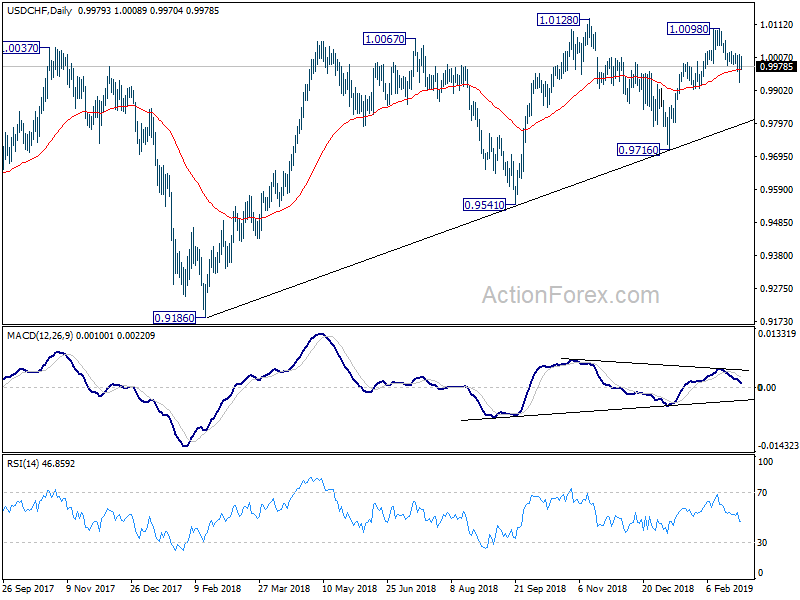
Intraday bias in USD/CHF remains neutral for consolidation above 0.9926 temporary low. Further decline is still in favor as long as 1.0014 minor resistance holds. On the downside, break of 0.9926 will resume the decline from 1.0098 to 61.8% retracement of 0.9716 to 1.0098 at 0.9862. We'd look for bottoming signal again below there. On the upside, break of 1.0014 minor resistance will suggests that the pull back from 1.0098 has completed. In this case, intraday bias will be turned back to the upside for 1.0098/0128 resistance zone.
In the bigger picture, USD/CHF drew strong support from medium term trend line and rebounded. That suggests rise from 0.9186 is still in progress. Further break of 1.0128 will confirm up trend resumption and target 1.0342 key resistance. Nevertheless, break of 0.9716 will dampen this bullish view and at least bring deeper fall to 0.9541 key support.